An urban forest is composed of all the trees, palms, and associated vegetation in and around human settlements on both public and private lands. The urban forest in Miami-Dade County provides residents with ecosystem services (i.e., ecological processes and functions that are important for human well-being) such as air pollution reduction, stormwater control, and energy savings, as well as other social benefits like crime reduction, increased real estate values, and improved livability. To maximize the benefits from urban forests, one must also consider, and minimize, the associated costs of long-term maintenance activities such as pruning and debris removal, costs related to health effects from the human allergenic reactions to certain species, and other costs as well. In recent years, Miami-Dade County's urban forest has been affected by hurricanes, increased rates of urbanization, and changes in the local economy. Also, the county's climate, soils, and urban infrastructure are constantly shaping its urban forest. To better understand Miami-Dade County's urban forest and the ecosystem services it provides, this publication will analyze its composition and structure, canopy cover, carbon sequestration and storage, and air pollution removal. Information on the effects of trees on temperature reduction and energy use in residential buildings, and other benefits and considerations will also be provided. The information from this publication can be used by urban foresters, residents, and planners to better understand and manage this important natural resource.
How was this done?
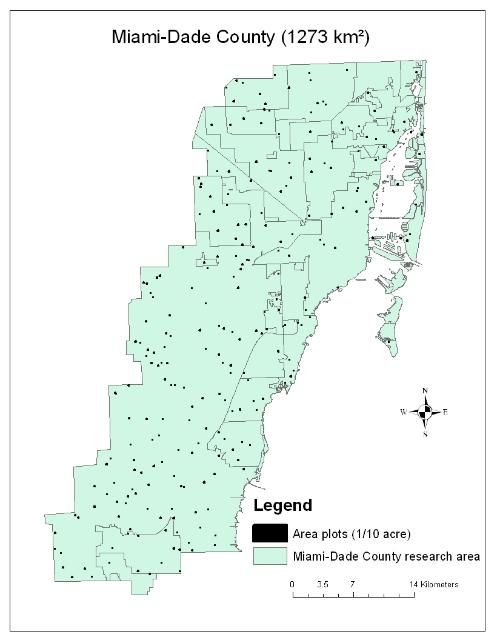
We collected data by sampling 229 one-tenth-acre field plots during 2008 in an area of 314,565 acres (127,300 ha) in the urbanized portion of Miami-Dade County, Florida (Figure 1). In these plots the following data were recorded for trees with a diameter of at least 2.5 cm at 1.4 meters above the surface: diameter at breast height (DBH), species, height, crown characteristics, location, and, when appropriate, distance and direction relative to residential buildings. We also collected tree canopy cover, land use conditions, shrub characteristics, and surface cover information (specific methods and measurements can be found in Zhao et al. 2010). The data were analyzed using the USDA Forest Service's Urban Forest Effects (UFORE) model (Nowak et al. 2002; http://www.ufore.org), which uses field measurements and algorithms to estimate urban forest structure (e.g., leaf area, tree density, etc.) and various ecosystem services and their values. For example, the model estimated leaf area as the sum of tree leaf surfaces using allometric equations and field measurements. The model estimated carbon storage as the proportion of carbon in the form of woody biomass held in the tree's stem and branches over its lifetime. Carbon sequestration was the estimated amount of annual carbon removed by trees through their growth. Growth rates and species characteristics in the model were adjusted for the condition in the Miami-Dade county area. Specific details on the UFORE model and its application in Miami-Dade can be found in Nowak et al. (2002) and Escobedo et al. (2010a).
To estimate carbon storage, the model uses a tree's size and dry weight biomass relationship. Approximately 50% of a tree's dry weight biomass is carbon. Carbon sequestration is estimated using the average annual growth rate for specific types of trees, as well as their size, condition, and carbon emissions due to eventual decomposition (Nowak and Crane 2002). Since carbon is exchanged in carbon offset markets in units of carbon dioxide, carbon storage and sequestration estimates were then converted to carbon dioxide (CO2) equivalents (i.e., mtCO2). More information about urban forests and carbon markets is available at: https://urbanforestrysouth.org/search?SearchableText=carbon+markets. Values were multiplied by $4/metric ton of carbon dioxide (mtCO2) equivalent based on market values in August 2008 (Chicago Climate Exchange 2008). We also used geostatistics and Geographical Information Systems (GIS) to map the variability in tree carbon sequestration across the study area (Escobedo et al. 2010a).
Air pollution removal by trees in Miami was modeled using measured tree cover and leaf area data as well as hourly pollution and weather data for 2000 from Miami-Dade County. The amount of pollution removal was calculated for ozone (O3), sulfur dioxide (SO2), nitrogen dioxide (NO2), carbon monoxide (CO), and particulate matter less than ten microns (PM10). More details and methods for the measurement of air pollution removal by urban trees are provided in Nowak et al. (2002).
Finally, the effect of urban trees on energy use (i.e., heating and cooling) for residential buildings is based on field measurements of the distance and direction of trees greater than 20 feet tall within 60 feet of space-conditioned residential buildings with two or fewer stories. The UFORE model also incorporates tree type (evergreen or deciduous), age of building and building energy-use characteristics, regional climate characteristics, and common carbon dioxide emissions from the generation of electricity in the southeastern United States (McPherson and Simpson 1999; Nowak and Crane 2002; Escobedo et al. 2010a).
How many and what type of trees are there in urban Miami-Dade County?
More than 1,000 trees, including 107 different tree species belonging to 90 genera, were measured during the study (Zhao et al. 2010). Miami-Dade's urban forest is composed of a relatively diverse number of species. Approximately 55% of all tree species identified and 45% of all trees sampled were not native to the state of Florida or the southeastern United States and originated mainly from Asia. Approximately 15% of all trees measured are considered Category 1 invasive species (FLEPPC). Based on the collected data, there are an estimated 36 million trees in the Miami-Dade County study area. Approximately 5% of all trees measured were located on publicly maintained street rights of way. An additional 10% of the trees were located in other public areas, with the remaining 85% on private property.
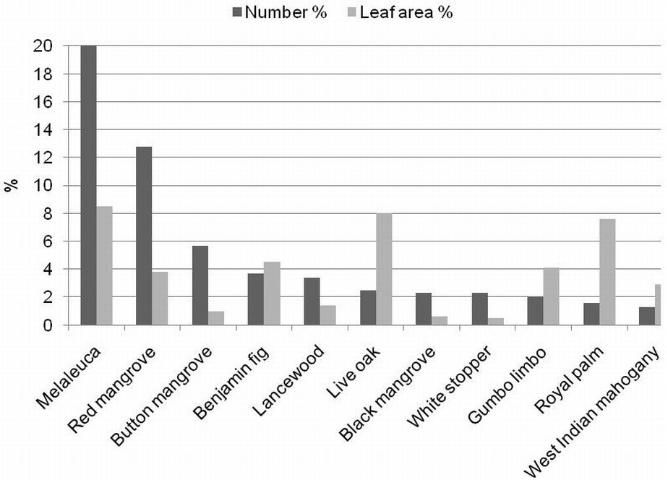
The 10 most common species accounted for 54% of all trees. The four most common species in the county in terms of numbers were melaleuca, (Melaleuca quinquinervia), red mangrove (Rhizophora mangle), button mangrove (Conocarpus erectus) and Benjamin fig (Ficus benjamina) at 42%, 13%, 6%, and 4% of the total tree population, respectively (Figure 2). Tree composition varied by land use. Benjamin fig, in terms of the total number of trees on each land use, was most common on commercial and residential lands (39% and 23% respectively), royal palm (33%) dominated agricultural land, melaleuca (94%) dominated vacant land, red mangrove dominated park and institutional lands (31% and 54% respectively), and bottle palm (Hyophorbe lagenicaulis) dominated transportation lands (29%). In all land use categories, except for vacant areas, species were diverse.
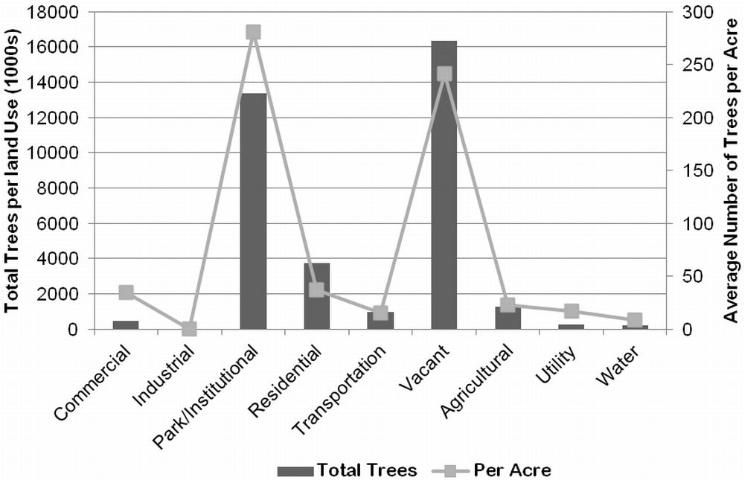
The highest tree density per land use, or number of trees per acre, occurred on park/institutional lands. The term "park/institutional lands" is commonly used to describe public lands such as parks, schools, government facilities, and conservation areas. In Miami-Dade County, the designation includes mangroves. An institutional land-use category is often used for inter and intra-city comparison of urban forest structure characteristics (Escobedo et al. 2010b). Because of the inclusion of mangroves, the institutional land use had 281 trees/acre but ranged from 164 to 398 trees/acre. The next largest category was vacant areas, with an average of 242 trees/acre. Residential areas had 38 trees/acre, and agricultural areas had 23 trees/acre (Figure 3). The average tree density in Miami-Dade across all its land uses is 92 trees/acre, which is greater than tree densities in other cities in the United States (most cities average about 14 to 119 trees/acre), but less than other cities in Florida (Escobedo et al. 2010b). City-wide, approximately 80% of all of Miami-Dade's trees are found in parks/institutional and vacant areas. Although tree density is often related to tree canopy, many small trees with low leaf areas (e.g., white stopper) will contribute less to canopy cover than few large trees with high leaf areas (e.g., live oaks). This will be discussed in a later section. Finally, tree crown condition according to the amount of dieback in individual tree crowns also varies by land use. Overall, 91% of the trees in the county were classified as being in "good" and "excellent" condition, while 9% were classified as "poor," "declining," or "dead."
How much urban forest canopy and cover?
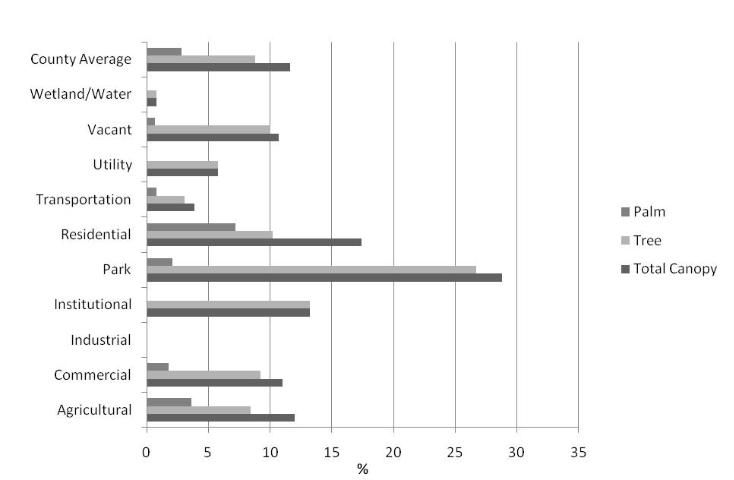
Most ecosystem benefits from trees are linked directly to the amount of healthy urban forest canopy cover. Urban forest cover is dynamic and changes over time due to factors such as urban development, hurricanes, tree planting, tree removal, demographic changes, and individual tree growth. The distribution of the county's 12% canopy cover varies according to land use, neighborhood, site conditions (e.g., available sunlight, irrigation, soils, etc.), and people's plant selection and landscape design preferences (Figure 4; Zhao et al. 2010; Flock et al. 2011). About 9% of this cover is from woody trees and the remaining 3% is from palms. Woody and palm-like shrubs cover about 8% of the county's surface. The following section examines how urban forest structure and distribution influence urban forest canopy and leaf area and how tree and ground surface covers vary across Miami-Dade. To better assess the contribution of parks and conservation areas (natural areas such as mangroves and pine rocklands) to tree canopy, we analyzed them separately from other institutional land sites such as schools and other public government facilities (Figure 4). Conservation areas and parks had greater canopy cover than other urban land uses.
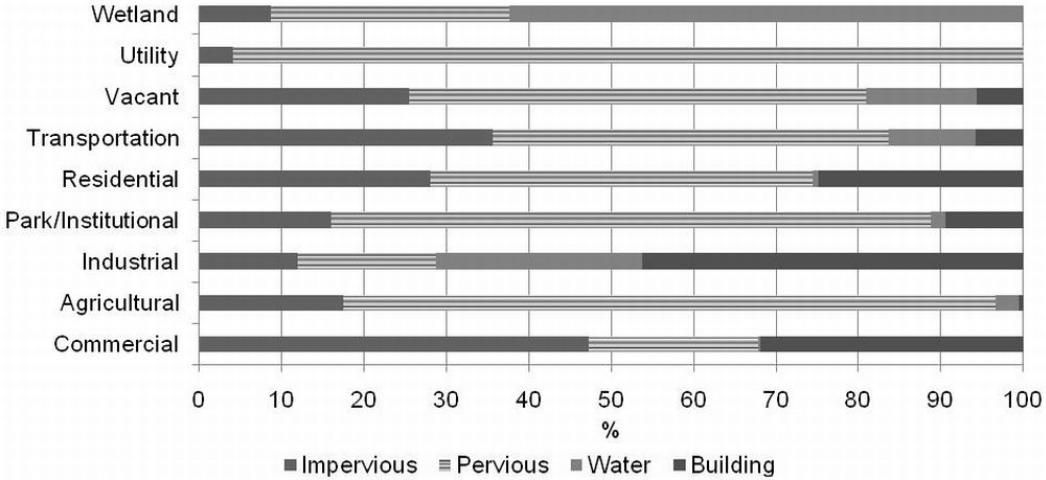
Commercial and industrial areas had the least amount of pervious surfaces (e.g., surfaces such as bare soil, grass, vegetation litter, etc.) (Figure 5). Information on the percent of impervious and building surfaces can be used to better understand potential problem areas for stormwater runoff. The percentage of pervious surfaces can be used as an indicator of potential tree planting areas.
While all tree species contribute to the community's overall urban forest cover, some species contribute more than others because of their size and structure (e.g., a large live oak contributes more than a small palm). Figure 2 shows that trees that provide the greatest total leaf area are melaleuca (Melaleuca quinquinervia), live oak (Quercus virginiana), royal palm (Roystonea elata) and Benjamin fig (Ficus benjamina). The most numerous are melaleuca, red mangrove (Rhizophora mangle), and button mangrove (Conocarpus erectus). While species such as red mangrove and button mangrove both represent large percentages of the total population (Figure 2), their "importance value," or taking into account their proportional number and leaf area (4% and 1%, respectively), is less than that of other species such as live oak and even royal palm, which together contributed to 8% of Miami-Dade County's total leaf area. Escobedo et al. (2010b) provides importance values for several tree species found in Florida's urban forests.
In summary, most of the county's trees are found in parks, vacant, and institutional areas. About a third of the county's canopy is comprised of palm cover, and impervious surfaces are predominantly found in transportation and commercial areas. Many tree benefits are linked directly to the amount of healthy leaf surface area. An urban forest manager who understands how canopy cover changes and who has a good working knowledge of the extent of canopy cover by tree species, neighborhood, and land use category, can better develop comprehensive management goals and objectives. For example, desired ecosystem services can be improved by favoring species that contribute to canopy cover goals or by targeting specific land use categories for planting where canopy cover values are lowest.
How much carbon dioxide do trees sequester and store?
Climate change is an issue of global concern. Urban trees can help mitigate climate change by sequestering carbon in their biomass, thus reducing atmospheric carbon dioxide (Nowak and Crane 2002). Also, tree shade can reduce the amount of carbon dioxide in the atmosphere by affecting building heating and cooling energy needs (McPherson and Simpson 1999). When building energy use is reduced, carbon dioxide emissions from fossil fuel-based power plants are decreased. So, by estimating the amount of carbon dioxide removed by trees and their shading and windbreak effects on buildings, we can determine the role of urban forests in mitigating climate change, assign an economic value to the amount of carbon sequestered, and determine the carbon offset potential of an urban forest (Escobedo et al. 2010a).
Because they are comparatively small, young trees with a small DBH sequester less carbon (Nowak and Crane 2002). Eventually if they continue to stay healthy and grow they will accumulate more carbon as their biomass increases. Large trees in the county greater than 77 inches in DBH continue to sequester the most carbon (Table 1). Carbon sequestered by trees can then be converted to carbon dioxide, which is more commonly used to assess economic value and offset potential (See Table 1 and Escobedo et al. 2010a for C to CO2 conversions).
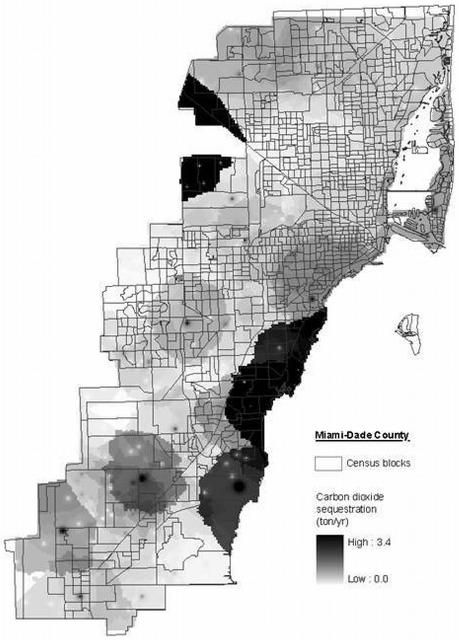
Healthier and larger trees sequester the greatest amount of carbon dioxide annually (Nowak and Crane 2002). The county's trees sequester 564,500 metric tons of CO2 per year with an economic value of $2.3 million. As trees grow, they store more carbon by assimilating it in woody tissue. When trees are removed and burned or converted to chips or mulch, or when they die and decay, they release much of the stored carbon back into the atmosphere, so it is necessary to plan and manage for long-term urban forest structure. Table 2 compares the economic value and net carbon and carbon dioxide sequestered by trees located in different land use areas in Miami-Dade. Vacant and park/institutional lands, which tend to have the highest tree densities, also provide the largest carbon sequestration benefits of all land uses. More specifically, areas characterized by natural pine rocklands, mangroves, and stands of highly invasive melaleuca trees were most apt at sequestering CO2 because of greater tree sizes and densities (Figure 6; Escobedo et al. 2010a). Urban tree sequestration offsets about 2% of all CO2 emissions during the year county-wide. However, current CO2 sequestration by urban trees is just as effective in offsetting CO2 as many CO2 emission reduction policies recently implemented in the county (improved transportation management, better solid waste management practices, and improved facility operations, for instance) (Hefty et al. 2007; Escobedo et al. 2010a).
How much air pollution do trees remove?
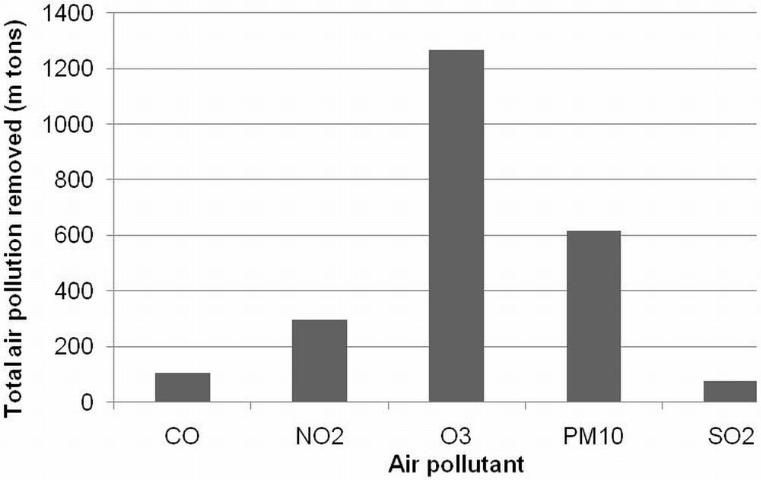
An average square meter of tree cover in Miami-Dade removes 7 grams of air pollutants. In general, the larger a tree is, the greater its leaf area, and the better its condition, the greater its air pollution removal ability (Table 1; Escobedo 2007). Total pollution removal was greatest for ozone (O3), followed by particulate matter less than ten microns (PM10), followed by nitrogen dioxide (NO2), carbon monoxide (CO), and sulfur dioxide (SO2) (Figure 7). It is estimated that in the year 2000 trees removed 2,350 metric tons of air pollution from CO, NO2, O3, PM10, and SO2.
Trees can also emit volatile organic compounds (VOCs). When VOCs combine with nitrogen oxide pollutants under hot and sunny conditions, VOCs can form ground-level ozone pollution (Escobedo and Seitz 2009). Certain tree species emit more VOCs than other species, so the potential VOC emissions from different tree species need to be considered when developing tree species lists and assessing the overall role of trees in air quality improvement (Nowak et al. 2002). Given Miami-Dade's urban forest structure and composition, approximately 75% of VOC emissions were from oaks, Australian pines and royal palms.
Tree Shading Effects on Temperature and Energy Use in Residential Buildings
Trees affect energy use by shading buildings, providing evaporative cooling, and blocking winter winds in more temperate areas. Properly located trees that shade buildings tend to reduce building air conditioning use in the summer months. However, an evergreen tree that shades a building during the winter can increase heating use in that building. Based on the size of a building and the location and characteristics of surrounding trees, we can calculate an economic value for the effect of trees on energy use in residential buildings of two stories or less (McPherson and Simpson 1999; Escobedo et al. 2010a).
Based on a 2007 average retail price of electricity in Florida (EIA 2007), trees in Miami-Dade County are estimated to provide about $306,000 in savings due to reduced air conditioning and heating use in residential buildings. However, by shading homes during the winter, trees increased heating use by about $32,000 dollars annually. Table 3 provides a breakdown of the air conditioning and heating use and price savings as well as heat emissions costs by residential trees.
Energy required to cool residences can be reduced by using trees to provide shade and evapo-transpirational cooling (McPherson and Simpson 1999). Trees near a building, for example, can create a cooler microclimate in the immediate area because of evapo-transpiration (evaporation of water from plant surfaces; as the water enters the air, the temperature is reduced). A properly located tree can also block solar radiation to a building and reduce the temperature inside. So the placement of trees around a building can influence the amount of energy required to maintain acceptable temperatures inside the building. Trees planted on the west side block the increase of solar heat in the afternoon during summer, for example. Following the "right place for the right tree" rule will allow the sun's heat to reach a structure in winter (deciduous trees, which lose their leaves in the fall, are planted on the south and east sides of the structure). Ultimately it is the occupants of a residence who determine how cool or warm they prefer the inside of the structure to be so tree energy use effects may vary from person to person. Increased urban tree cover can also reduce the "urban heat island" effect (Nowak et al. 2002).
As mentioned earlier, by indirectly influencing energy production in power plants, trees can also reduce emissions of carbon dioxide (CO2) and other greenhouse gases. This offset of avoided emissions can result in economic benefits to the community (McPherson and Simpson 1999). Using the August 2008 average price of CO2 of $4 per ton of CO2 emissions avoided (price determined by 2008 carbon markets; more recent prices available at: http://www.forest-trends.org/documents/files/doc_2828.pdf), the effect of trees on building energy use can result in $13,770 in benefits and $3,377 in costs; a benefit-cost ratio of 4:1. Table 4 provides a breakdown of the energy savings benefits due to Miami-Dade's urban forests in terms of carbon dioxide emissions avoided.
To summarize, homeowners and communities should plant the right trees in the right places to maximize cooling benefits in the summer and solar heat gain in the winter. Of course, energy savings are also affected by the occupants' use of the air conditioning and heating systems, as well as the efficiency of buildings and of heating and cooling units.
Recommendations for Maximizing Tree Benefits and Minimizing Costs
Urban development, climate, soils, and human preferences in Miami-Dade will ultimately determine the structure and composition of its urban forest. Managers making tree selections and setting long-term management objectives must consider the multiple ecosystem services trees provide, such as CO2 sequestration, air pollution removal, reduced energy use, and other services not calculated in this publication, such as recreation, increased property values, and reduced stormwater runoff (Escobedo et al. 2010a). However, these benefits need to be considered alongside several costs associated with trees, such as allergenic effects on human health, post-hurricane debris removal costs, and maintenance costs (e.g., planting, pruning, fertilizing, and watering) (Escobedo and Seitz 2009).
Many non-native trees are fast-growing and thus appealing, but these species can be high-maintenance as well. Some species should be avoided because of their potential invasive traits and negative ecological effects to natural ecosystems and agricultural areas near cities (Zhao et al. 2010). Although CO2 offsetting, reduced energy use, and pollution control receive more public and political attention, many other ecosystem services, such as the mitigation of hurricane damage, addressing needs of underserved communities, preservation of wildlife habitat, and beautification of communities can be just as relevant to decision makers and the community (Escobedo et al. 2010a; Flock et al. 2011).
Table 5 illustrates the importance of understanding the multiple ecosystem services provided by the most common trees in the county. Live oaks, for example, are more important to tree canopy because of their greater leaf area than are palms, but live oaks are also one of the largest VOC emitters per tree, so the air pollution reduction benefit of this species ranks lower than that for other species such as red and black mangrove and white stopper. Of particular importance in Miami-Dade County is trees' resistance to hurricane-force winds; species selection and design should be considered when managing for urban forest structure and benefits (Duryea et al. 2007). Although certain species such as melaleuca and Brazilian pepper currently provide greater CO2 sequestration and air pollution removal than other species because of their numbers and rapid growth rates, they are invasive exotic species. In other words, the advantages and disadvantages of each tree need to be considered when developing long-term urban forest management goals (Escobedo and Seitz 2009).
Selecting a tree species without considering its long-term effects and relevance to management goals will minimize the overall benefits of the tree selection to the community. For example, natural wetlands, pine rocklands, and oak hammocks within the urbanized portions of the county are experiencing greater environmental damage as a result of invasive plants that originate from adjacent urban landscapes (e.g., residential areas, commercial areas). Table 6 presents some common invasive trees found in urban portions of Miami-Dade County during a recent study (Zhao et al. 2010).
While Miami-Dade County should continue to plant trees, a long-term urban forest management plan that helps preserve existing trees—as well as a resilient, equitable, and effective urban forest structure—is very important (Nowak et al. 2002; Duryea et al. 2007; Escobedo and Seitz 2009; Escobedo et al. 2010a; Hostetler and Escobedo 2010; Flock et al. 2011). Care should be taken in selecting species in any tree planting program. While increasing tree cover will ultimately lead to an increase in environmental benefits to the community, some species and urban forest structure characteristics might also have less favorable effects, particularly in sensitive areas. An urban forest management plan should recommend planting trees in sites where urban forest structure is most needed, such as underserved neighborhoods, transportation corridors, and industrial sites. Urban forest managers must plan for impacts of climate and changing municipal budgets (i.e., future hurricanes and sea level rise; https://edis.ifas.ufl.edu/fr176). Although overall tree cover in an urban area is an important indicator of urban forest health and efficacy, the number and size, composition, condition, and location of individual tree and groups of trees and associated vegetation are just as important. Planning that accounts for the needs and desires of the community and its urban forest, which is to say all the trees, public and private alike, including individual trees as well as groups of trees, forested wetlands and conservation areas, and all associated vegetation (palms, shrubs, grass), will provide for maximum benefits and the long-term sustainability of this resource.
Literature Cited
Chicago Climate Exchange. 2008. "Market overview." Chicago Climate Exchange. http://www.chicagoclimatex.com/ (August 2008).
Duryea, M. L., E. Kampf, R. C. Littell, and C. D. Rodriguez-Pedraza. 2007. "Hurricanes and the urban forest: II. Effects on tropical and subtropical tree species." Arboriculture and Urban Forestry 33: 98–112.
Energy Information Administration (EIA). 2007. "Average retail price of electricity to ultimate customers by end-use sector, by state, April 2008 and 2007." Energy Information Administration. http://www.eia.gov/cneaf/electricity/epm/table5_6_a.html (August 2008).
Escobedo, F., S. Varela, M. Zhao, J. Wagner, and W. Zipperer. 2010a. "Analyzing the efficacy of subtropical urban forests in offsetting carbon emissions from cities." Environmental Science and Policy, 13: 362–372.
Escobedo, F., S. Varela, C. Staudhammer, and B. Thompson. 2010b. Southern Escambia County Florida's urban forests. FOR 231. Gainesville: University of Florida Institute of Food and Agricultural Sciences. https://edis.ifas.ufl.edu/fr293
Escobedo, F., and J. Seitz. 2009. The costs of managing an urban forest. FOR 217. Gainesville: University of Florida Institute of Food and Agricultural Sciences. https://edis.ifas.ufl.edu/publication/fr279
Flock, J., F. Escobedo, S. Varela, J. Wade, and C. Wald. 2011. "The environmental justice implications of urban tree cover in Miami-Dade County." Environmental Justice 4: 125-134.
Hefty, N., V. Gandi, D. Griner, R. Baker, and H. P. Wong. 2007. "Miami-Dade County's Global Climate Change - Urban CO2 Reduction Plan." http://www.miamidade.gov/environment/co2-reduction.asp (February 25, 2021).
Hostetler, M., and F. Escobedo. 2010. What types of urban greenspace are better for carbon dioxide sequestration? WEC 279. Gainesville: University of Florida Institute of Food and Agricultural Sciences. https://edis.ifas.ufl.edu/uw324
McPherson, E. G., and J. R. Simpson. 1999. Carbon dioxide reduction through urban forestry: Guidelines for professional and volunteer tree planters. Gen. Tech. Rep. PSW-171. Albany, CA: U.S. Department of Agriculture, Forest Service, Pacific Southwest Research Station.
Nowak, D. J., and D. E. Crane. 2002. "Carbon storage and sequestration by urban trees in the United States. Environmental Pollution." 116(3): 381–389.
Nowak, D. J., D. E. Crane, J. C. Stevens, and M. Ibarra. 2002. Brooklyn's Urban Forest. Gen. Tech. Rep. NE-290. Newtown Square, PA: US Department of Agriculture, Forest Service, Northeastern Research Station.
Zhao, M., F. Escobedo, and C. Staudhammer. 2010. "Spatial patterns of a subtropical, coastal urban forest: Implications for land tenure, hurricanes, and invasives." Urban Forestry and Urban Greening. 9: 205–214.
Comparison of estimated average carbon stored, CO2 sequestered, and air pollution removed per average tree in one year by diameter at breast height (DBH) size classes in Miami-Dade County, Florida.
Net carbon and carbon dioxide sequestrated per land use area and its economic value in Miami-Dade County's urban forest.
The benefits and costs based on energy use effects due to tree shading, windbreak, and climate effects near residential buildings in Miami-Dade, Florida.
Determining the amount carbon dioxide emissions are reduced each year due to shading of residential buildings by trees in Miami-Dade County, Florida. Note: MWh is megawatt hours; equivalent to 1000 KWhs (kilowatt hours).