This document is intended to provide guidance to Extension professionals, as well as persons in community organizations, who conduct surveys for program planning, improvement, and evaluation.
Introduction
Conducting a survey in Extension is often performed to identify community issues or to develop or improve a program. Surveys also are frequently used to assess the performance of a program by measuring how well it is delivered, as well as its outcomes or impacts. The questions that you ask will determine the data that is collected, which will in turn impact what you can interpret from respondents' answers. Asking closed-ended questions, which have specific answers the respondents can give, or open-ended questions, which allow the respondents to fill in the answer with any wording they want, will impact the results that you obtain. If you want to know how much behaviors, knowledge, or attitudes have changed after participants attend a program, then you will probably ask a closed-ended question. If you want to know why a client made a change, then you may want to include open-ended questions. If you want to conduct a needs assessment or program improvement, then you may ask an open-ended question or have a closed-ended question that uses a rating scale of the issues. This publication will briefly look at how the intent of a survey affects which types of questions should be asked and how the data can be analyzed to help address this intent.
Types of Closed-Ended Questions and the Types of Information That They Can Provide
As outlined in the Savvy Survey series publication #6c, there are four types of closed-ended questions: unordered, ordered, scale/Likert, and partially closed. This section will discuss how closed-ended questions influence what type of data analysis you can do and how you can use this information in your programming cycle. For more in-depth instruction on data analysis/statistics, see Savvy Survey series publication #16 (https://edis.ifas.ufl.edu/pd080).
Questions with Unordered Responses
Questions with unordered responses are often used to ask the participants about knowledge, type of behavior, or information about themselves. These questions produce nominal data—that is, the answers are categories, and though you might assign numbers to the answers, the numbers are for calculation purposes, and the answer has no quantitative value or order to it (e.g., the county where a person lives or the type of grass in the landscape). These might also be questions that have only two response options, such as true/false and yes/no questions. The information from these questions tells you about your participants' classification on demographics, attitudes and knowledge, and practices.
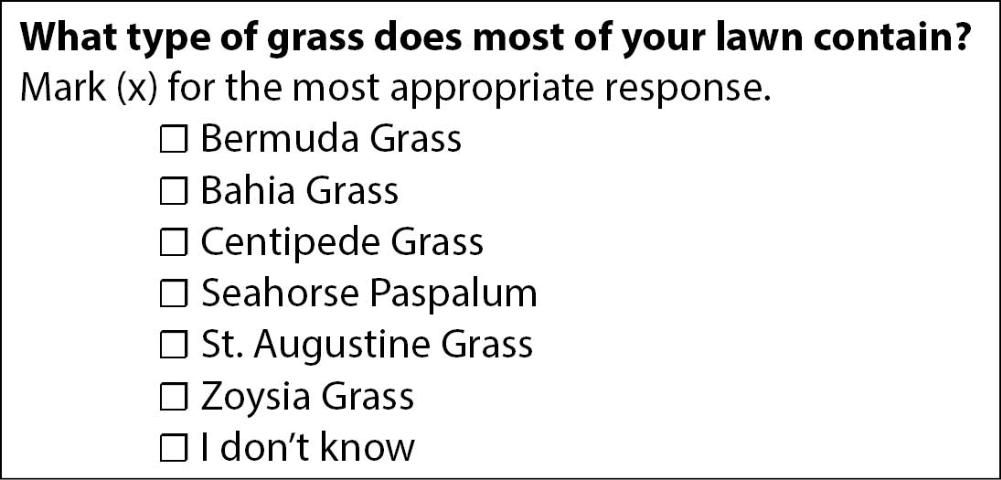
You can use this information to better understand your participants or clientele. This information also could be used to improve a program, to create a plan to focus on areas where that information is needed, or in a needs assessment to plan for future programming. This type of data can also be used to find out if you are reaching a wide range of participants (based on their demographic information or other characteristics). You could then use marketing to appeal to the audiences you want to attend your programs. Let's look at an example of an unordered question from Savvy Survey series publication #6c in Figure 1.

You can find out two pieces of information from the question in Figure 1: whether your participants are knowledgeable about their grass and what type of grass they have. You can then decide if you need to include a class teaching about types of grasses and which grasses are appropriate for the area they live in. You could also decide to focus your program more on certain types of grasses because they are what most of the participants have.
With questions that have unordered responses, the data analysis will usually generate counts and percentages for each response category. For the question above, you could find out how many times each category was selected, the distribution of answers, and which answer was selected most often (i.e., the modal category). For example, we might discover that 85% of homeowners in a given Homeowners Association (HOA) have St. Augustine grass, 12% have centipede, and 3% have Bahia. Consequently, an Extension agent would likely focus program activities on management of St. Augustine grass.
Ordered and Likert-Type Questions
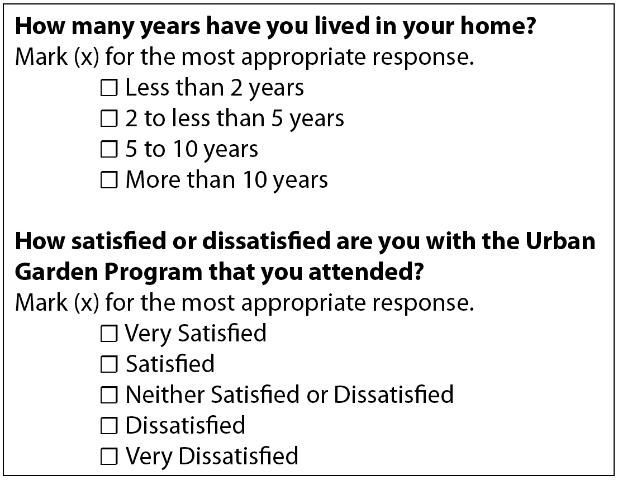
Ordered questions also can be used to ask the participant questions about knowledge, demographic information (such as categories of age or years living in their community), behaviors, and attitudes. These questions usually produce ordinal data, although with a larger number of ordered response categories (i.e., 5 or more), the data can be treated as interval data (Willits et al., 2016). The answers are given using a scale to depict the order, but there is not necessarily an equal difference between each category. Examples of this include asking questions with a bipolar agree/disagree scale (i.e., a Likert-type scale), rating questions, questions with interval scales but putting them into ranges (e.g., 80–90 degrees or 18–24 years). These questions can help you gain knowledge about participants with regard to their likes, satisfaction, behavioral changes, information learned, demographics, and so on. Sometimes, a set (or matrix) of questions is designed to measure knowledge or an attitude, and these can be combined into an index, as explained in Savvy Survey series publication #6d (https://edis.ifas.ufl.edu/pd069). Let's look at two examples of questions with ordered responses from Savvy Survey series publication #6c (https://edis.ifas.ufl.edu/pd068) in Figure 2.

The first question in Figure 2 will collect data on a demographic attribute of your participants. You will be able to use this data to decide future programming needs or to tailor your program more toward either newer or older homeowners. The second question will let you know how a person rates their satisfaction. Likert-type scales are used most often to measure attitudes and usually have several items for each type of construct (this is a best practice). With data from these types of questions, you can decide if you need to change your programming to improve satisfaction. However, you will not know why the participants are dissatisfied, so you will need to ask a follow-up question.
Types of data analysis for these questions include frequency counts and percentages, measures of central tendency (e.g., mean, median, mode), measures of dispersion (e.g., standard deviation and interquartile range), and more advanced inferential statistics. For the questions above, you would be able to calculate the average/mean of satisfaction to know if overall participants are satisfied with your program. For example, we might find that the mean for satisfaction with the urban garden program is 4.5, or satisfied, but the mean for satisfaction with the Florida-Friendly Landscaping™ program is 1.5, or dissatisfied. An Extension agent will know to look for differences in how each program was presented that could lead to ways to improve an underperforming program. You can also infer if these results are likely to occur in other similar populations.
Partial Closed-Ended Questions
Some closed-ended questions include an open-ended answer category (e.g., "Other" with a space for the respondent to add a specific answer). These questions can provide the same information as the other types of questions, but they may give a more precise understanding of your participants. These questions enable you to complete a basic analysis of frequency counts and percentage distributions. Also, as discussed in the next section, it is important to realize that the amount of room for participants' responses will impact the amount they write and what type of analysis must be completed.
Types of Open-Ended Questions and the Types of Information That They Can Provide
Open-ended questions make it possible to get a more detailed and deeper understanding of your participants and what they are thinking, what they have learned, their behavioral practices, or their attitudes. You can look at some open-ended questions quantitatively if the responses are kept to only a few words. Figure 3 shows examples of open-ended questions that you can look at quantitatively.

With both types of questions, you want to use good visual design to encourage respondents to limit the amount that is typed or written. You will first need to code the answers (see Savvy Survey series publication #15 at https://edis.ifas.ufl.edu/pd079), and then you can analyze the data with frequency counts and percentages. These questions can provide you with basic information about the participants and can show areas that may need to be covered in future programs or how a current program should be changed to fit the population.
Another type of open-ended question asks for a numerical answer, as illustrated in Figure 4.

These questions can provide you data on participants' demographic attributes, how many times a behavior occurs, or how many times a participant thinks about something. These questions can give you the exact numbers from participants so you can get more precise data than with a closed-ended question. These types of questions can be coded as interval-level data, and you can use most statistical analyses, such as mean, standard deviation, and many other inferential statistics. You may need to do a lot of cleaning of the data (making sure what is written is able to be entered as a numerical code in the data file) before it can be analyzed.
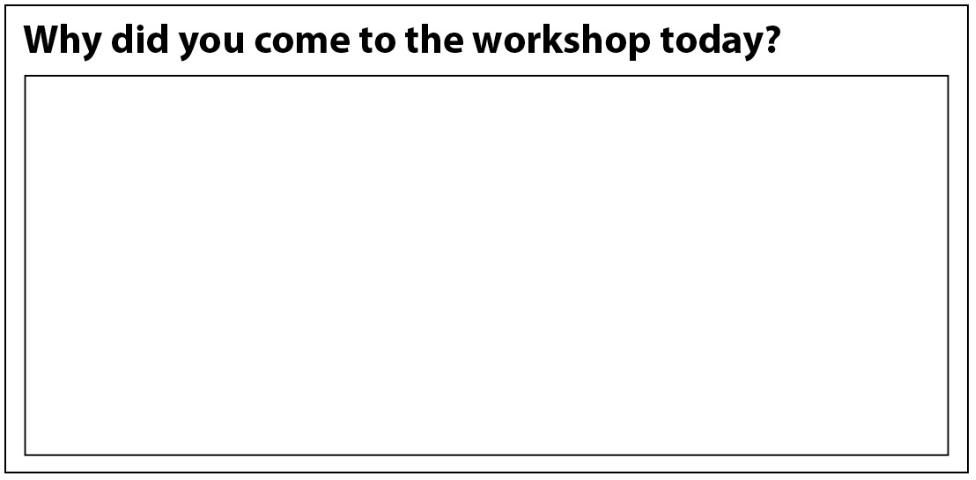
The last type of open-ended question allows respondents to write a few sentences or several paragraphs. These types of questions can provide valuable data that may not be collected by any other means. However, analyzing these data will require specific tools and procedures (and can be very time-consuming). This analysis might use very detailed codes and thus can require a lot of cleaning to use the data. An example of this is shown in Figure 5.

This question can give you a lot of information about your participants. They might provide information about what they do, where they live, why they do something, or what marketing messages were engaging and brought them into a program. Participants might also talk about topics that are important to them but were not covered in the workshop. You can then either add those topics to this program or direct them to an existing program that provides this information. With these longer response questions, you may get information that you did not even know you wanted, because the respondent answers in a way that provides a novel way of thinking about something. These questions can provide detail and add to your understanding of your participants, but the data will need to be analyzed using qualitative methods. This includes looking at content and themes that emerge from the responses (see Marks & Yardley, 2004). This data analysis will be covered in more depth in later publications.
Conclusion
When creating a survey, it is important to think about what kind of data you want and what kind of questions you will use so that you can select or construct the correct types of questions. In using closed-ended questions, you can conduct various quantitative analyses that can provide information about your participants, in addition to areas that are being covered well or that need improvement in a program. When data is collected from a large and representative group of people, then you can also generalize to similar populations. In open-ended questions, you can get a more detailed response to similar questions, or you can ask, for example, why someone is doing something. The questions you choose impact the data that can be extracted and how you can interpret that data.
References
Marks, D. F., & Yardley, L. (2004). Content and thematic analysis. In D. F. Marks & L. Yardley (Eds.), Research methods for clinical and health psychology (pp. 56–68). Sage.
Willits, F., Theodori, G., & Luloff, A. 2016. Another look at Likert scales. Journal of Rural Social Sciences 31(3), Article 6. https://egrove.olemiss.edu/jrss/vol31/iss3/6