Introduction
Automatic landscape irrigation systems have become common in Florida in recent years. Electronic irrigation timers (controllers) are often used to control these irrigation systems; however, it is not always obvious how to program these timers to apply the desired amount of irrigation water. Newer technologies such as smart irrigation timers also must be programmed properly to ensure efficient irrigation (https://edis.ifas.ufl.edu/collections/series_smart_irrigation_controllers). The purpose of this publication is to familiarize irrigation managers, contractors, Extension agents, homeowners, and other interested persons with programming guidelines for an irrigation timer in Florida.
Irrigation Timers
In general, commercially available timers are mechanical, electromechanical, electronic, computer based (Zazueta et al. 2008), or, more recently, cloud based. Regardless of the type of timer, all of them have at least some basic settings in common: the current day of the week and time, day(s) of the week when irrigation will be allowed, the time when the irrigation will start, different irrigation zones (or stations) that will be watered consecutively (one at a time), and the watering time per zone. Details and additional features are discussed below.
Electronic timers are commonly installed in residential and small commercial landscape irrigation systems. We will discuss the general operation common to most residential irrigation timers. For details specific to a given controller, the reader should refer to the owner's manual.
Electronic Timer Operation
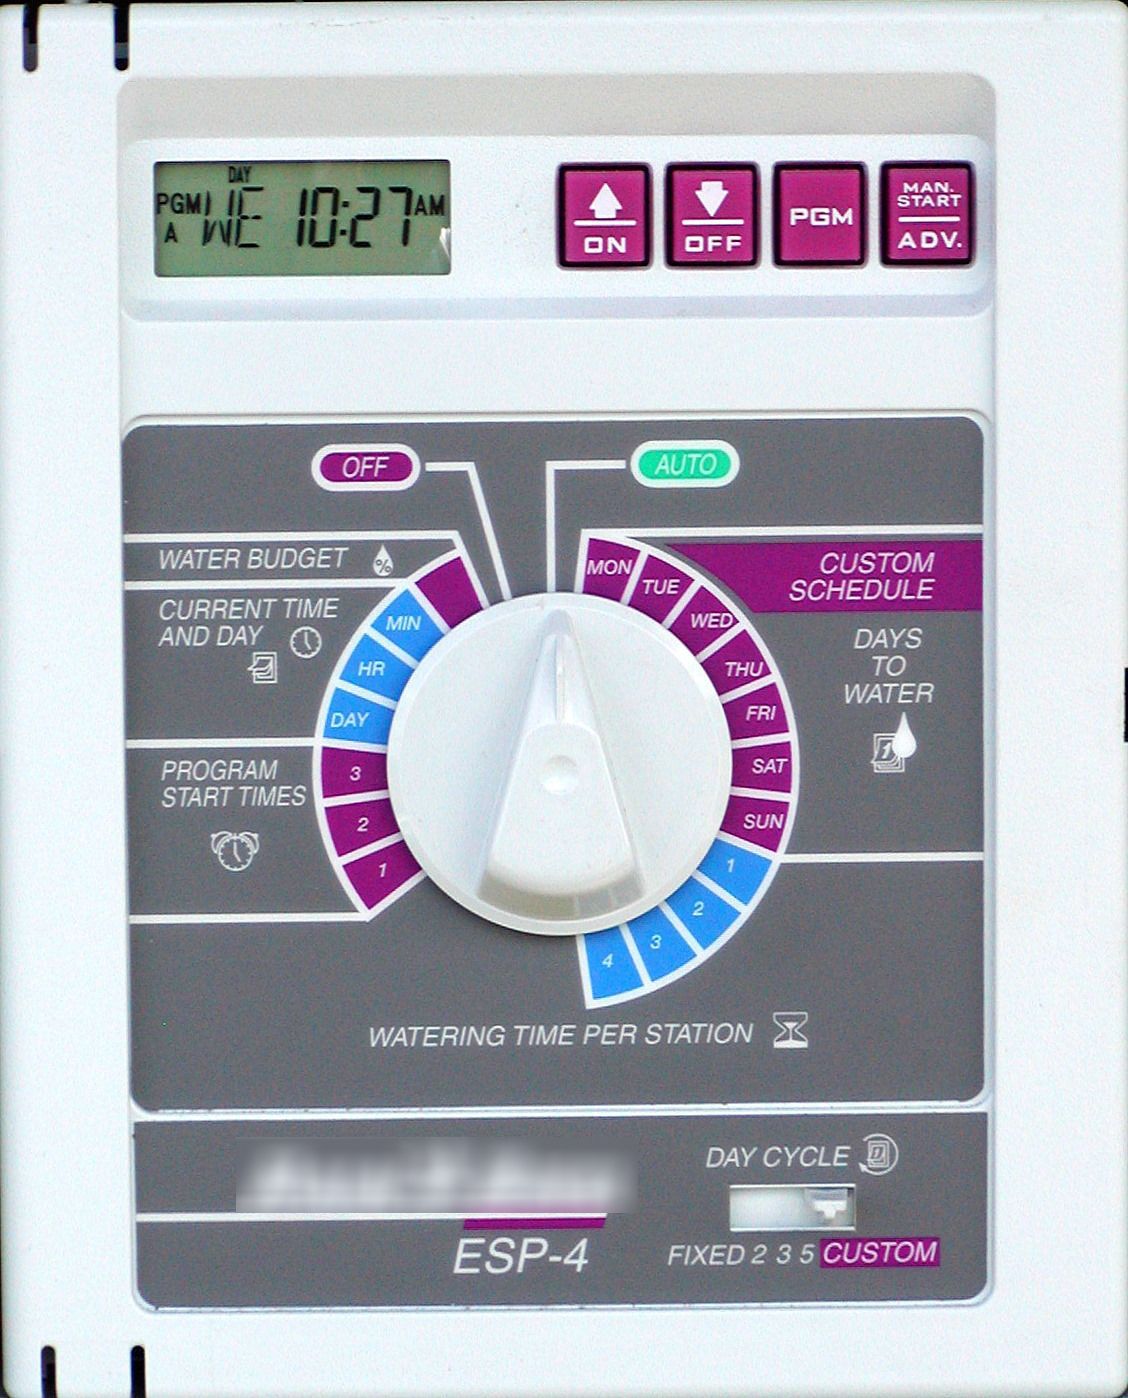
Generally, electronic timers allow flexible scheduling of irrigation systems (Figure 1).
Credit: Bernard Cardenas, UF/IFAS
Some scheduling options provided by timers are listed below.
Days of the Week
Timers may be set for irrigation every day, every second day, every third day, etc. Typical timers will allow for selection of certain days of the week in a "custom" option or frequency, such as "every Monday," for setting frequency of irrigation. The "custom" option is the one normally used during times of water restrictions, when irrigation is limited to one or two days each week. Always follow local water restrictions when programming a timer.
Run Time
The amount of time that each zone runs may be set from several minutes to several hours. Generally, run time should be less than 60 minutes for Florida's sandy soils. The exact time depends on the system application rate, which can be determined as discussed in the next section. Irrigating longer will lead to movement of water below the root zone, which wastes water.
Percentage Adjustment
Most timers have percentage settings so that the relative run time may be adjusted. For example, if the controller is set to run 60 minutes per cycle, the controller may be set to water at 75%. This will result in 60 minutes × 0.75 = 45 minutes of run time. Likewise, the run times in the other zones will be reduced to 75% of the current zone time setting. This is helpful in Florida when winter begins and the turfgrass is dormant or not actively growing, and irrigation can be cut back.
Program
Timers usually have the capacity to run multiple programs. For example, on program "A," the controller may be set to water six rotor zones for 60 minutes, twice each week. If new plants are planted in a landscape bed, they may need more frequent watering to become established. In this case, program "B" can be used to water that zone every day of the week, until established.
Application Rates
The application rate is the amount of water applied over an area (such as a yard with landscape plants and turfgrass) in a given amount of time. Usually, this is expressed as inches per hour (in/hr) and implies an even application of water. The application rate of an individual irrigation zone must be known to properly set the run time in the irrigation controller.
There are several ways to find the application rate of an irrigation zone. It may be:
- given by the designer or contractor,
- calculated from system and/or sprinkler specifications,
- calculated based on measurements of flow from a water meter, or
- measured directly by placing catch containers in the irrigated zone of interest.
Application Rate Given by the Designer or Contractor
Although application rates of each individual zone should be calculated by the designer, in practice this is rare.
Application Rate Calculated from System or Sprinkler Specifications
Application rate may be calculated from the system specifications according to the total area method (Equation 1) or from the sprinkler specifications (assuming they are all alike) according to the sprinkler spacing method (Equation 2). Actual application rates may not match calculated rates due to misadjusted sprinklers, wind drift, pressure problems, etc. For these reasons, it is preferred that the actual application rate be verified by measurement as described in the next two sections.
Total Area Method

Credit:
where:
AR = application rate (in/hr)
GPM = system or zone flow rate (gpm)
Area = total or zone irrigated area (ft2)
Sprinkler Spacing Method

Credit:
where:
AR = application rate (in/hr)
GPM = individual nozzle flow rate (gpm)
Row = spacing of sprinkler rows (ft)
Col = spacing of sprinklers within the rows (ft)
Application Rate Calculated Based on Measurements of Flow from a Water Meter
The quickest and simplest method to measure the actual application rate for each irrigation zone can be determined by running a zone for a specific amount of time, and measuring the area that is irrigated (see example below). If a separate irrigation meter is not installed (which is typical on most homes), the utility meter should be employed, but only when water is not being used in the home. If a separate irrigation meter is available, household water use will not affect the calculations. If a well is used to supply the irrigation system, then a meter must be installed after the pump to use this method.
Example
The meter reading before irrigating a single zone was 1000 gallons and the meter reading after irrigating was 1080 gallons. The amount of water used during the irrigation cycle was 1080 – 1000 = 80 gallons. The irrigation time for the zone was 2 minutes. The irrigated area is approximately square and approximately 2000 ft2. Now the average application rate for the irrigated zone can be calculated by Equation 3.

Credit:
where:
AR = application rate (in/hr)
Gal = total volume of water measured by the flow meter (gal)
Area = irrigated area (ft2)
Time = total time that irrigation was run (min)
Then, according to Equation 3:

Credit:
the application rate for that zone is 1.9 in/hr.
Note: Running a zone for two minutes is a reasonable amount of time to measure its application rate in a residential property.
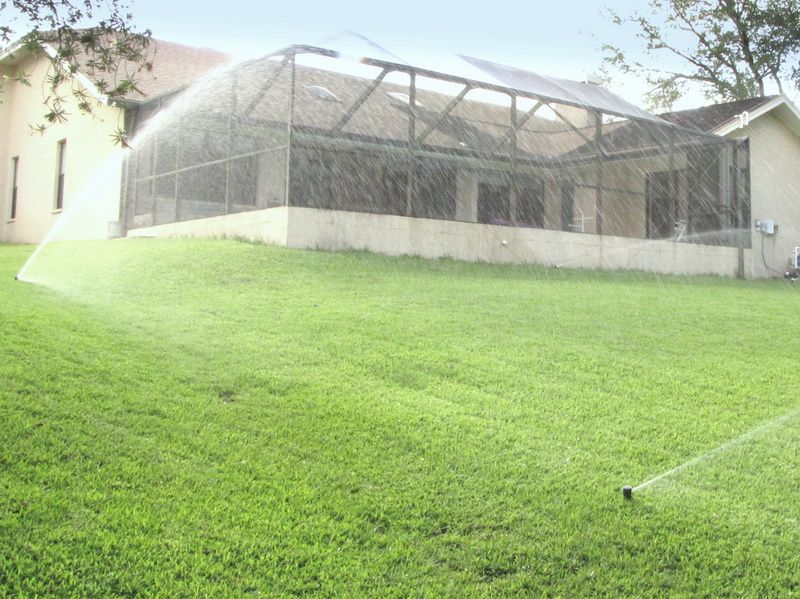
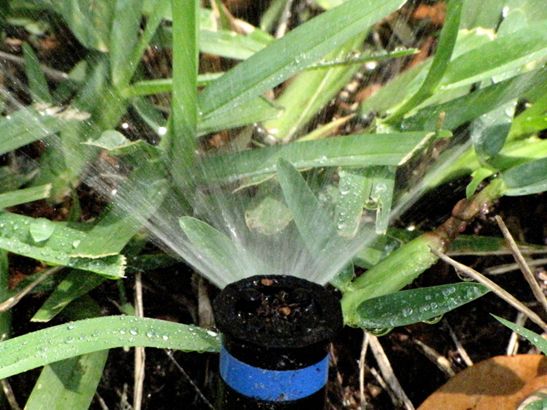
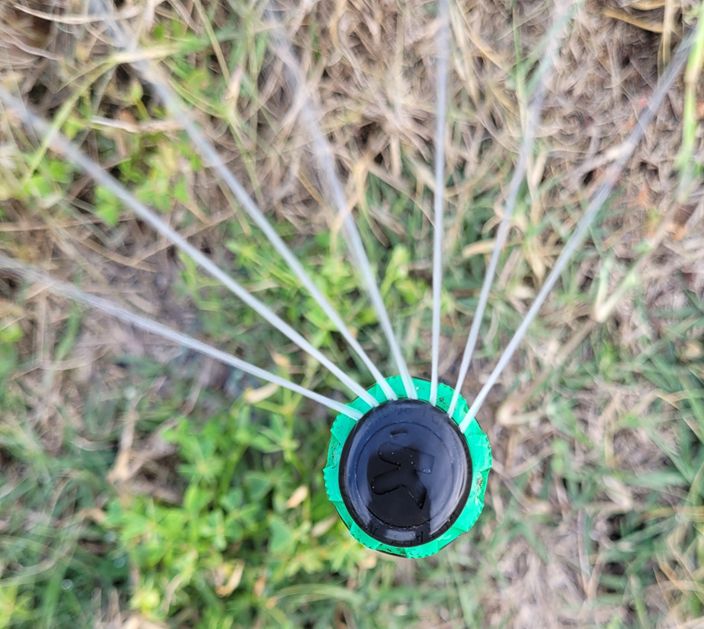
This method is relatively easy, but unless it is performed for each zone, it will not give the accurate representation of individual zones needed to set the timer. For example, rotors (Figure 2) typically have application rates of 0.25–1.0 in/hr. Traditional or standard heads with fixed spray nozzles (Figure 3) have application rates of 0.75–2.0 in/hr. Meanwhile, standard heads with high-efficiency rotary nozzles (Figure 4) have application rates of 0.4–0.6 in/hr. Due to these wide-ranging application rates, each zone must be measured separately.
Credit: Bernard Cardenas, UF/IFAS
Credit: Bernard Cardenas, UF/IFAS
Credit: Bernard Cardenas, UF/IFAS
Application Rate Measured Directly Using Catch Containers
Application rate can be measured directly by placing several containers in a given irrigation zone during an irrigation event (Trenholm et al. 2009). This is similar to evaluating the system uniformity (Smajstrla et al. 2005). The containers must be the same shape and size. Old coffee or tuna cans are examples of good containers for this purpose. The rim of the can should be above the turf and the cans should be level. At least six cans per zone should be used; they should be distributed randomly, at least one foot away from the sprinklers. Next, run the irrigation system over a normal cycle. Then, Equation 4 is used to calculate the application rate according to the following example.
Example
One irrigation zone is to be tested. Several catch cans are positioned throughout the zone such that overlap from other zones does not contribute to those cans. The average depth of water measured in the cans was 1.25 inches after an irrigation run of 45 minutes.

Credit:
where:
AR = application rate (in/hr)
Depth = average depth of the collected water in the catch cans for any one zone (in)
Time = run time of irrigation zone tested (min)
Then, according to Equation 4:

Credit:
the application rate for that zone is 1.67 in/hr.
Setting the Watering Time of an Irrigation Zone
Once the application rate of a zone is known, then the irrigation watering time can be set for a desired irrigation depth according to Equation 5, with the application rate calculated from Equation 4.

Credit:
where:
Time = run time to be programmed into controller (min)
Depth = desired application depth (in)
AR = application rate of that zone (in/hr)
Table 1 gives the calculated times according to Equation 5 based on desired application amount or depth and the application rate of the individual zone or system.
Table 1. Irrigation zone run time (min) for a given application rate and a desired application depth.
Seasonal Setting of Irrigation Timers
The objective of irrigation is to replenish the water in the plant roots to avoid excessive plant stress. For landscape plants, especially turf, where the objective is to maintain the appearance and not to produce the highest amount of biomass, it is usually sufficient to aim for 60% to 100% replacement of water in the root zone.
Augustin (2000) calculated the net irrigation requirement of turfgrass for several geographical areas based on effective rainfall. Effective rainfall takes into account the low water-holding capacity of Florida's soils (Trenholm et al. 2013; Zazueta et al. 2021). Net irrigation requirement is the amount of irrigation water that must be delivered to the crop. This does not consider irrigation losses such as pipeline leakage, wind drift, non-uniform application, etc.
Tables 2–9 present a suggested irrigation controller time setting assuming two irrigation events per week, and an irrigation system efficiency of 60% for application rates of 0.25 in/hr, 0.50 in/hr, 0.75 in/hr, 1.00 in/hr, 1.25 in/hr, 1.50 in/hr, 1.75 in/hr, and 2.00 in/hr, respectively. Three regions are represented in Tables 2–9: north (Gainesville), central (Orlando), and south (Miami). In addition, three levels of replacement are presented. It is desirable to irrigate at the lowest possible level of replacement without causing an unacceptable decline in turf or landscape quality. Two irrigation events per week were assumed, since this is a common practice due to watering restrictions. Any irrigation time exceeding 60 minutes may result in water leaching below the root zone and should be split into two applications at least four hours apart (i.e., morning and evening) to allow plants to use part of the already-applied water. If the measured or calculated application rate does not exactly correspond to those given in the table, use the closest rate. For example, if a homeowner measures an application rate of 0.6 in/hr, the table with the 0.5 in/hr application rate (Table 3) should be used.
Setting Microirrigation Zones
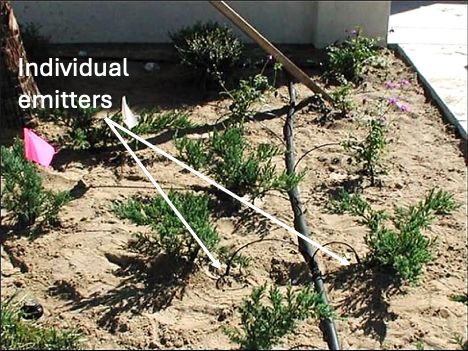
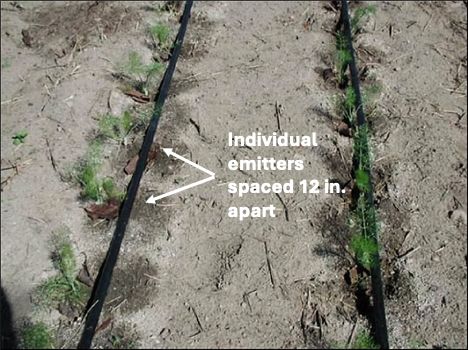
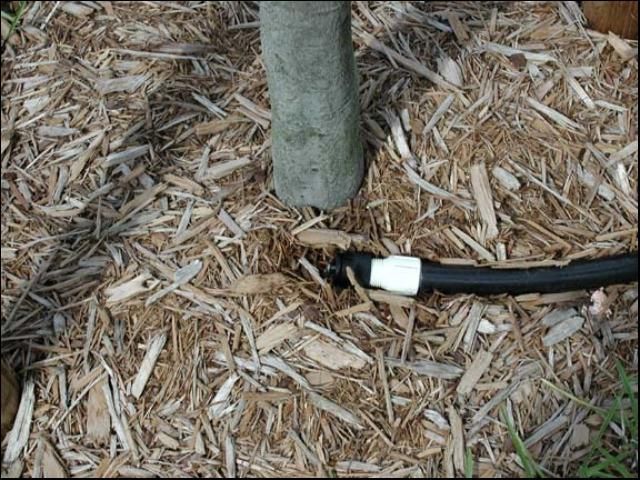
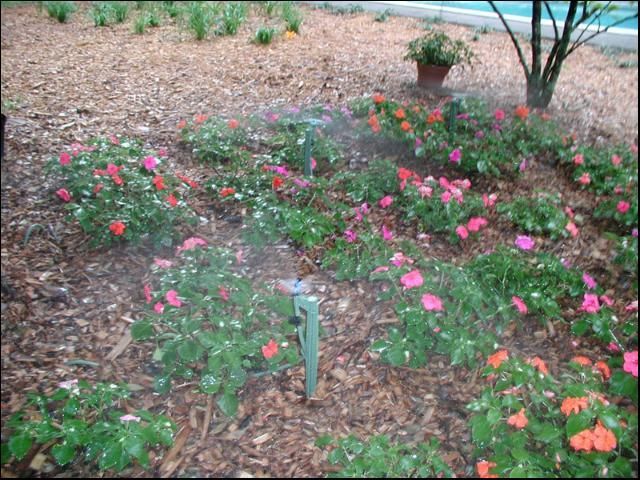
Microirrigation zones, sometimes called "drip" irrigation, are becoming popular for landscape beds due to their ease of use and low use of water. There are several types of microirrigation emitters (Figures 5, 6, 7, and 8). More information on those emitters and how they are defined can be found in "Retrofitting a Traditional In-Ground Sprinkler Irrigation System for Microirrigation of Landscape Plants" (Haman et al. 2002). Typically, microirrigation does not wet the entire root zone; therefore, the application rate concept does not apply. These emitters have various emission rates, usually in gallons per hour. General guidelines on how many gallons are required for landscape plants can be found in "Fertilization and Irrigation Needs for Florida Lawns and Landscapes" (Klein et al. 2023). Once the gallons required are known, then the irrigation controller may be set according to Equation 6, assuming one emitter per plant. Application depth may be difficult to calculate if information on gallons of irrigation is not known for a particular plant type. In this case, microirrigation zones should be set initially for a one-hour run time, two times each week. These zones can be reduced 15 minutes each cycle every week until plants show stress.

Credit:
where:
Time = microirrigation run time (min)
Gal = volume of irrigation water required for a plant (gal)
GPH = emission rate of a drip emitter (gph)
Credit: Dorota Haman, UF/IFAS
Credit: Dorota Haman, UF/IFAS
Credit: Dorota Haman, UF/IFAS
Credit: Dorota Haman, UF/IFAS
References
Augustin, B. J. 2000. “Water Requirements of Florida Turfgrasses.” BUL200. EDIS. http://ufdc.ufl.edu/IR00005565/00001
Haman, D. Z., M. D. Dukes, and S. G. Park-Brown. 2002. “Retrofitting a Traditional In-Ground Irrigation Sprinkler System for Microirrigation: ABE324/AE222, 10/2002.” EDIS 2002 (6). https://doi.org/10.32473/edis-ae222-2002
Klein, R., A. J. Lindsey, M. McMillan, J. B. Unruh, and M. D. Dukes. 2023. “Fertilization and Irrigation Needs for Florida Lawns and Landscapes: ENH860/EP110, rev. 7/2023.” EDIS 2023 (4). https://edis.ifas.ufl.edu/publication/EP110
Smajstrla, A. G., F. S. Zazueta, and D. Z. Haman. 2005. “Lawn Sprinkler Selection and Layout for Uniform Water Application.” BUL320. EDIS. http://ufdc.ufl.edu/IR00004381/00001
Trenholm, L. E., J. B. Unruh, and J. L. Cisar. 2009. “How to Calibrate Your Sprinkler System.” ENH61. EDIS. http://ufdc.ufl.edu/IR00003389/00001
Trenholm, L. E., J. B. Unruh, and J. L. Cisar. 2013. “Watering Your Florida Lawn: ENH9/LH025, 4/2013.” EDIS 2013 (6). https://doi.org/10.32473/edis-lh025-2013
Zazueta, F. S., A. G. Smajstrla, and G. A. Clark. 2008. “Irrigation System Controllers.” SSAGE22. EDIS. https://ufdc.ufl.edu/IR00001497/00001
Zazueta, F. S., A. Brockway, L. Landrum, and B. McCarty. 2021. “Turf Irrigation for the Home: CIR829/AE144, 2/2014.” EDIS 2014 (2). https://edis.ifas.ufl.edu/publication/AE144
Abbreviations
in—inches
gal—gallons
hr—hour
gpm—gallons per minute
gph—gallons per hour
min—minutes
ft—feet
ft2—square feet
Table 2. Irrigation controller run time (min) for each of two irrigation events per week at an application rate of 0.25 in/hr, assuming system efficiency of 60%, and considering effective rainfall*.
Table 3. Irrigation controller run time (min) for each of two irrigation events per week at an application rate of 0.50 in/hr, assuming system efficiency of 60%, and considering effective rainfall*.
Table 4. Irrigation controller run time (min) for each of two irrigation events per week at an application rate of 0.75 in/hr, assuming system efficiency of 60%, and considering effective rainfall*.
Table 5. Irrigation controller run time (min) for each of two irrigation events per week at an application rate of 1.00 in/hr, assuming system efficiency of 60%, and considering effective rainfall*.
Table 6. Irrigation controller run time (min) for each of two irrigation events per week at an application rate of 1.25 in/hr, assuming system efficiency of 60%, and considering effective rainfall*.
Table 7. Irrigation controller run time (min) for each of two irrigation events per week at an application rate of 1.50 in/hr, assuming system efficiency of 60%, and considering effective rainfall*.
Table 8. Irrigation controller run time (min) for each of two irrigation events per week at an application rate of 1.75 in/hr, assuming system efficiency of 60%, and considering effective rainfall*.
Table 9. Irrigation controller run time (min) for each of two irrigation events per week at an application rate of 2.00 in/hr, assuming system efficiency of 60%, and considering effective rainfall*.