Introduction
This paper is the second part of the EDIS series "Economic Value of Florida Water Resources." The goal of the article is to discuss the contribution of water-based tourism to the economy in various Florida regions. A number of economic studies are summarized here, and readers can pick and choose the studies most relevant to their geographic area or their area of interest.
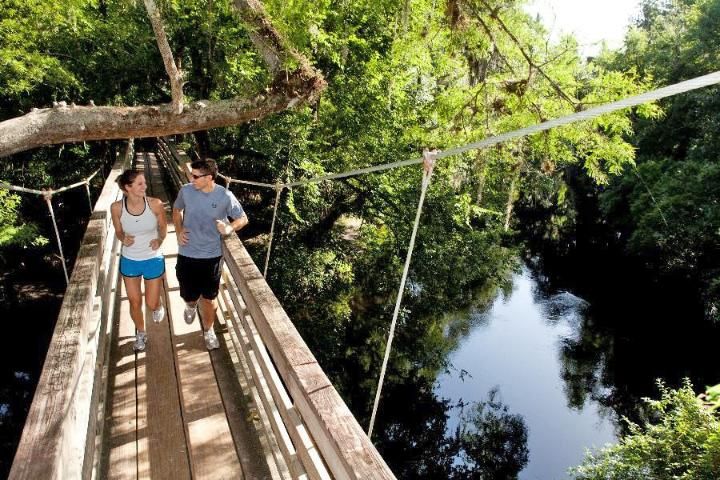
Our special focus is freshwater-based recreation, such as canoeing, freshwater angling, wildlife watching (Figure 1), lake- or river-shore hiking, spring diving, etc. Some studies reviewed here, however, integrate results for fresh and marine water resources.
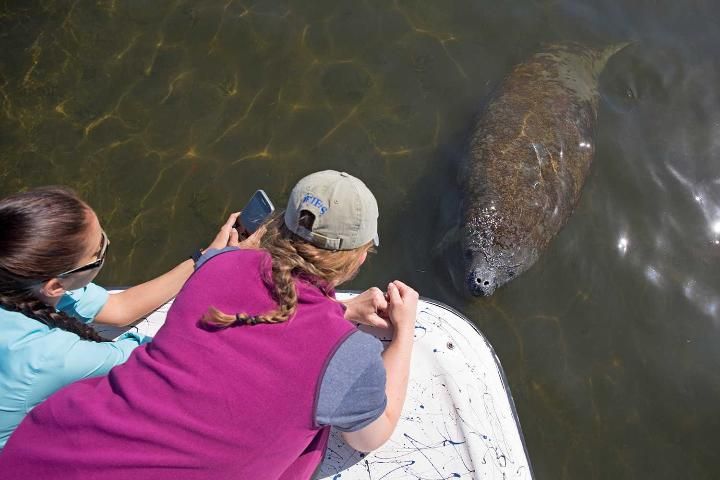
Credit: UF/IFAS
Recreation is only one of the benefits people receive from water resources. Water is essential for fisheries and aquaculture, for drinking and bathing, for sanitation, and for spiritual and symbolic purposes, among myriad other uses described in this series.
Methods Used in the Economic Impact Studies
To measure the economic contribution of tourism, economists estimate tourists' spending at recreational sites and then relate this information to various indicators of economic activities, such as the number of jobs supported, federal and local taxes generated, etc. Such studies are usually called "economic contribution" or "economic impact" analysis.
Economic impact studies consider only the prices we pay for goods and services, even when such prices do not capture the total value of the goods and services. The pleasure that we derive from a recreational trip can exceed the prices we pay to visit the site (e.g., entrance fee and gas expense); however, economic contribution studies do not reflect this "total pleasure," or total economic value. In other words, economic impact studies capture key indicators of economic activity (such as spending, employment, taxes, etc.). However, these studies may still undervalue the total benefits from recreation. Interested readers can check the third paper in this series for a review of Florida-based studies examining the value of recreation for visitors.
Mosaic of Terms: Indicators Used in the Economic Impact Studies
Various indicators can be used to measure the importance of tourism and recreation for the economy; often different studies report dissimilar indicators.
Value added is generally the most preferred indicator of the economic contribution or economic impact. Value added is an indicator similar to Gross Domestic Product, which is commonly used to assess the state of the national economy. The value added is the difference between the total industry output and the cost of these industries' inputs (such as supplies, labor, etc.). By subtracting the input cost, value added avoids double-counting of intermediate goods and services (such as spare parts that are used to produce other goods and services). The value added can also be expressed as a sum of employees' compensations, taxes on production and imports (minus subsidies, if any), and operating surplus.
However, some studies do not measure or report the value added and instead refer to indicators that are easier to estimate. Based on a variety of the economic impact studies (Mulkey and Hodges 2018; IMPLAN 2017; Stynes 2001; FDEP 2018; NPS undated), other commonly used indicators include:
- number of visitors: the number of people visiting a recreational site (with people staying overnight often counted every day they spend on the site, resulting in visitor-day statistics);
- total visitor spending: an estimated total of what the visitors spend for their recreational trip to the location of interest; total visitor spending includes spending by both visitors who live locally (local visitors) and visitors who travel to the parks from outside (non-local visitors).
- jobs supported by the visitors' spending: this is the measure of employment that can be attributed to the water-based recreational activities in the region; different studies account for either jobs in the directly affected industries or all industries, including those experiencing indirect and induced effects (e.g., industries where those employed at directly affected businesses spend their salaries, or as described below).
- industry output: this indicator is the total value of goods and services produced by industries related to the recreation; this is usually a large value because it double-counts some impacts by including the value of intermediate goods and services used to produce other goods and services.
- total direct economic impact: this indicator accounts for the expenditures by non-local visitors only, since local visitors would likely spend the money in the region even in the absence of the recreational site being examined; some studies also account for the spending for the site's management (such as state funding for state parks).
- indirect economic impact: this indicator is the increase in business-to-business activity as a result of the visitors' spending, such as the increase in businesses that supply goods and services to the recreation/tourism sectors.
- induced impact (or induced effect): this is the changes in local spending that result from income changes in the directly and indirectly affected industries. For example, money spent by tourists in a restaurant contributes to the salaries of the restaurant's employees that are in turn spent in local businesses not directly linked to the recreation.
- other indicators: studies can also report wages and salaries (i.e., earnings of employees), government tax revenues, and other indicators.
Economic contribution analysis can be performed using various input-output models, which are the models that represent the flow of goods and services among economic sectors within a region. Most commonly used models are IMPLAN (IMpact Analysis and PLANning; see IMPLAN Group, Inc. 2018); REMI (Regional Economic Models, Inc; see REMI 2018) or RIMS-II (Regional Input-Output Modeling System, see BEA undated). The results of the analysis may differ slightly depending on the model employed.
Another point to remember is that economic contribution indicators vary from year to year because the number of visitors changes in response to weather, economy, fashion, new amenities, etc. These dynamics are important to consider.
To learn more about economic impact analysis and to read about contributions to regional economies of various events and programs, one can check the website of the UF/IFAS Economic Impact Analysis Program at http://fred.ifas.ufl.edu/extension/economic-impact-analysis-program/.
Contributions of Tourism and Recreation to the Economy
Recreation in Florida State Parks
Many of Florida's state parks are organized around water sites (such as springs or rivers), and every year the Division of Recreation and Parks (a part of the Florida Department of Environmental Protection) examines the economic contribution of parks' visitation to the economy. Based on fiscal year (FY) 2018–2019 data, 29.4 million Florida residents and visitors enjoyed Florida's state parks and trails. The parks resulted in $2.6 billion in direct economic impact (i.e., total spending by non-local visitors and park operations), generating approximately $176 million in increased sales tax revenue. In addition, 37,119 full-time and part-time jobs were supported as a result of state park operations. These data imply that every person visiting a state park in Florida contributes, on average, approximately $85.40 to the local economy.
This result, as well as the information for individual parks, can be accessed at https://www.floridastateparksfoundation.org/Impact.
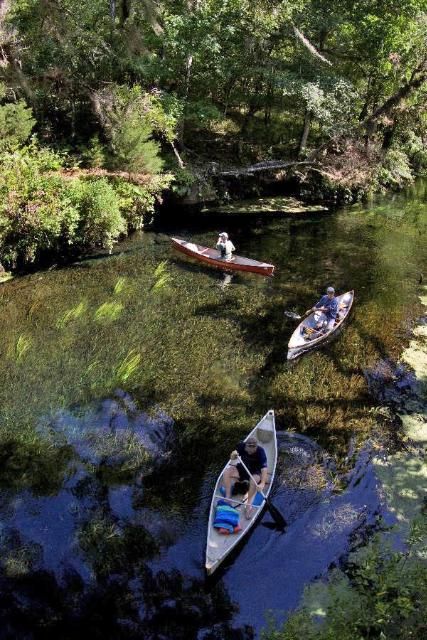
Credit: UF/IFAS
Recreation in Florida's National Parks
In addition to the state parks, Florida is home to 11 national parks, which are parks protected by the federal government due to their nationwide (and often, international) significance. Similar to the state parks, many of Florida's national parks are also created around water resources, for example, the Everglades National Park (which includes an internationally recognized wetland, the Everglades), Big Cypress National Preserve (organized around the Big Cypress Swamp); Biscayne National Park (which contains a combination of coastal waters, islands, and coral reefs); and Canaveral National Seashore (created on barrier islands). Other national parks include national monuments (such as Castillo de San Marcos and Fort Matanzas in St. Augustine) or national memorials (such as De Soto National Memorial in Bradenton) where water resources are still an important feature of the landscape. More information about Florida's National Parks can be found at the website of the National Park Service at https://www.nps.gov/state/fl/index.htm.
In total, Florida national parks were visited by 9.6 million people in 2018, and the total visitor spending was $530 million. These expenditures translated into $782 million in industry output, or $465 million in value added, supporting 8 thousand jobs. For each national park, the number of visitors, visitor spending, and economic impact information can be found at the National Park Service's site at https://www.nps.gov/nature/customcf/NPS_Data_Visualization/state.html?state=Florida.
Recreation in Florida's National Forests
In addition to the national parks, three national forests are located wholly or partially in Florida: Apalachicola National Forest (with multiple lakes, streams, and springs); Osceola National Forest (with swamps, ponds, and creeks); and Ocala National Forest (including more than 600 lakes, rivers and springs). In contrast to the national parks that are aimed at preserving the park sites in unchanged conditions, national forests are managed for various purposes, including timber, recreation, wildlife, fish, and more. For more information about Florida's National Forests, see the US Forest Service website at https://www.fs.usda.gov/.
The US Forest Service focuses on assessing employment associated with the national forests and related industries. The most recent report available online summarizes information for 2014 when the activities associated with Florida's national forests supported 930 jobs with 390 of them attributed to tourism and recreation (and the others linked to Forest Service resource management, payments to states/counties, and forest products) (US Forest Service 2016).
Recreation around Florida's Springs
In addition to the statewide analysis, multiple studies examined the contribution to the regional economy from specific sites. For example, Bonn and Bell (2003), Bonn (2004), and Borisova et al. (2014) examined the economic contributions of springs recreation to regional economies around different groups of Florida springs.
Bonn and Bell (2003) focused on Ichetucknee Springs, Wakulla Springs, Homosassa Springs, and Volusia Blue Spring and examined tourism and recreation in 1992–2002. In 2002, estimated spending by visitors at the four springs-related state parks varied from nearly $23 million at Ichetucknee Springs to $10 million at Blue Spring. Total visitor spending was $17.13 million per spring on average for these four springs. (If we account for inflation since 2002 using the consumer price index, this spending would be approximately $24.4 million per spring, on average.) This spending supported jobs for members of local communities, with 260 jobs per spring, on average.
In turn, Bonn (2004) focused on eight springs in northeast Florida: Silver Glenn Springs, Silver Springs, Alexander Springs, Apopka Spring, Ponce De Leon Springs, and Gemini Springs. Among the spring sites assessed, the highest visitor spending was estimated for Silver Springs—$61.5 million in the fiscal year 2003–2004 (after accounting for inflation in 2004–2019, this is equal to $85.2 million). This spending was estimated to support 1061 jobs. The other seven springs accounted for $3.7 million in the fiscal year 2003–2004 (or $5.1 million in 2019 dollars) and supported 63 jobs.
Borisova et al. (2014) focused on recreation around the springs at six state parks (Fanning, Ichetucknee, Lafayette Blue, Manatee, Troy, and Wes Skiles Peacock), four county parks (Hart, Little River, Poe, and Rum Island), and five sites that were privately owned at the time of the study (Blue Grotto, Blue Springs in Gilchrist County, Devil's Den, Ginnie Springs, and Hornsby Springs). For the fiscal year 2012–13, total visitor spending for the spring site recreation was $84.2 million (or $93.8 million in 2019 dollars). The spring-based recreation supported 1,160 full-time and part-time jobs and resulted in $6.56 million in local/state government tax revenues and $6.57 million in federal government tax revenues (approximately $7.31 million and $7.32 million after accounting for inflation in 2014–2019). Spring-based recreation also contributed $52.58 million in value added, equivalent to Gross Domestic Product (GDP). (If one considers inflation using the consumer price index, this estimate translates into $58.58 million in 2019 dollars.)
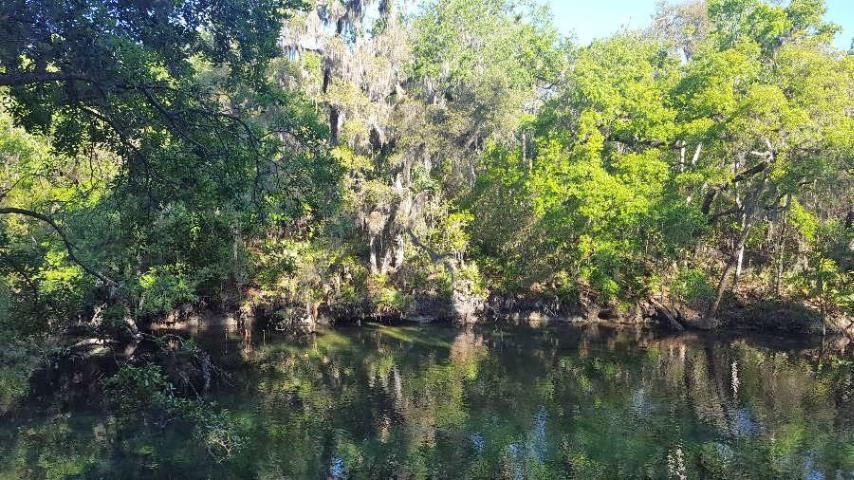
Credit: Tara Wade
Sportfishing in Florida
Florida is ranked first in the nation in spending by anglers (including spending for both saltwater and freshwater fishing), with approximately 3 million anglers spending almost $5 billion in 2011 (the most recent data available, see US Department of Interior et al. 2011, American Sportfishing Association 2013, and FFWCC 2019). This spending is estimated to support 80,211 jobs, and to generate $0.7 billion in federal tax and $0.5 billion in local and state tax (American Sportfishing Association 2013). Freshwater anglers specifically accounted for 39 percent of the total number of anglers (or approximately 1 million freshwater anglers in 2011) and almost $1 billion in total retail sales. These sales translated into $1.7 billion in economic contribution to the state economy in 2011, supporting 14,040 jobs and generating $0.1 billion in federal tax and another $0.1 billion in state and local taxes for freshwater fishing specifically (American Sportfishing Association 2013; FFWCC 2018). Additional information about the economic impact of freshwater fishing in Florida can be found on the websites of the Florida Fish and Wildlife Conservation Commission at http://myfwc.com/conservation/value/freshwater-fishing/ and http://myfwc.com/about/overview/economics/.
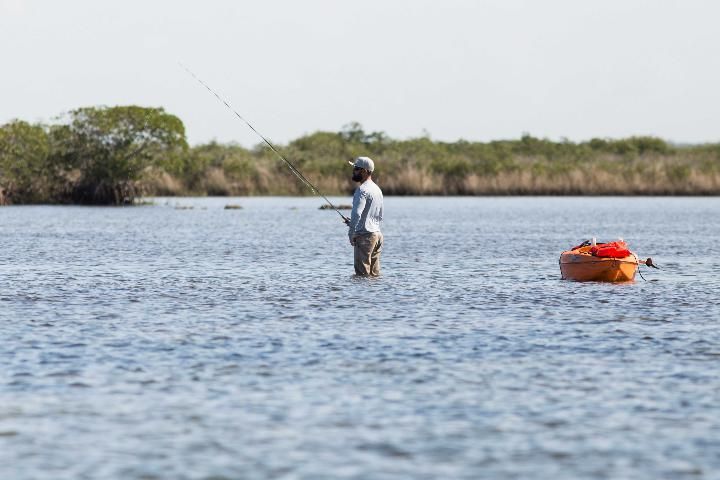
Credit: UF/IFAS
Boating in Florida
The Florida Fish and Wildlife Conservation Commission references the latest reports on the total spending and contributions to state economy from various recreational activities. For saltwater and freshwater boating, total spending in 2013 was $10.3 billion, and the economic contribution was $10.4 billion, supporting 82,752 jobs (see more at http://myfwc.com/about/overview/economics/).
Wildlife Viewing in Florida
Much of the wildlife viewing in Florida is associated with water-related sites (e.g., visitors observing alligators at a swamp site, or manatees at Crystal River). The Florida Fish and Wildlife Conservation Commission references the latest report documenting the economic importance of wildlife viewing activities for the state. In 2011, $3 billion was spent on wildlife viewing activities with an economic contribution of $4.9 billion and 44,623 jobs supported. More information can be found at the Florida Fish and Wildlife Conservation Commission's website at http://myfwc.com/about/overview/economics/.
All Outdoor Recreational Activities on Public and Private Lands and Waters
It is estimated that in 2016 approximately 75 percent of Florida's population (15 million Floridians) participated in outdoor recreation activities, along with about 102 million out-of-state visitors. The most common outdoor activities (based on the number of people reported engaging in these activities) were: saltwater beach activity, running/jogging, picnicking, and hiking. However, other activities associated with freshwater resources, though less popular in terms of the number of participants, accounted for a relatively large proportion of the total recreation days, implying that people spend more time on these recreational opportunities, per person. These were: wildlife viewing, freshwater beach activities, and paddling activities, such as canoeing and kayaking. The total economic impact of all 35 outdoor recreation activities during 2016 was $37 billion for residents and $126 billion for out-of-state visitors, which is approximately 15 percent of the total statewide economic output (Seidel et al. 2017).
Credit: UF/IFAS
Conclusion
Overall, the studies reviewed here illustrate significant economic contribution associated with water-based tourism and recreation in Florida. State and national parks, state forests, county parks, and locations outside these parks and protected areas attract visitors who spend money on local goods and services, contributing to employment and tax collection in the regions. And the estimates reported here focus on only one type of benefits associated with Florida water resources. To learn about the other significant benefits provided by water resources, see the rest of the documents in this series.
References
American Sportfishing Association. 2013. Sportfishing in America. American Sportfishing Association, 12p. https://asafishing.org/uploads/Sportfishing_in_America_January_2013.pdf
Bonn, M. A., and F. W. Bell. 2003. Economic impact of selected Florida springs on surrounding local areas. Florida Department of Environmental Protection, Tallahassee, FL. http://www.dep.state.fl.us/springs/reports/files/EconomicImpactStudy.doc
Bonn, M. A. 2004. Visitor profiles, economic impacts, and recreational aesthetic values associated with eight priority Florida springs located in the St. Johns River Water Management District. St. Johns River Water Management District, Palatka, FL. http://www.dep.state.fl.us/parks/planning/ssag/Mark%20Bonn%20Springs%20Study%202004.pdf
Borisova, T., A. W. Hodges, and T. J. Stevens. 2014. Economic Contributions and Ecosystem Services of Springs in the Lower Suwannee and Santa Fe River Basins of North-Central Florida. Report for Save Our Suwannee, Inc., Wildlife Foundation of Florida, and Alachua County, Florida. https://fred.ifas.ufl.edu/pdf/economic-impact-analysis/Springs_Economic_Report_6-4-14.pdf. Accessed February 3, 2023.
Florida Department of Environmental Protection (FDEP). 2019. Florida State Parks Economic Impact Assessment: Economic Impact Assessment 2018-2019. https://floridadep.gov/parks/parks-office-park-planning/documents/economic-impact-assessment-report-2019
Florida Fish and Wildlife Conservation Commission (FFWCC). 2019. Socioeconomic Assessment. http://myfwc.com/about/overview/economics/ .
IMPLAN Group, Inc. 2018. IMPLAN. Minnesota IMPLAN Group, Inc., Stillwater, Minnesota, April 1999, http://www.implan.com
IMPLAN Group, Inc. 2017. Glossary: Value Added. https://implanhelp.zendesk.com/hc/en-us/articles/115009498847-Value-added (Accessed on April 10, 2018)
Mulkey, D., and A. W. Hodges. 2018. Using Implan to Assess Local Economic Impacts. FE168. Gainesville: University of Florida Institute of Food and Agricultural Sciences. https://edis.ifas.ufl.edu/fe168
The National Park Service (NPS). 2018. https://www.nps.gov/nature/customcf/NPS_Data_Visualization/state.html?state=Florida
Regional Economic Models, Inc. (REMI). 2018. About Us. Regional Economic Models, Inc., Ahmerst, MA http://www.remi.com/about-us/ .
Seidel, V., A. Barker, C. Diamond, and D. Osorio. 2017. Economic Impact Analysis of Outdoor Recreation in Florida. The Balmoral Group, Winter Park, FL. https://floridadep.gov/parks/parks-office-park-planning/documents/2016-2017-scorp-economic-impact-outdoor-recreation
Stynes, D. 2001. PRR 840: Recreation and Tourism Economics; Week 6: Economic Impact; Economic Impact Concepts. Michigan State University. https://msu.edu/course/prr/840/econimpact/concepts.htm
US Department of the Interior, U.S. Fish and Wildlife Service, and U.S. Department of Commerce, U.S. Census Bureau. 2011 National Survey of Fishing, Hunting, and Wildlife-Associated Recreation.
US Bureau of Economic Analysis (BEA). Undated. Regional Economic Accounts: About Regional. US Bureau of Economic Analysis, Washington, D.C., https://www.bea.gov/regional/about.cfm
US Forest Service. 2016. National Forests in Florida: Job and Income Contributions for 2014 At a Glance. US Forest Service, US Department of Agriculture, 4p. https://www.fs.usda.gov/Internet/FSE_DOCUMENTS/fseprd565253.pdf. Accessed February 3, 2023.