Eco-labels are promotional tools that provide value to firms and consumers alike by communicating a product or service's environmentally friendly attributes. Recently, consumer willingness-to-pay (WTP) for environmentally friendly products has increased. For instance, consumers are willing to pay more for ornamental plants that are organic, locally grown, or pollinator friendly (Khachatryan et al. 2017, Rihn et al. 2016). However, heightened demand has resulted in increased availability of numerous eco-labels, which can decrease effectiveness and value due to consumer confusion and misunderstanding (Karna et al. 2001, McCluskey & Swinnen 2004, Sirieix et al. 2012). Previous studies found that well-designed eco-labels improve consumer understanding, clarity, and choice (Testa et al. 2015, Vlaeminck et al. 2014), often due to increased trust in the standards and familiarity (Janssen & Hamm 2012). This report summarizes a study that addressed how different eco-label formats (text vs. logo) impact consumer visual attention, preferences, and valuations of fruit-producing plants.
Results are of particular interest to green industry stakeholders (e.g., garden centers, marketers, growers, etc.) that sell plants to end consumers, produce plants for retail sales, and are considering eco-labels as marketing tools, or that use promotions to communicate with end consumers. Firms involved with developing, promoting, and regulating eco-labels may also find the results interesting. Knowing how different formats of eco-labels impact consumers' behavior reduces the firm's risks (e.g., financial, labor, and implementation costs) when deciding on potential eco-label promotions and necessary production method modifications to qualify for those programs. This report briefly explains the experimental procedure, results, and key findings and implications (from the study conducted by Rihn et al. 2019).
Experimental Methods
To study the influence of eco-label format on consumers' visual attention, preferences, and valuation for plants, an experimental auction was used in conjunction with eye-tracking technology. Experimental auctions are used to simulate a real purchasing event where participants submit bids on items and the auction "winner" purchases a randomly drawn item (Lusk & Shogren 2007). Here, a second price experimental auction was utilized. In second price experimental auctions, respondents submit their bids and the highest bidder "wins" the auction but only pays the second highest price (i.e., the "market price") and takes home that item. The disconnect between the bid and market price creates an environment where the best bidding strategy is to submit bids that accurately reflect one's true value for the product(s). Specifically, if a respondent overbids, s/he risks paying more, whereas if s/he underbids, s/he risks missing the opportunity to purchase a product s/he wants. Consequently, respondents' bids are more likely to reflect their actual value for the products due to real economic consequences.
In this study, respondents viewed images of real products on a computer screen when determining their bids during the experimental auction. Images on computer screens were utilized to accommodate the use of eye-tracking technology (ETT). A stationary eye-tracking camera was mounted at the base of the computer monitor and recorded respondents' eye movements as they assessed each product (for more information on ETT, please see Khachatryan and Rihn (2014)). Fixation count (FC) metrics were then extracted for each image to determine if visual attention was impacted by the eco-label's format. Fixations occur when the eye is relatively still and focused on the stimulus. Often fixations are correlated with increased interest in and processing of stimuli (Orquin & Mueller Loose 2013).
During the auction, respondents submitted bids on 14 fruit-producing plant images (banana, papaya, or blueberry) with a mix of different eco-labels (Table 1). The eco-labels included an industry eco-label, a non-GMO eco-label, and an heirloom eco-label. Each eco-label had three levels—logo, text, or absent. Additionally, the industry eco-label text was informative while the non-GMO and heirloom eco-labels just stated the information presented in the logos. Regression (e.g., random effects tobit) models were used to analyze the data.
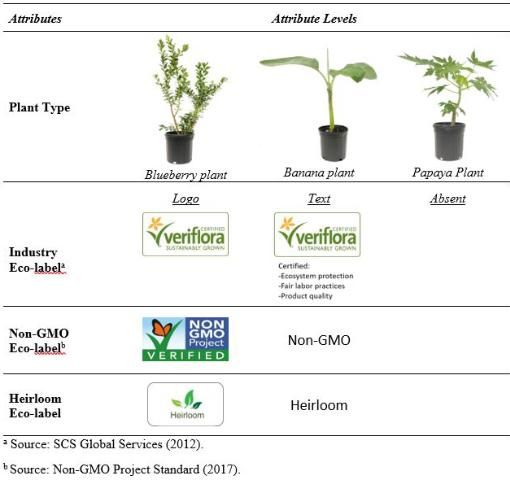
The study took place in central Florida and 53 people completed the experiment. Respondents were randomly assigned to one of the auction rounds. There were multiple auction rounds with two to seven respondents per auction. Each auction round had one winner who was required to purchase the real product at the market price. Respondents also completed a survey that contained a question about how knowledgeable they were about each specific eco-label and a set of standard demographic questions. Respondents were compensated $30 (or equivalent if they won the auction round) at the completion of the auction and survey.
Results
Summary statistics of participants and state population statistics are presented in Table 2. In general, the sample was slightly different from the state as a whole. The sample overrepresents older participants, women, people with higher education attainment, and higher-income households.
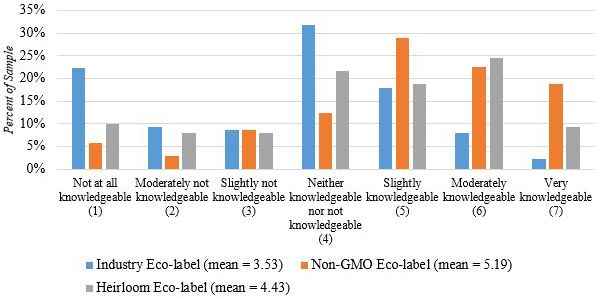
Respondents' knowledge of the different eco-labels varied (Figure 1). The distribution of the industry eco-label indicated a higher proportion of respondents indicating "not at all knowledgeable" or "neither knowledgeable nor not knowledgeable." Conversely, both the non-GMO and heirloom eco-labels' distributions were skewed to the right, indicating increased knowledge. A means comparison revealed significance across all three eco-labels' means where respondents were the least knowledgeable of the industry eco-label, followed by the heirloom eco-label, and the most knowledgeable about the non-GMO eco-label.
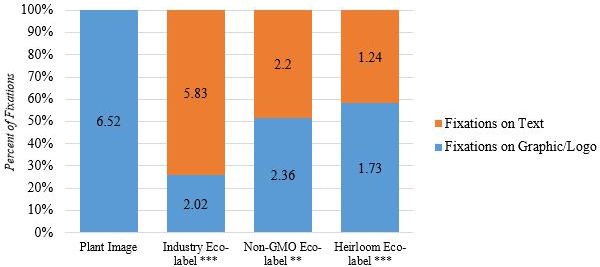
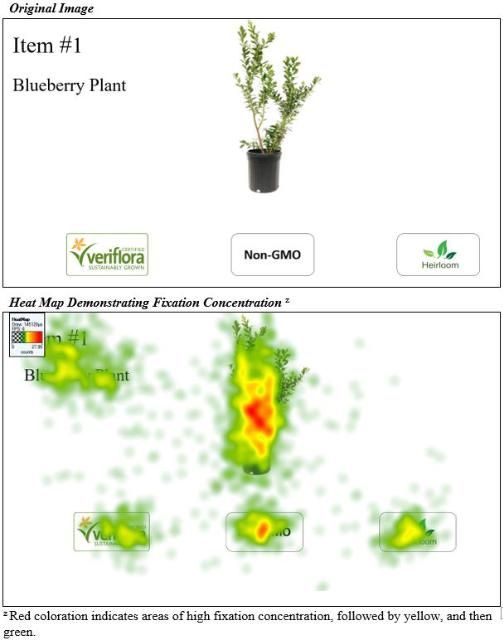
The visual attention results demonstrated that the plant images captured the greatest number of fixations (Figures 2 and 3). For the non-GMO and heirloom eco-labels, the logo versions captured more visual attention than the text formats. However, for the industry eco-label, the logo with informative text captured the most fixations. This is not surprising given the decreased knowledge and additional information provided in the industry eco-label text.
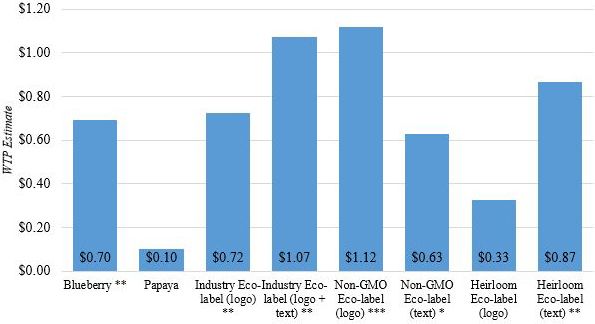
Overall, the presence of an eco-label improved respondents' valuations of the fruit-producing plants (Figure 4). The industry eco-label logo and logo with informative text generated $0.72 and $1.07 premiums when compared to plants without the industry eco-label. The non-GMO eco-label logo generated a $1.12 premium while the text version created a $0.63 premium compared to unlabeled plants. Only the heirloom eco-label text version was significant and garnered a $0.87 premium over unlabeled plants. Respondents were also willing to pay $0.70 more for blueberry plants when compared to banana plants.
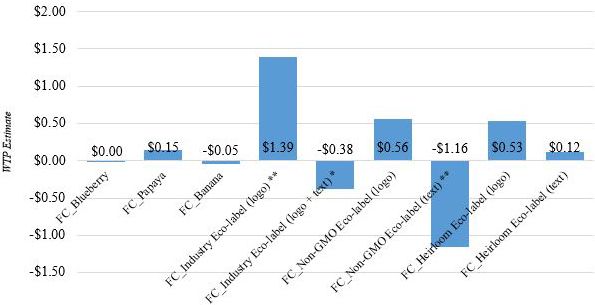
The visual attention results demonstrated how increased visual attention impacted respondents' bids on the plants (Figure 5). Additional fixations on the industry eco-label logo resulted in a $1.39 premium whereas additional fixations on the industry eco-label logo with informative text decreased bids by $0.38. Interestingly, similar results were observed with the non-GMO eco-label where the text version reduced WTP bids by $1.16.
In summary, consumers' increased demand for environmentally friendly products paired with greater availability of eco-label options heightens the importance of understanding how different eco-label formats influence consumer behavior. In turn, this information can aid green industry stakeholders as they determine their eco-labeling-related marketing strategies. Cumulatively, the results suggest that logos may be more effective than text eco-labels in capturing visual attention and generating value for end consumers. Given these results, the following key findings and implications were identified:
- Eco-labels represented with logos captured more visual attention unless the eco-label was less familiar and accompanied by informative text (e.g., the industry eco-label). This implies:
- Logos are more visually attractive.
- Educational or informative promotions may improve consumers' receptiveness to new eco-labels when they are first introduced.
2. Plants capture the most visual attention.
- Displays of the products are important and should include the most visually appealing examples.
3. Consumers value eco-labeling on fruit-producing plants.
- Eco-labeling can be used to differentiate and position the firm and/or brand as environmentally conscious.
- Eco-labels can be used to bolster the firm's value proposition by demonstrating and promoting value-added credence attributes.
4. Visual attention to eco-label logos generates value while visual attention to text versions reduces value.
- It is important to create visually appealing graphics. Eco-label effectiveness may be heightened if the logos are easy to recognize and comprehend.
- The effectiveness of the eco-label logo may be improved if the logo is already used in other industries which results in increased consumer knowledge (e.g., non-GMO eco-labels).
Acknowledgements
Funding for this research was provided by the National Horticulture Foundation.
Literature Cited
Janssen, M., and U. Hamm. 2012. "Product labelling in the market for organic food: Consumer preferences and willingness-to-pay for different organic certification logos." Food Quality and Preference 25(1): 9–22.
Karna, J., H. Juslin, V. Ahonen, and E.N. Hansen. 2001. "Green advertising: Greenwash or a true reflection of marketing strategies?" Green Management International 33: 33–70.
Khachatryan, H., A. L. Rihn, B. Campbell, C. Yue, C. Hall, and B. Behe. 2017. "Visual attention to eco-labels predicts consumer preferences for pollinator friendly plants." Sustainability 9: 1743.
Khachatryan, H., and A. Rihn. 2014. Eye-tracking methodology and application in consumer research. FE947. Gainesville: University of Florida Institute of Food and Agricultural Sciences. https://edis.ifas.ufl.edu/fe947
Lusk, J. L., and J. F. Shogren. 2007. Experimental Auctions – Methods and Applications in Economic and Marketing Research. New York: Cambridge University Press.
McCluskey, J. J., and J. F. M. Swinnen. 2004. "Political economy of the media and consumer perceptions of biotechnology." American Journal of Agricultural Economics 8(5): 1230–1237.
Non-GMO Project Standard. 2017. Non-GMO Project Standard, version 14.2. Accessed 12 April 2023. https://www.nongmoproject.org/wp-content/uploads/Non-GMO-Project-Standard-Version-16.pdf
Orquin, J. L., and S. Mueller Loose. 2013. "Attention and choice: A review on eye movements in decision making." Acta Psychologica 144:190–206.
Rihn, A., H. Khachatryan, B. Campbell, C. Hall, and B. Behe. 2016. "Consumer preferences for organic production methods and origin promotions on ornamental plants: Evidence from eye-tracking experiments." Agricultural Economics 47: 1–10.
Rihn, A., X. Wei, and H. Khachatryan. 2019. "Text vs. logo: Does eco-label format influence consumers' visual attention and willingness-to-pay for fruit plants? An experimental auction approach." Journal of Behavioral and Experimental Economics 82: 101452 ISSN 2214-8043. https://doi.org/10.1016/j.socec.2019.101452
SCS Global Services. 2012. Certification of sustainably grown cut flowers and potted plants, requirements for growers and handlers. Accessed 12 April 2023. https://www.scscertified.com/docs/VeriFlora_Version3_0407F.pdf
Sirieix, L., M. Delanchy, H. Remaud, L. Zepeda, and P. Gurviez. 2012. "Consumers' perceptions of individual and combined sustainable food labels: A UK pilot investigation." International Journal of Consumer Studies 37(2): 143–151.
Testa, F., F. Iraldo, A. Vaccari, and E. Ferrari. 2015. "Why eco-labels can be effective marketing tools: Evidence from a study on Italian consumers." Business Strategy and the Environment 24: 252–265.
Vlaeminck, P., T. Jiang, and L. Vranken. 2014. "Food labeling and eco-friendly consumption: Experimental evidence from a Belgian supermarket." Ecological Economics 103(2014): 180–190.
U.S. Census Bureau. 2018. QuickFacts Florida; United States. Accessed 17 August 2019. https://www.census.gov/quickfacts/fact/table/FL,US/PST045218