Introduction
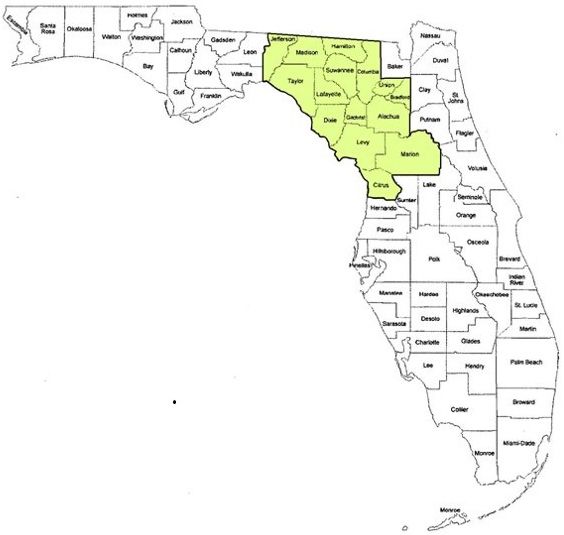
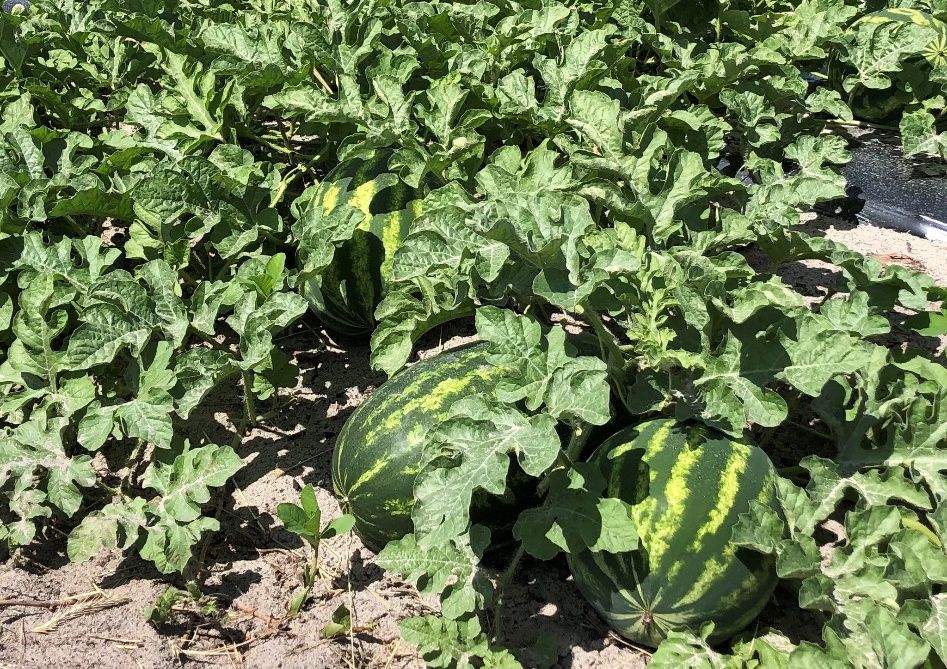
Watermelon is a major crop in Florida. In 2019, watermelon was harvested from 24,500 acres in Florida and had a free-on-board (FOB) packinghouse value of $161.5 million (USDA-NASS 2019). North Florida accounted for two-thirds of the watermelon farms and about half the watermelon acreage in Florida in 2017. North Florida counties of Levy, Gilchrist, Marion, Alachua, and Suwannee harvested watermelon from more than 1,000 acres each (USDA-NASS 2017).

Credit: M. Warren
Agricultural enterprise budgets provide a detailed accounting of production costs associated with a crop or other farm enterprise. Farmers are encouraged to set up their own enterprise accounting systems and prepare budgets to assist with various farm decisions (e.g., related to crop choices, production practices, marketing and pricing, and investments in farm assets). University-prepared production budgets can provide a framework for farmers to prepare their own budgets and a benchmark against which they can compare their own costs and revenues.
Various other clientele rely on university-prepared enterprise budgets. Agricultural lenders require financial projections, which are based on enterprise budgets. Property appraisers request budgets to help in valuing agricultural land. Insurance companies sometimes use enterprise budgets to help set crop insurance policies. Crop researchers and consultants can use budgets as a starting point for analyzing the economic implications of changes in crop production. The intended audience for this publication is watermelon growers and these other stakeholders in the watermelon industry.

Credit: K. Athearn
This publication describes a sample production budget for spring planting of seedless watermelon in north Florida. In north Florida’s top five watermelon-producing counties, average watermelon acreage ranged from 49 acres per farm to 191 acres per farm in 2017 (USDA-NASS 2017). Most watermelons are produced as part of a larger, diversified farming operation with land that rotates between watermelon production, bahia grass and cattle grazing, or other crops. For the production scale represented in this budget, we assume 120 acres of watermelon production on a 600-acre farm.
Budget estimates are based on information from research trials, crop specialists, input suppliers, price reports, and watermelon growers, including seventeen grower interviews between 2016 and 2020. Production equipment and practices shown in the budget are intended to be typical for the north Florida region. Input levels in the budget are in line with UF/IFAS recommendations, although site-specific soil conditions, weather, pest pressure, and other variables affect the optimal input levels.
Our sample estimates of costs and returns are intended to represent reasonable expectations, but they do not represent a statistical average for the region. Actual costs and returns vary by grower and year, and statistical measures of watermelon production costs and returns are not available. An Excel file with the sample budget is available as a template for growers to enter their own budget information. It can be found on the North Florida Enterprise Budgets website (https://svaec.ifas.ufl.edu/agribusiness/farm-enterprise-budgets/).
We describe each part of the budget below. These include fixed assets, variable operating costs, materials and services, harvesting and marketing, and a budget summary.
Fixed Assets
Fixed assets are tangible items with a useful life of multiple years and a substantial cost—above a business’s capitalization limit (Bragg 2019). Fixed assets needed for watermelon production include land, farm machinery, irrigation equipment, and vehicles. These assets may be owned or leased by the watermelon grower. Annual ownership costs for fixed assets include depreciation, interest, property tax, insurance, and housing. When these assets are leased, the grower does not incur those costs, but makes fixed payments to the asset owner.
Table 1 lists fixed assets commonly used for north Florida watermelon production. The list was prepared with input from Extension agents, specialists, and growers. Annual ownership costs are estimated based on price quotes from equipment dealers and machinery cost estimation guidelines following the American Society of Agricultural and Biological Engineers (2015a and 2015b) and Edwards (2015). Vehicle ownership costs are estimated using Edmunds.com (2020).
To arrive at a cost per acre for fixed assets, assumptions must be made about the number of acres on which these assets are employed. We assume a 600-acre farm growing watermelon on 120 acres (three 40-acre parcels) in any given year. Some assets are used only on a 40-acre parcel. Other assets are used on all watermelon parcels (120 acres) or on the entire farm (600 acres). For example, the well and pump are tied to a 40-acre parcel, not used on other parcels. The bed shaper is used on all 120 acres of watermelon but not on the other farm acreage. The tractors are used on all 600 acres, both for watermelon and other farm enterprises. Table 1 shows the annual cost per watermelon acre for each asset. Total annual ownership costs per acre for fixed assets used in watermelon production are estimated to be $518.
Labor and Equipment Operating Costs
Besides paying for materials, services, and fixed assets, watermelon growers incur substantial costs for labor and equipment operation. Equipment operating costs include electricity, fuel and lubricants, and repair and maintenance. Labor hours, equipment operating time, and vehicle miles are estimated based on common production practices and input from Extension agents, specialists, and growers. Fuel consumption and repair cost estimates are based on the operating time and formulas provided by ASAE (2015a and 2015b). Electricity consumption for irrigation is estimated based on the volume of water pumped and formulas provided by Martin et al. (2011).
Table 2 shows the breakdown of energy cost, repair cost, and labor cost estimates by activity. Total equipment operation and labor cost per acre are estimated at $473. That total includes $322 for labor, $34 for variable electricity, $60 for fuel and lubricants, and $57 for repairs. Another $7 per acre for an electric standby charge is added to the budget summary in total variable operating costs.
Materials and Services
Table 3 lists materials and services commonly used in north Florida watermelon production. These include seeds and transplants, fertilizers and lime, and pesticides. Plastic mulch, irrigation supplies, soil testing, and bee-hive rental are common annual expenses. Some growers also pay for custom fertilizer spreading, cover crop seeds, scouting, and crop insurance. Types and quantities of materials are based on information from Extension agents, specialists, growers, and UF/IFAS recommendations. Input prices are based on quotes from agricultural input suppliers and service providers. We estimate cost per acre of $599 for seeds and transplants, $297 for fertilizers and lime, $314 for pesticides, and $763 for other materials and services. Total materials and services sum to $1,973 per acre per watermelon season.
Harvesting and Marketing
Watermelon revenue and some costs will be proportional to the amount harvested. The statewide average yield reported by USDA was 36,000 lbs per acre in 2018 and 37,000 lbs per acre in 2019.The watermelon farms on which we based this budget reported typical yields higher than the statewide average. Some growers mentioned a conservative target yield of 40,000 lbs per acre, although yields as high as 65,000 lbs per acre are achievable. Our sample budget assumes 40,000 lbs per acre harvested from the field and a packout percentage of 97%. That produces a marketed yield of 38,800 lbs per acre.
Watermelon prices fluctuate within and between seasons. The north Florida spring watermelon harvest typically occurs between mid-May and late-June. USDA-AMS (2020) reports daily shipping-point, free-on-board (FOB) prices by region. Daily shipping quantities from Florida are available for 2019 and 2020 (USDA-AMS 2021). Using the available data we calculate a quantity-weighted average FOB price for the 2019 and 2020 spring seasons of $0.17 per pound for seedless watermelon (not labeled organic), shipping from north and central Florida packinghouses. We use $0.17 per pound as the average FOB price of marketed yield, shown in Table 4.
The costs of harvesting, hauling, and packing, as well as broker fees, vary in proportion to the amount harvested or sold. We also estimate fixed costs for food safety compliance and packinghouse overhead of $100 per acre. Harvesting and marketing costs amount to $2,476 per acre.
Table 4 summarizes our estimates of yield, price, and harvesting and marketing costs for the base budget. Because yields and prices can vary widely and have a major impact on grower returns, we provide a sensitivity table (Table 6) showing estimated net returns at five different yield levels and five different price points. Yields range from 50% below to 50% above the central estimate. We use the lowest and highest unweighted season average prices between 2014 and 2020 as the price end points in the sensitivity table. Sensitivity results are shown in Table 6.
Budget Summary
A budget summary is shown in Table 5. Watermelon sales are $6,596 per acre (FOB packinghouse). Harvesting and marketing costs are estimated at $2,476 per acre. Variable operating costs, including materials and services, equipment operation, and labor, sum to $2,453. Adding $112 interest on operating costs brings the total variable operating cost to $2,565 per acre. Fixed production overhead costs are $518 per acre. Based on these figures, the net return over harvesting and marketing costs is $4,120. That is the amount the grower receives before accounting for any pre-harvest costs. The net return over variable costs is $1,655. That represents the contribution margin, which is the return to fixed costs, management, general and administrative (G&A) costs, and profit. The net return over total product costs is $1,037. That represents the cost of revenue margin or the return over total production and brokerage costs (FFSC 2016; Bragg 2019). It is the return to management, general and administrative costs, and profit.
Net return over total product costs is calculated for five different yields and five price points in Table 6. The sensitivity analysis demonstrates that negative returns can occur at the lower ends of the yield and price ranges. Although in a good year watermelon returns are substantial, watermelon growers face the risk of financial losses in a bad year.
An interactive watermelon budget template is available as an Excel file on the North Florida Enterprise Budgets website (https://svaec.ifas.ufl.edu/agribusiness/farm-enterprise-budgets/). It contains the revenue, cost, and return estimates described in this paper. The spreadsheet also allows users to enter their own information, and the budget tables will recalculate automatically. Watermelon growers and other industry stakeholders can use our sample budget for “ballpark” estimates of costs and returns or use the budget template to make their own estimates.
Acknowledgements
The authors would like to acknowledge a USDA-NIFA Methyl Bromide Transition Program grant, Award Number 2016-51102-25814, that supported our research on watermelon production costs and returns.
References
American Society of Agricultural and Biological Engineers (ASAE). 2015a. Agricultural Machinery Management. Publication ASAE EP496.3 FEB2006 (R2015). St. Joseph, MI: ASABE.
American Society of Agricultural and Biological Engineers (ASAE). 2015b. Agricultural Machinery Management Data. Publication ASAE D497.7 MAR2011 (R2015). St. Joseph, MI: ASABE.
Bragg, S. 2019. Agricultural Accounting: A Practitioner’s Guide. 2nd edition. Centennial, CO: AccountingTools, Inc.
Edmunds.com 2020. True Cost to Own® data. Cost of Car Ownership website. Available at https://www.edmunds.com/tco.html.
Edwards, W. 2015. Estimating Farm Machinery Costs. Ag Decision Maker File A3-29. Ames, IA: Iowa State University.
Farm Financial Standards Council (FFSC). 2016. Management Accounting Guidelines for Agricultural Producers. Menomonee Falls, WI: Farm Financial Standards Council.
Martin, D. L., T. W. Dorn, S. R. Melvin, A. J. Corr, and W. L. Kranz. 2011. Evaluating Energy Use for Pumping Irrigation Water. Proceedings of the 23rd Annual Central Plains Irrigation Conference. Colby, KS: Central Plains Irrigation Association.
United States Department of Agriculture, Agricultural Marketing Service (USDA-AMS). 2020. Specialty Crop Shipping Point Prices. Run a Custom Report. Available at https://www.ams.usda.gov/market-news/custom-reports.
United States Department of Agriculture, Agricultural Marketing Service (USDA-AMS). 2021. National Watermelon Report. Available at https://usda.library.cornell.edu/concern/publications/2j62s4901?locale=en.
United States Department of Agriculture, National Agricultural Statistics Service (USDA-NASS). 2017. 2017 Census of Agriculture – County Data.
United States Department of Agriculture, National Agricultural Statistics Service (USDA-NASS). 2019. 2019 State Agriculture Overview – Florida.
Table 1. Fixed Assets and Estimated Costs
Table 2. Equipment Operation and Labor Cost Per Acre
Table 3. Materials and Services
Table 4. Harvesting and Marketing Costs
Table 5. Budget Summary
Table 6. Sensitivity Analysis