MENU

AskIFAS Powered by EDIS

How to Conduct an On-Farm Dye Test to Improve Drip Irrigation Management in Vegetable Production

Eric Simonne, David Studstill, Michael Dukes, John Duval, Robert Hochmuth, Gene McAvoy, Teresa Olczyk, Steve Olson, Elizabeth Lamb, and Guodong Liu

Improving irrigation management in vegetable crop production reduces production costs, saves water, and reduces the risk of nutrient leaching. As water movement in the root zone below mulched beds is difficult to see, injecting soluble dye through the drip irrigation system provides a simple and practical method to visualize water movement in the soil. Understanding water movement in raised beds is essential for improving irrigation scheduling and nutrient delivery. Proper irrigation scheduling requires a target irrigation volume, a measure of soil moisture, knowledge of how much water the root zone can hold, and a method to account for rainfall contribution to replenishing soil moisture. By showing how deep and how wide water moves in mulched beds as irrigation volume increases, dye tests are practical tools for determining how much water can be held in the root zone. This information is then used to determine how to split irrigation events and better manage irrigation. 

Besides irrigation volume (determined by drip tape flow rate, system pressure and operating time), several factors may affect water movement in mulched beds. These include soil texture, soil organic matter content, bed compaction and/or width, and soil depth and/or the presence of an impermeable layer. Hence, it is not always possible to apply results of a dye test performed under one set of conditions to another field with different conditions. Therefore, on-farm dye tests should be performed to gain a specific understanding of water movement in that field. The objectives of this article are to (1) describe simple and practical step-by-step procedures to adequately conduct an on-farm dye test, (2) provide instructions for data collection and interpretation and (3) to introduce this method to county Extension faculty, students interested in crop production, growers, certified crop advisors, crop consultants, consumers, environmentalists, and policy makers in the agricultural sector for better water savings and environmental sustainability.

Procedures for Conducting a Dye Test

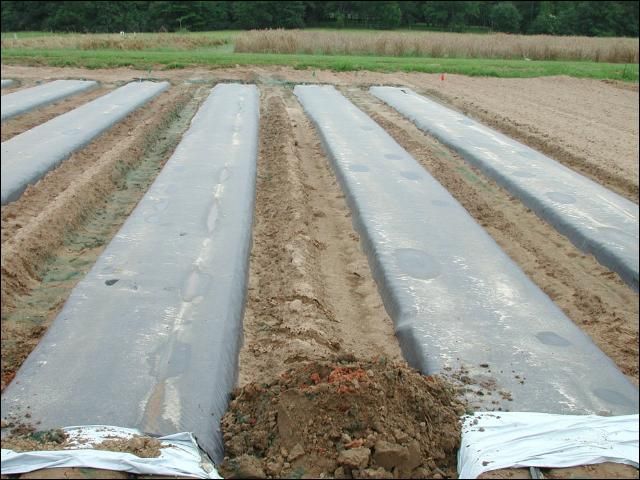
A dye test requires meticulous planning and preparation (steps 1 to 7 in Table 1). It is important to conduct the dye test under conditions like actual production conditions so that water movements observed after the dye test are representative of those occurring during crop production. Since water volumes applied are a function of irrigation time and drip tape flow rate, it may be useful to select and test more than one drip tape type (manufacturer, emitter spacing, and flow rate) and use 1 or 2 drip tapes on each bed. Irrigation times should be selected to cover the range of typical irrigation times used during the crop cycle. It is essential to realize that although irrigation time and irrigation volume are often used interchangeably (rightfully so for a known flow rate), the movement of the waterfront depends on irrigation volume applied (in gallons/100 linear-bed feet), not irrigation time itself. The existing drip irrigation system may need to be modified so only a small area of the field is used for the dye test (Table 2).

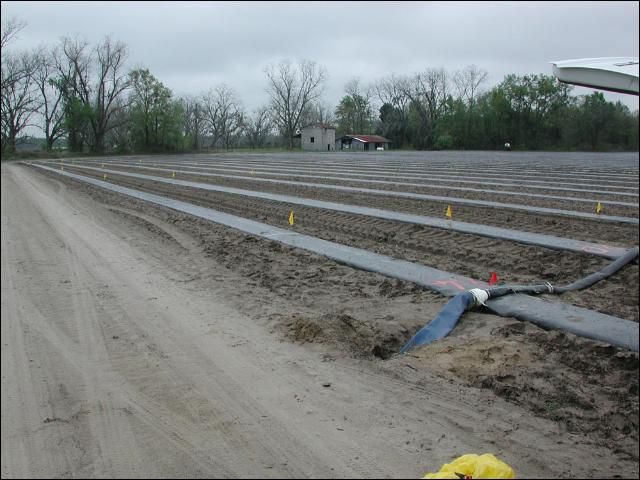
For practical purposes, the dye field will be divided into beds (where different drip tapes will be used). Each bed will also be divided into sections corresponding to each of the irrigation times selected (Figure 1). Dye selection (step 5, Table 1) is a critical step. Since the interpretation of the dye test assumes that the dye moves with the waterfront, selected dye should be totally soluble and not adsorbed by soil particles or soil organic matter. On the day of the dye test (steps 8 to 12, Table 1), consider starting early so that the entire test may be conducted during the same day. Once the system is operating, inject the dye and tie the drip tapes at the pre-determined times. Dye may be injected with a Dosatron or Mazzi injector. The shortest irrigation times will be located away from the water source, and increasingly longer irrigation times will be closer to the water source (Figure 2).
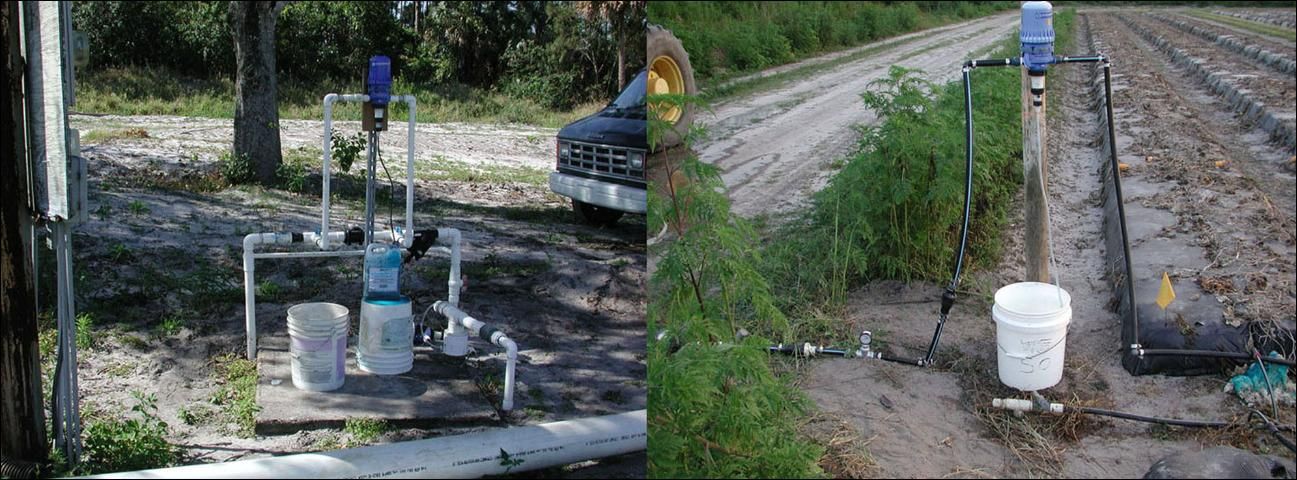
Figure 1. Example of injection loops using a Dosatron (left) or a Mazzei injector (right).
Figure 1.  Example of injection loops using a Dosatron (left) or a Mazzei injector (right).
Credit: Eric Simonne, UF/IFAS


Figure 2. Example of possible layout for a dye test.
Figure 2.  Example of possible layout for a dye test.
Credit: Eric Simonne, UF/IFAS

Pressure monitoring during the dye test is important, especially each time a section is tied off. As time progresses, the length of the remaining drip tape is shortened in the irrigation system, which may result in increased pressure and water flow. Volumes delivered by the drip system should be monitored according to operating time and/or with the water meter (Table 2). Pressure and water flow should be kept as constant as possible during the entire test to ensure that operating conditions match those recommended by manufacturers.

Data Collection and Observation of the Dye Pattern

After the dye test, longitudinal and transverse sections should be carefully dug for each drip tape and each operating time (step 13, Table 1). This may be the most time-consuming step. Each dye pattern will appear as a blue ring below each emitter (Figure 3). The dye pattern may appear faded immediately after digging. However, the contrast between the colored areas and the remaining soil will improve as the bed dries out. When dye is injected during the entire test, all the wetted area is colored in blue. Observe the shape of the wetted zone (Figure 4): is it round or elongated? Did the dye move outside the bed? When did emitter-to-emitter coverage occur? When did the dye pass below the root zone (12 inches)? When did the dye reach the impermeable layer? How did the water move then? What is the size and shape of the wetted zone under typical irrigation times?
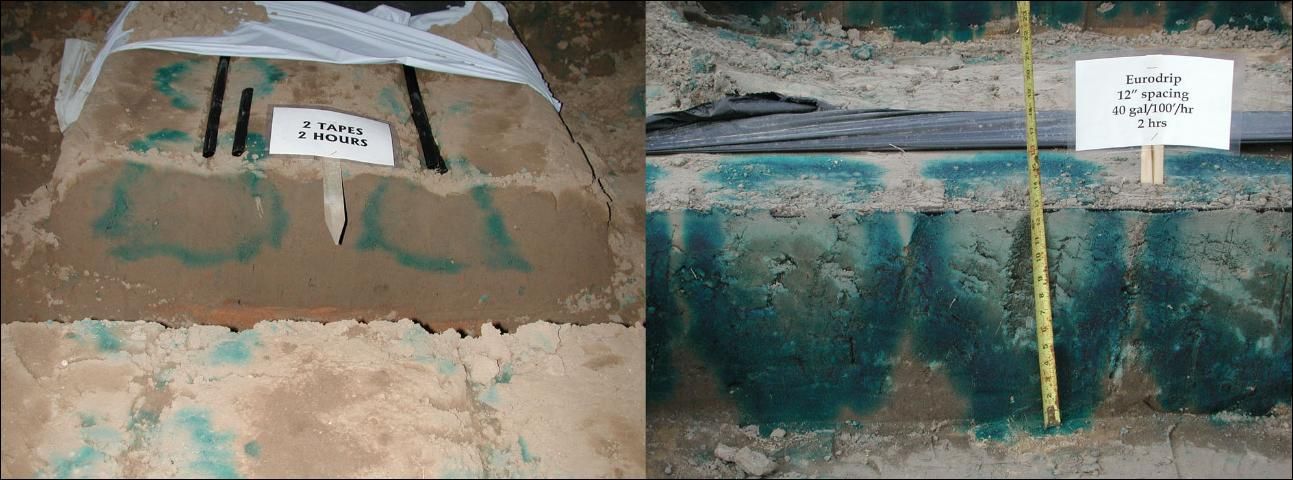
Figure 3. Sample dye pattern on transverse (left) and longitudinal (right) sections.
Figure 3.  Sample dye pattern on transverse (left) and longitudinal (right) sections.
Credit: Eric Simonne, UF/IFAS


Figure 4. Water redistribution in the presence of an impermeable layer. In Quincy, FL on an Orangeburg loamy sand, dye appeared in the alleys (a). In Hendry county, the wetted zone has an omega shape when the water front reaches the impermeable layer (b).
Figure 4.  Water redistribution in the presence of an impermeable layer. In Quincy, FL on an Orangeburg loamy sand, dye appeared in the alleys (a). In Hendry county, the wetted zone has an omega shape when the water front reaches the impermeable layer (b).
Credit: Eric Simonne, UF/IFAS

After observation, measurements of length, depth and width of the wetted zone should be carefully made (step 14, Table 1) and recorded (Table 3). Pictures may also be taken to provide a permanent record of the dye test.

Using Dye Movement Information for Improving Irrigation Management

While observation provides qualitative information, quantitative measures are needed to improve irrigation management. Important wetting characteristics are maximum wetted width, shortest time (or volume) needed for emitter-to-emitter coverage, and time (or volume) when water reaches the bottom of the root zone (Table 4). Each irrigation event must be a compromise between providing moisture to the crop and minimizing off-site water movement.

Table 1. 

Step-by-step operations needed to conduct an on-farm dye test.

When

Step No.

Operation

Comment

Before the day of the dye test

1

Prepare the field and form the beds as will be done for vegetable production.

Read drip tape information provided by the manufacturer, record nominal flow rates, operating pressure, and maximum bed length. If two drip tapes are used, calculate the 'apparent flow rate' by multiplying by two the drip tape nominal flow rate.

Flush irrigation system as recommended.

2

Isolate a section of the field where the dye test will be performed.

Select a representative area of the field close to a water source. Area selected should be between 1,000 to 2,000 linear bed feet.

3

Connect the water source to the section of the field where the dye test will be performed.

Because this section may be much smaller than the entire field, a 3/4 to 1 inch poly-pipe may be temporarily used to supply water to this section.


4

Prepare an injection point for the dye.

The injection point should be close to the field section where the dye will be injected (5 to 15 ft).

Components of the injection manifold are described in table 2.

5

Select a water-soluble dye.

While several dyes are available on the market, satisfactory results have been achieved with the blue Dynamark U.V. dye. Always read and follow the label. Dye costs approximately $40/gallon. Dyes are highly concentrated and should be used with care.

6

Mark bed sections 30 to 50 feet in length. Sections may be marked with flags or paint. Select a few representative operating times.

Each section will correspond to a different operating time.

Operating times should represent the different irrigation lengths used throughout the season. For example, possible operating times are 1, 2, 3, 4, 6, and 8 hours. Operating times of 1 to 4 hours represent irrigation times, while 6 and 8 hours represent excessive irrigations or irrigations needed to apply fumigants.

7

Flush the system.

Essential if system was left idle for few days after installation.

On the day of the dye test

8

Bring stopwatch, data collection form and pen, a knife, a tape measure and shovels.

Stopwatch will be used to keep track of irrigation times; data collection form will be used to record time and irrigation volume applied (based on water meter readings); the tape measure will be used to measure the wetting zone.

9

Bring a 5-gallon bucket.

May be used to pre-dilute concentrated dye.

10

Turn on the water and pressurize system.

Read and record pressures at gauges.

Check and repair leaks in the field.

11

Start injecting dye once system has been charged.

Read and record time and initial reading on water meter.

12

At pre-selected times (see step 6), cut and tie the tapes at pre-marked spots (see step 6).

Sections receiving the shortest irrigation times should be placed at the farthest end of the test.

Monitor pressure changes at gauges 1, 2, and 3 after each section is tied.

After the dye test

13

For each section, dig a transverse (perpendicular to the bed axis) and a 4-foot longitudinal (parallel to the bed axis) section.

Holes should be deep enough to see the bottom of the dye. The dye may appear fade immediately after digging, but soil drying will improve contrast. When digging, always select the sides best exposed to direct sun light so that soil will dry faster.

14

Measure and record the position of the waterfront for each visible emitter.

Observe the shape of the dye pattern, notice uniformity. Record depth and width on transverse bed sections, and depth and length on the longitudinal bed sections. Note that different numbers of emitters (and therefore measurements) may be done on the transverse and longitudinal sections.

15

Disconnect the injection point to allow drip irrigation system to operate normally.

The execution of the dye test should not have long-term effects on drip system operation and design.

Table 2. 

Description of the injection manifold (from water source to field).

Component

Role

Relative importance

On-off valve

Control water supply.

Essential

Pressure gauge 1

Monitor changes in pressure of water source. In-coming pressure should be in the 40 to 50 psi.

Practical

Back-flow prevention device

Prevent water and dye to be siphoned back into the water source.

Essential (mandated by Florida Statutes)

In-line faucet

Outside supply of water.

Very practical when no other water source is available

Water meter

Record water volume applied.

Essential

In-line screen filter

Reduce risk of clogging. Improves uniformity.

Useful

Pressure reducer

Maintain pressure close to drip-tape manufacturer operating pressure. Ensures proper flow rate and improves uniformity.

Essential

Pressure gauge 2

Monitor changes in water pressure before the injection point

Practical

Injection point (Mazzi- or Dosatron-type (Figure 2)

Inject the dye in the system. Use a 1:50 to 1:100 dilution rate. Insert weight and a filter at the end of the suction line.

Essential

Pressure gauge 3

Monitor changes in pressure at the furthest point of the system.

Practical

Table 3. 

Sample data collection form for recording the effect of drip tape and irrigation length on water movement.

Operating time (hour)

Drip tape (Manufacturer, flow rate, emitter spacing)

No. of drip tape/bed

Total water applied1 (gallon/100 ft)

Depth2

(in)

Width3

(in)

Length4

(in)

1

Tape A

1


Tape B

1


Tape B

2


2

Tape A

1


Tape B

1


Tape B

2


3

Tape A

1


Tape B

1


Tape B

2


4

Tape A

1


Tape B

1


Tape B

2


6

Tape A

1


Tape B

1


Tape B

2


8

Tape A

1


Tape B

1


Tape B

2


1 Total water applied (in gallon/100ft) may be calculated by multiplying drip tape flow rate (gallon/100ft/hr) by operating time (hr) by number of drip tapes per bed. Total water applied may also be read from the water meter.

2 Depth can be measured on both the longitudinal and transverse section of the bed. Depth is the distance between the bed surface and the deepest dye. Depth may be limited by the presence of an impermeable layer

3 Width can be measured only on the transverse section of the bed. Width is the greatest distance between the sides of wetted zone below an emitter. Width is limited by bed width.

4 Length can be measured only on the longitudinal section of the bed. Length is the greatest distance between the sides of a wetted zone below an emitter. Length is limited by emitter spacing.

Table 4. 

Calculating, interpreting, important wetting characteristics and their application in irrigation scheduling.

Wetting characteristic

Measurement/calculation

Application in irrigation management

Maximum wetted width (Wmax)

Measured from dye pattern

Relative wetted width (%) = wetted width (Wmax, in inches) / bed width (in inches) x 100

In Florida's sandy soils, Wmax is typically 14 to 16 inches. Highest possible relative wetted width is needed to improve the efficiency of injected fumigants. Increasing irrigation time or volume in an attempt to increase wetted width will not work. Wetted width may only be increased by increasing bed compaction or increasing soil organic matter content. Relative wetted width may be increased by decreasing bed width.

Vegetable crops should not be seeded or transplanted outside the wetted width. When plants are small, irrigation should ensure that the wetted front reaches the plants or the seeds.

Shortest time for emitter-to-emitter coverage

Measured from dye pattern

In Florida's sandy soils, complete emitter-to-emitter coverage typically occurs in 1 hr for 4-inch emitter spacings and 2 hours for 8 and 12-inch emitter spacings. Complete emitter-to-emitter coverage provides water uniformly and contributes to crop uniformity.

Time when water depth becomes greater than the root zone (Figure 4)

Measured from dye pattern

Most important wetting parameter from nutrient leaching and water savings standpoint. Adequate irrigation management does not use irrigation events resulting in the waterfront moving below the bottom of the root zone. In Florida sandy soils, a soil section 1 foot wide, 1 foot deep and 100 foot long can typically hold 30 gallons of available water.

In fields without an impermeable layer, water moves vertically until it reaches the water table. The risk of nutrient leaching is high. When vegetable crops need large amounts of water that may result in nutrient leaching, irrigation should be split into two or three 2-hr events during the same day.

In fields with an impermeable layer, water moves laterally once it reaches the impermeable layer. It then moves horizontally by gravity and vertically by capillarity. The entire field may be wetted, and nutrients may move between the rows. Irrigation has to be a compromise between providing moisture to the entire field and off-site water and nutrient movement.

Publication #HS980

Release Date:December 10, 2021

Related Experts

Hochmuth, George J.

Specialist/SSA/RSA

University of Florida

Simonne, Eric H.

Specialist/SSA/RSA

University of Florida

Hochmuth, Robert C.

Specialist/SSA/RSA

University of Florida

Dukes, Michael D.

Specialist/SSA/RSA

University of Florida

Olson, Stephen M.

Specialist/SSA/RSA

University of Florida

Olczyk, Teresa

University of Florida

Related Topics

Fact Sheet
Commercial

About this Publication

This document is HS980, one of a series of the Horticultural Sciences Department, UF/IFAS Extension. Original publication date July 2004. Revised December 2021. Visit the EDIS website at https://edis.ifas.ufl.edu for the currently supported version of this publication.

About the Authors

Eric Simonne, professor and District Extension Director; David Studstill, research coordinator, Horticultural Sciences Department; Michael Dukes, professor, Department of Agricultural and Biological Engineering; John Duval, former assistant professor, UF/IFAS Gulf Coast Research and Education Center; Gene McAvoy, Extension agent IV, UF/IFAS Extension Hendry County; Teresa Olczyk, Extension agent IV, UF/IFAS Extension Miami-Dade County; Steve Olson, retired professor, UF/IFAS North Florida Research and Education Center; and Elizabeth Lamb, former assistant professor, UF/IFAS Indian River Research and Education Center; UF/IFAS Extension, Gainesville, FL 32611.

Contacts

  • Guodong Liu