Introduction
The Everglades Watershed
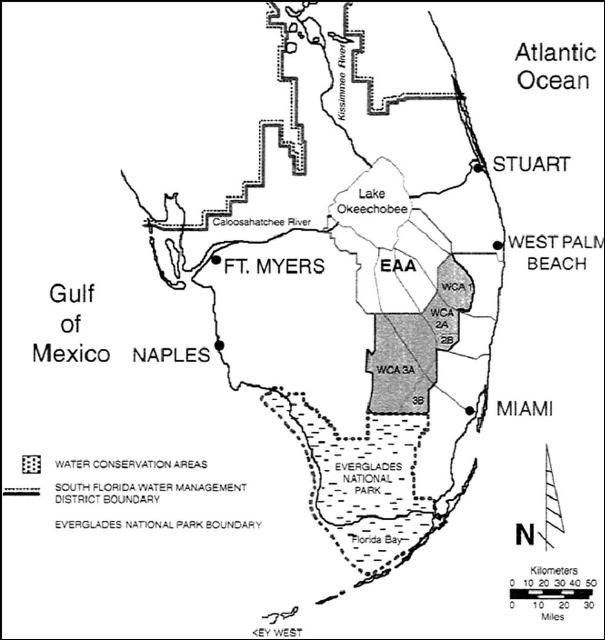
The South Florida Everglades, a natural resource unique in the United States, has been the focus of ecological concern for more than a century. The original Everglades watershed (Figure 1) was a broad, freshwater marsh that extended from what is now the Kissimmee River basin, through Lake Okeechobee, to the southern tip of the Florida peninsula. The basin included some 20,000 km2 of upland and wetland territory. The historic flow, arising from a nearly flat land slope of five to 15 cm/km, was at very low velocity from north to south along a riverbed that was often 80 to 100 km wide. The ultimate discharge was into the waters surrounding the southern tip of Florida (Jones, 1948). Starting in the late 1800's large portions of the original Everglades were channelized and drained for development. Currently, there are more than 2,500 km of major canals and levees supporting industry, municipalities, and agriculture. The Everglades Agricultural Area (EAA) is a part of this region.
The Everglades Agricultural Area as a Source of Phosphorus Nutrient
The EAA (Figure 1) is located south of Lake Okeechobee. The soils of this 280,000 ha region are predominately Histosols underlain by marl and limestone. Approximately 200,000 ha are planted to sugarcane and about 40,000 ha are planted to vegetables, rice, and sod (Izuno et al., 1991).
Farm water management is achieved using open field ditches to control water tables. Rainfall is highly seasonal and frequently intense. Virtually all drainage is by pumping with high volume pumps. Flows in the drainage/irrigation networks can undergo extreme variations, going from stagnation to maximum flow in short periods. Most drainage water from the EAA is ultimately discharged to the Water Conservation Areas (WCAs), Everglades National Park (ENP), or the South Florida coastal estuaries.
The agricultural drainage is nutrient-enriched compared to the original flows in which the Everglades evolved. This enrichment, specifically phosphorus (P), is cited as one of the causes of ecosystem changes in the WCAs and the ENP (LOTAC, 1990; Whalen et al., 1992). Current remediation plans require implementation, by area growers, of Best Management Practices (BMPs) to reduce phosphorus discharge to the drainage canals of the EAA and the construction of numerous managed wetlands within the EAA for treatment of the phosphorus remaining after discharge from EAA farms.
Phosphorus is present in two forms: the dissolved form (orthophosphate and soluble organics), and the particulate form (minerals and particulate organics). Total phosphorus (the sum of the dissolved and particulate fractions) is determined by acid digestion of a sample containing both forms of phosphorus to convert all phosphorus to orthophosphate, followed by analysis of the digested solution for orthophosphate. Filtration of the sample removes the particulate phosphorus, digestion and analysis of the filtered solution gives the fraction of total phosphorus present in the dissolved form. Particulate phosphorus is determined as the difference between total and dissolved phosphorus.
BMP's for the reduction of dissolved phosphorus have received considerable attention. The primary sources for dissolved phosphorus are soil mineralization and fertilizer application. Mineralization of the organic soils of the EAA is accelerated by excessive draining, which exposes the subsoil to aerobic conditions, causing oxidation and solubilization of organically bound phosphorus. A number of management practices have been implemented by the EAA growers to control water tables and reduce the opportunity for fertilizer-sourced phosphorus to reach the waterways (Bottcher et al., 1995). These practices have been successful in reducing the movement of dissolved phosphorus off the farms, but they do not, in all cases, address the discharge of phosphorus in the particulate form.
The purpose of this document is to emphasize that the sources of particulate phosphorus in the EAA are different than those that may prevail in upland systems. Particulate phosphorus in the EAA is, for the most part, sourced from the plant biomass that is continually growing in the farm drainage canal systems.
Particulate Phosphorus Sources
Contribution to Total Phosphorus Loads by Particulate Phosphorus
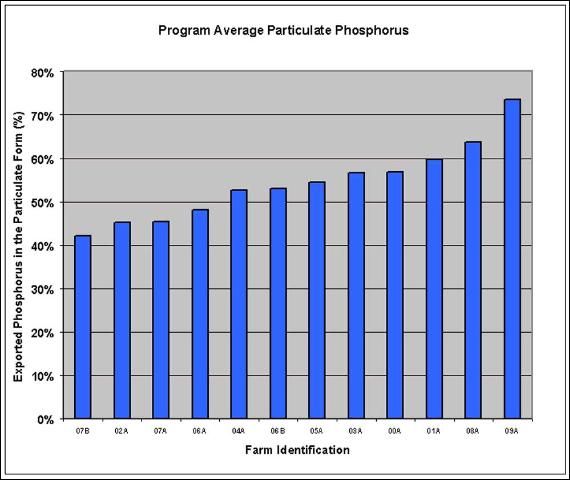
The magnitude of particulate phosphorus (PP) export was demonstrated by Izuno and Bottcher (1991) who showed that 20%–70% of the phosphorus exported from a collection of trial plots was in the particulate form. Further studies (Izuno and Rice, 1999) showed that particulate phosphorus accounted for a large fraction of the total phosphorus (TP) exported from EAA farms, and that particulate phosphorus export was frequently the cause of spikes in TP loads. Figure 2 shows the average fraction of exported phosphorus that was in the particulate form for twelve farm discharge locations monitored in the EAA during a five-year period. The location averages ranged from 42% to 74%, the overall average was 54% particulate phosphorus. It is clear from this illustration that particulate phosphorus is an important contributor to the overall phosphorus load from EAA farms.
Historical Approach to Particulate Phosphorus Control
The original approach to particulate phosphorus control was based on the assumption that the source of the particulate matter was erosion from overland flow in the fields and erosion from canal banks. Control practices were implemented based on the assumptions that traditional methods of runoff control, bank protection, and bed load retention with sediment traps would be effective. Several EAA studies have evaluated the effectiveness of traditional runoff control and sediment trap technologies (Andreis, 1993; Hutcheon Engineers, 1995) to reduce particulate phosphorus loads. These studies were either inconclusive, or showed the traditional methods to be ineffective, indicating that the original assumptions may have been incomplete.
Current Approach to Particulate Phosphorus Control
Stuck et al. (2001) studied farm-scale particulate phosphorus transport, and proposed an alternative mechanism for export from EAA farms. They showed that the mass fraction of phosphorus in exported suspended solids was typically much higher than that of farm soil or field litter, and that the chemical characteristics of the exported suspended solids more closely resembled those of aquatic flora than those of farm soil. They concluded that the majority of particulate phosphorus in the EAA originates from in-stream biological growth rather than from soil erosion, and proposed that the major contribution to particulate phosphorus discharge is the "Biological Contribution Mechanism."
Biological Contribution to Particulate Phosphorus
Using the Biological Contribution Mechanism concept, much of the discharged particulate phosphorus is recently deposited biomass, e.g. microorganisms and plant detritus. Reddy and DeBusk (1991) showed that detrital production from Eichornia crassipes (water hyacinths) could be as high as 15 grams per day per square meter of hyacinth mat. Exported solids may also be contributed directly by floating or suspended plants when loosely bound material is detached by turbulent shear forces. For example, studies by Stuck (1996) showed that from 29% to 38% of the total mass of Pistia stratiotes (water lettuce) could be dislodged by vigorous agitation.
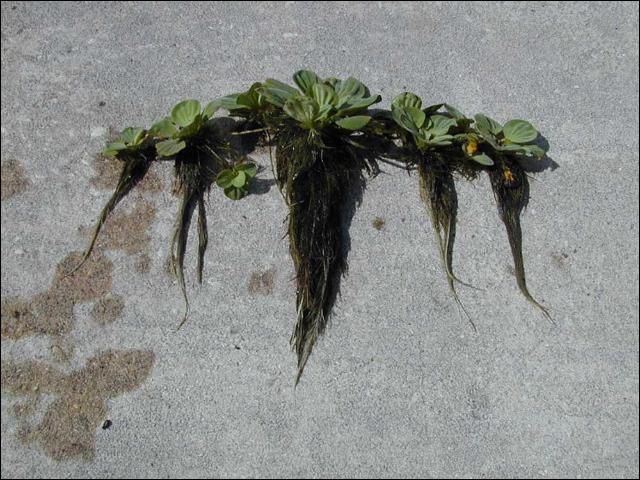
Figure 3 shows a photograph of the typical plant and root structure of Pistia stratiotes. The root structure can account for a large fraction of the total plant biomass, and may also provide an ideal location for growth of attached microorganisms (epiphytic growth). Engle and Melack (1990) studied mats of mixed aquatic weeds and found epiphyton concentrations as high as 146 grams per square meter of mat. They also found that up to 70% of the attached epiphyton could be detached by wind-driven movement of the mats, and that the population remaining on the roots regenerated itself completely with in 1–2 weeks.
In addition to floating aquatic weeds, contributions to particulate phosphorus are made by submerged aquatic plants and planktonic growth. The filamentous algae lyngbya is found in water systems throughout Florida. The conditions in the EAA canals of high pH and high temperature are favorable for the growth of lyngbya. Tubea et al. (1981) showed that lyngbya populations could exhibit doubling times of 0.8 to 2.0 days in favorable conditions. Stuck (1996) found that the field ditch surficial sediments in a representative EAA sugarcane farm contained approximately 15% by mass of readily identifiable lyngbya detritus.
Phosphorus Mass Fraction in Particulate Matter as a Biomarker for Particulate Matter Sources
The biomass accumulated in the farm canal system is heterogeneous. This biomass includes viable, growing plants ranging from single cell plankton to floating mats of aquatic weeds as well as plant detritus in various stages of decomposition and mineralization. The base sediment in the farm canals consists of compacted biomass from old plants, overlain by more recently deposited detritus and benthic growth.
Figure 4 shows the typical phosphorus mass fraction (mg P/kg dry mass) of a number of potential particulate phosphorus sources. Soil in the EAA typically has phosphorus mass fraction in the range of 750–1000 mg/kg. The base sediments in the farm canals typically have phosphorus mass fraction in the range of 900–2500 mg/kg. Detritus from the floating waterweeds is in the range of 1500–3500 mg/kg, while the plants themselves may have phosphorus mass fraction in the range of 3000–7000 mg/kg. The phosphorus mass fraction of the planktonic growth in the canals may be in the range of 9000–15000 mg/kg or higher. These phosphorus mass fraction ranges may be used as biomarkers to estimate the source of particulate phosphorus discharged from EAA farms.
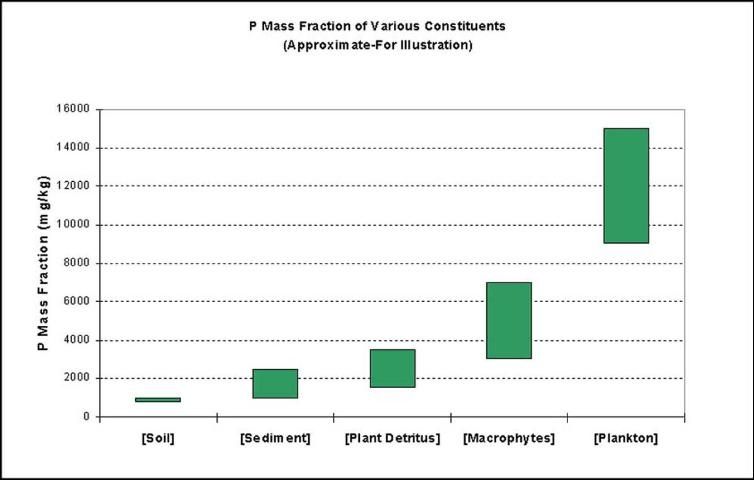
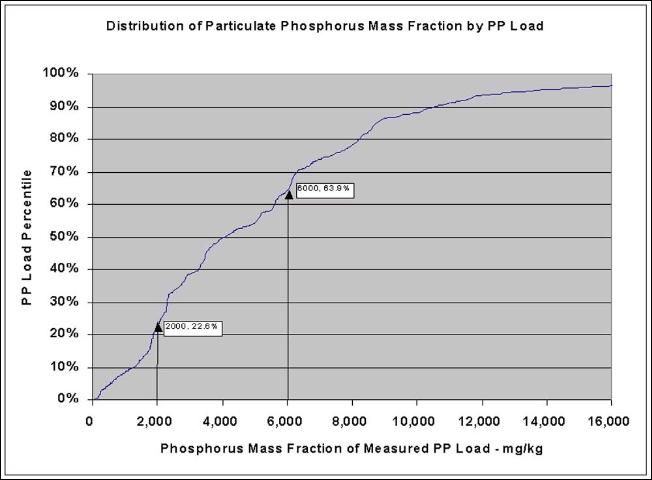
Figure 5 shows the cumulative distribution of the phosphorus mass fraction of samples of suspended solids discharged during a two-year span (Years 2000–2001) from a typical EAA sugarcane farm. This chart was constructed by ranking the phosphorus mass fraction of all measured loads in order of increasing phosphorus mass fraction and then determining the cumulative particulate phosphorus load as a fraction of the total particulate phosphorus load.
Estimation of Particulate Phosphorus Sources
The chart in Figure 5 may be used to estimate the relative contribution of various fractions of the discharged population. As an example, 22.6% of the total particulate phosphorus load discharged during the two-year time period had a phosphorus mass fraction of 2000 mg/kg or less, 63.9% had a phosphorus mass fraction of 6000 mg/kg or less. By difference, 41.3% (63.9% minus 22.6%) had phosphorus mass fraction between 2000 mg/kg and 6000 mg/kg. Using this difference method, a histogram can be constructed for the fractions that fall within specific ranges of interest.
Figure 6 shows the histogram for this example farm. Only 12.7% of the total particulate phosphorus load discharged during the two-year period of study had phosphorus mass fraction in the range of soil and mineralized sediment. About 33% of the total load had phosphorus mass fraction in the range of plant detritus and about 29% had phosphorus mass fraction in the range of plant viable plants. Finally, about 26% of the total load had phosphorus mass fraction in the range of planktonic material.
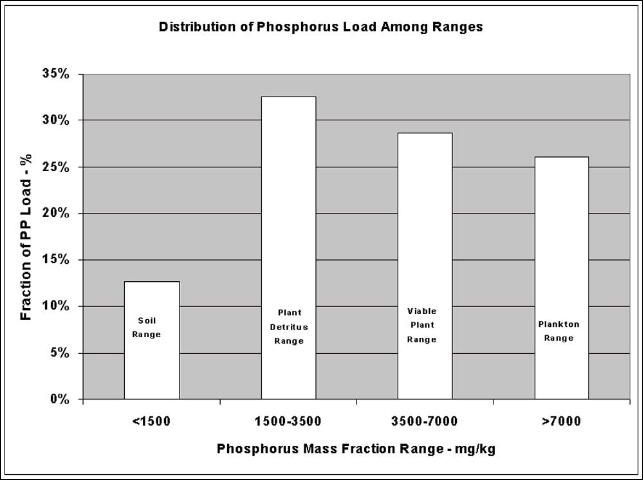
While this type of analysis does not definitively identify the sources, it is a good first approximation. This illustration indicates that the contribution to the particulate phosphorus load from soil and mineralized sediment was minimal, well less than 15%. Aquatic plants and their detritus appeared to contribute in excess of 60% of the total load. The remaining load, in excess of 25%, appeared to be sourced from high phosphorus-mass fraction planktonic growth. In this case, the predominant source of particulate phosphorus appeared to be aquatic plants and their detritus.
Aquatic Weed Coverage
Aquatic plants are ubiquitous in the EAA. Figure 7 shows a farm drainage canal completely covered by aquatic weeds. This situation is quite common on EAA farms, especially in the late spring to early autumn time period. These weed mats are mobile and move downstream as drainage pumping occurs.
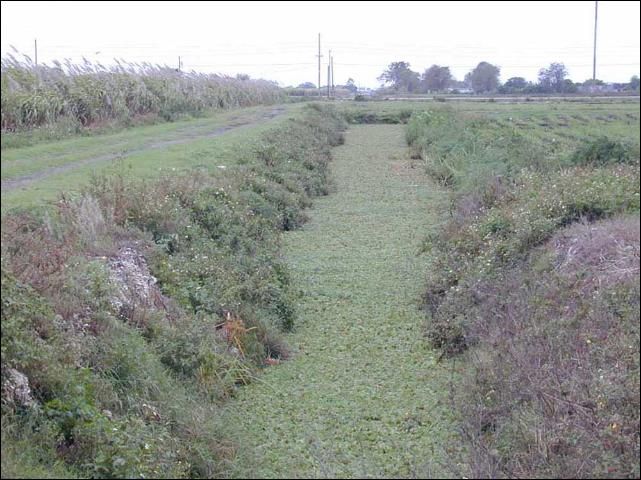
Aerial reconnaissance studies conducted on several representative farms in the EAA have shown that the aquatic weed coverage may average as much as 50% of the total drainage conveyance area on farms that do not practice weed control. On farms that practiced aggressive weed control, the coverage still averaged more than 20%.
Estimation of Phosphorus Inventory in the Aquatic Weed Mat
Representative samples were taken of the weed mats throughout the studies and estimates were made of the phosphorus inventory contained in the floating aquatic weed mats. For the same farm discussed earlier, the estimated inventory ranged from 45–130 kg of phosphorus and averaged 95 kg. The average annual particulate phosphorus load from this farm within the corresponding period was 158 kg. On average, 60% of the annual particulate phosphorus load was present in aquatic weed inventory at any time.
Reddy and DeBusk (1991) gave data that can be used to estimate aquatic weed detrital production. They estimated a peak detrital production of 15 g/m2/day for water hyacinth present at a density of about 900 g/m2. This estimate would give a daily rate of about 1.67% per day, or a turnover time of sixty days. At this rate, an inventory of 95 kg turning over every sixty days could produce ample detritus to supply an annual particulate phosphorus load of 158 kg, even allowing for mineralization and detrital burial.
Mobility and Concentration of Aquatic Weeds
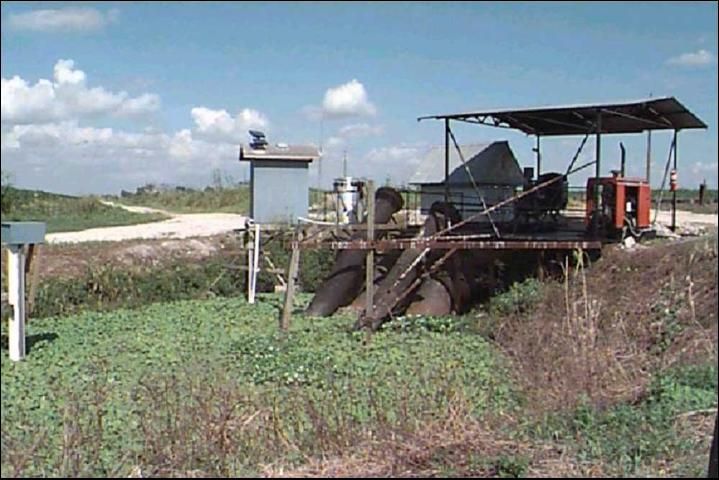
The weed mats are mobile and move with wind-driven currents and with irrigation and discharge flows. The primary contributor to aquatic weed mobility is certainly discharge flow, where the canal velocities are much greater than with wind driven or irrigation currents. The discharge flow tends to sweep the mats downstream, where they concentrate either at points of obstruction like culverts or, ultimately, at the pump station. Figure 8 shows a scene that is common in the EAA, where the aquatic weed mat has concentrated at the pump station. This site usually has the highest velocity and greatest turbulence level of any location in a farm canal system. Turbulence and high velocity are the conditions that will most promote disengagement, suspension, and mobilization of particulate matter, especially the light flocculent particulate matter associated with organic biomass. Clearly these conditions should be avoided.
Summary and Conclusion
The following points have been discussed:
- Approximately 50% of the total annual load of phosphorus from EAA farms is discharged in the particulate form.
- Traditional management methods relied on control of overland flow and bank erosion, and on the use of sediment traps in field ditches to contain eroded soil. Studies of these methods in the EAA have been either inconclusive, or have shown them to be relatively ineffective.
- More recently, the primary source of particulate phosphorus exported from EAA farms was shown to be the biological matter growing in the farm canals.
- This matter consists primarily of floating aquatic weeds, submerged aquatic growth, planktonic growth, and the detritus from the life cycles of these plants.
- An example of a typical EAA sugarcane farm was shown where less than 15% of the exported particulate matter appeared to originate from soil and mineralized sediment. Approximately 60% of the exported particulate matter had characteristics similar to aquatic plants and plant detritus, and about 25% had characteristics similar to single cell planktonic growth.
- Surveys have shown that, in the absence of aggressive weed control, there is ample inventory of floating aquatic weeds to supply the particulate phosphorus loads discharged by EAA farms.
- The aquatic weed system is mobile and will concentrate in regions where the conditions for detachment and mobilization are maximized.
The main reasons that traditional methods of sediment control are less effective in the EAA are that the sources of the transported material are not the same as they are in upland farms, they don't have the same physical characteristics as eroded upland soil, and the sources are located at different points in the drainage system than are seen in upland drainage systems. Table 1 gives a qualitative comparison of these characteristics.
Successful control techniques and management practices for reduction of particulate phosphorus export must recognize the nature of the sources and their inherent characteristics. These characteristics are significantly different from those of upland systems, and require management practices that address the highly mobile, distributed nature of EAA particulate phosphorus. The subsequent documents in this series address transport characteristics of particulate phosphorus in the EAA and offer some options for control of sources and transport.
References
Andreis, H. J. 1993. Best management practices for on-farm phosphorus reductions through sediment control. Presentation to the South Florida Water Management District. West Palm Beach, FL.
Bottcher, A. B., F. T. Izuno, and E. A. Hanlon. 1995. Procedural Guide for the Development of Farm-Level Best Management Practice Plans for Phosphorus Control in the Everglades Agricultural Area. Circular 1177. Gainesville: University of Florida Institute of Food and Agricultural Sciences. http://ufdc.ufl.edu/UF00014481/00001
Engle, D. L. and Melack, J. M. 1990. "Floating meadow epiphyton: Biological and chemical features of epiphytic material in an Amazon Floodplain lake." Freshwater Biology 23:479–494
Hutcheon Engineers, 1995. Sediment control demonstration project summary report. Report submitted to the Everglades Agricultural Area Environmental Protection District. West Palm Beach, FL.
Izuno, F. T., C. A. Sanchez, F. J. Coale, A. B. Bottcher, and D. B. Jones. 1991. "Phosphorus concentrations in drainage water in the Everglades Agricultural Area." J. Env. Qual. 20:608–619.
Izuno, F. T. and A. B. Bottcher. 1991. The effects of on-farm agricultural practices in the organic soils of the EAA on nitrogen and phosphorus transport. Final Project Report submitted to the South Florida Water Management District. West Palm Beach, FL.
Izuno, F. T. and R. W. Rice, Eds. 1999. Implementation and verification of BMPs for reducing P loading in the EAA. Final Project Report submitted to the Florida Department of Environmental Protection and the Everglades Agricultural Area Environmental Protection District. Tallahassee, FL.
Jones, L. A. 1948. Soils, Geology and Water Control in the Everglades Region. Agricultural Experiment Station Bulletin No. 442. University of Florida. Gainesville, FL.
Reddy, K. R and DeBusk, W. F. 1991. "Decomposition of water hyacinth detritus in eutrophic lake water." Hydrobiologia 211:101–109.
LOTAC. 1990. Lake Okeechobee Technical Advisory Council Final Report. Florida Department of Environmental Protection. Tallahassee, FL.
Stuck, J. D. 1996. Particulate phosphorus transport in the water conveyance systems of the Everglades Agricultural Area. Ph.D. dissertation submitted to the University of Florida Department of Agricultural and Biological Engineering, Gainesville, Fla.
Stuck, J. D., F. T. Izuno, K. L. Campbell, and A. B. Bottcher. 2001. "Farm level studies of particulate phosphorus transport in the Everglades Agricultural Area." Trans. ASAE 44(5):1105–1116.
Tubea, B., Hawksby, K., and Mehta, R. 1981. "The effects of nutrient, pH, and herbicide levels on algal growth." Hydrobiologia 79:221–227.
Whalen, P. J., J. VanArman, J. Milliken, D. Swift, S. Bellmund, D. Worth, T. D. Fontaine, L. Golick, and S. Formati. 1992. Surface water improvement and management plan for the Everglades. South Florida Water Management District. West Palm Beach, FL.