Introduction
Turfgrasses are used in urban areas to provide multiple benefits to society and the environment. They cover millions of acres of home lawns, commercial properties, roadsides, parks, etc. An important question is whether turfgrasses are properly managed. Many critics emphasize that turfgrasses demand too much urban water in a time when water resources are scarce. While indoor water use remains fairly constant throughout the year, outdoor water use increases during the spring and summer (DeOreo et al. 2016). Flattening the peak demand is an objective of water agencies (Beard and Kenna 2006), and better irrigation management may result in less fertilizer and pesticide use, which would be better for the environment.
Urban landscape irrigation is one of the largest growing water use sectors in Florida. The state’s water management districts have been working collectively to find ways to assist urban water users to irrigate more efficiently and to enhance planning and regulatory programs as ways to conserve water. There is adequate research information to make specific recommendations, such as the specific cultural practices or systems approaches that could be applied to decrease turfgrass water use. Those recommendations could be used immediately to conserve water and maintain turfgrass quality and its functional benefits to society.
The calculation of net irrigation requirements for turfgrass is essential for determining water allocation and can help scientists and irrigation managers to determine irrigation scheduling. This Net Irrigation Requirements for Florida Turfgrass Lawns series explains the process of estimating net irrigation requirements for Florida turfgrasses. The process used here gives a long-term (30-year) historical analysis of turfgrass monthly net irrigation requirements. The first article in the series explains how the weather data were gathered and checked for quality; the second article shows the calculation of evapotranspiration for selected sites throughout the state (plus one in Alabama, to cover the west side of the Florida Panhandle); and the third and final article outlines the results of the net irrigation estimation. Since Florida’s urban landscape water demand is expected to grow considerably over the next few decades, the use of current information in terms of turfgrass irrigation needs will provide urban irrigators with information to help them reduce the amount of water applied, conserve water, and reduce water bills.
Weather inputs needed to calculate reference evapotranspiration (ETo) or to estimate irrigation using a soil water balance include air temperature, solar radiation, wind speed, and precipitation. The accuracy of the calculated ETo depends on the quality of the weather data, which requires good quality control and assurance procedures in order to get accurate and representative ETo (Allen 2008). If some weather data are missing or erroneous, then it may be possible to estimate them in order to apply the ETo equation. For example, in situations where solar radiation, humidity, or any other weather parameter is missing for long periods of time, data can be taken from a nearby weather station (Allen et al. 2005). Allen et al. (2005) provide a series of equations for estimating missing values of humidity, solar radiation, wind speed, and maximum and minimum temperatures.
Objective
The objective of this study was to check the quality of 30 years of weather data at ten different locations in Florida and one in Alabama.
Gathering Meteorological Data
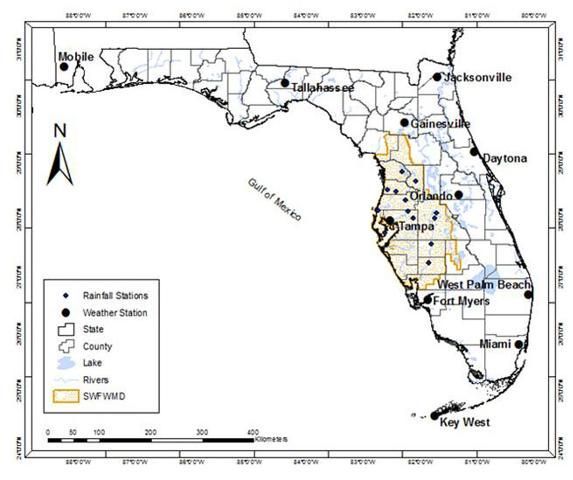
Daily measured meteorological data for a 30-year (January 1, 1980–December 31, 2009) period were gathered from 11 weather stations located at airports in major cities in or near Florida to represent climate conditions from the Panhandle down to south Florida (Figure 1). Additional rainfall data from 7 rainfall stations (Plant City, St. Leo, Hillsborough River State Park, Brooksville, Tarpon Springs, St. Petersburg, and Inverness) within the Southwest Florida Water Management District (SWFWMD) were used to provide rainfall spatial variability for sites within the district. Those sites within the SWFWMD were then used for soil water balances to estimate net irrigation requirements for turfgrass. Data for each weather station were obtained from the National Climatic Data Center (NCDC) (DOC 2009). Daily measured meteorological parameters included maximum and minimum temperature, average dew point temperature, average wind speed, and total precipitation. Daily average solar radiation values were estimated based on Hargreaves and Samani’s (1982) equation as presented by Allen (1997), which is based on temperatures and incorporates a correction factor (Kr) based on the regional location of each weather station:
Rs = Kr (Tmax – Tmin)0.5Ra
(Equation 1)
where Tmax and Tmin = mean daily maximum and minimum air temperature (°C), respectively, and Ra = extraterrestrial radiation. Allen et al. (2005) recommended using Kr = 0.16 for interior locations and Kr = 0.19 for coastal locations. Hargreaves and Samani (1982) defined an interior location as one with weather patterns dominated by a large landmass, whereas a coastal location was one with weather patterns dominated by close proximity to a large body of water.
The weather data were collected at airports that have substantial non-vegetative fetch and were prone to the heat island effect, which typically creates an arid or semiarid condition for the area. Because of these characteristics, all sites were checked for arid conditions. Sites can be considered arid if daily dew point temperature consistently deviates more than 3°C–4°C less than the daily minimum temperature (Allen 1996). If data from a site indicate that it is arid, the Simplified Aridity Adjustment can be used to correct air and dew point temperatures to reflect weather data collection under well-watered conditions (Allen 1996). To prevent aridity, measurements should be taken above an extensive surface of green grass that is uniform in height, actively growing, completely shading the ground, and adequately watered (Allen et al. 1998).
Credit: Consuelo Romero, UF/IFAS
Data Quality Check
Data quality checks were completed for air temperature, wind speed, dew point temperature, solar radiation, and rainfall. The measured data were checked for completeness and quality assurance. It is important that all data are screened, but it is particularly important that solar radiation data are accurate since this is the most sensitive input for the calculation of ETo under humid conditions (Irmak et al. 2006). Weather data were screened according to the following procedures as outlined by Allen et al. (2005):
- Weather measurements should be made at or converted to 2 m (6.6 ft) height.
- Average daily wind speeds should be between 0.89–2.23 m s-1 (2–5 mph).
- In a typical humid climate, solar radiation values should not exceed the clear sky solar radiation envelope.
- Scattered missing values were replaced by an average of the values from the day before and the day after.
- For longer periods with missing values, data from close weather stations were used to complete the corresponding information.
Results
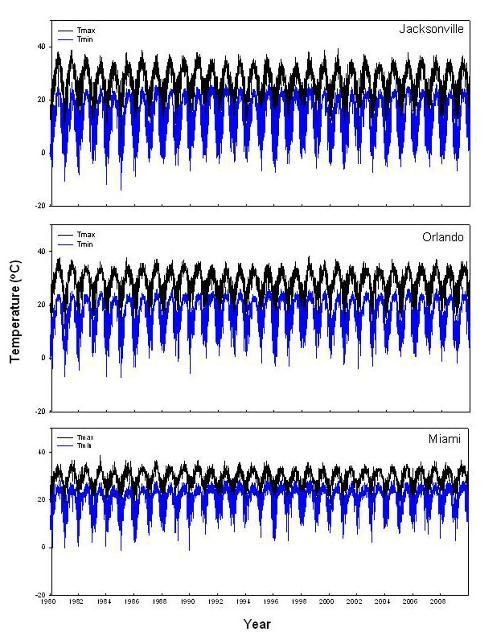
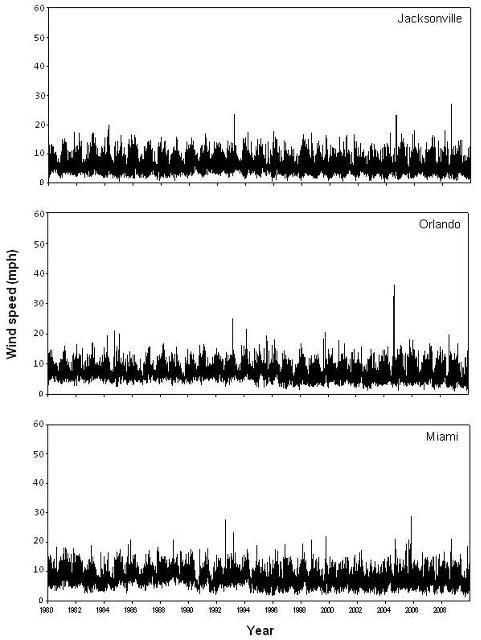
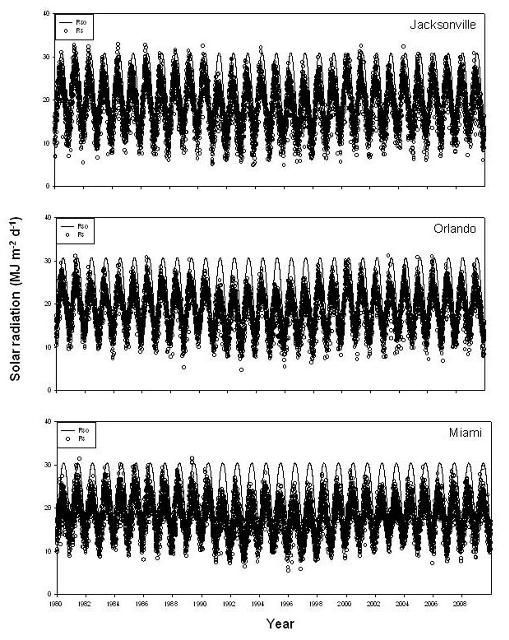
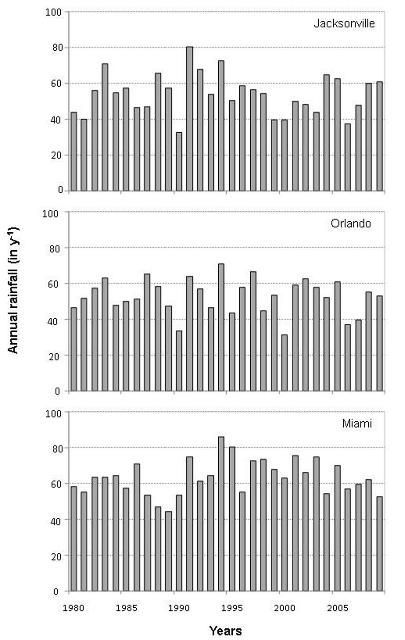
Records of 30 years (1980–2009) of meteorological data for Daytona, Fort Myers, Gainesville, Jacksonville, Key West, Miami, Orlando, Tallahassee, Tampa, and West Palm Beach, as well as Mobile, Alabama, were obtained from NCDC (DOC 2009) (Table 1). This 30-year climatological normal period (as defined by the National Weather Service) was selected because it was the most current group of consecutive years made available through NCDC that included all of the meteorological parameters needed to estimate ETo at all of the chosen locations. The data quality check showed that less than 0.01% of the total data for most meteorological parameters were missing. The percentage of data missing for rainfall was around 1% of the total data, except for Fort Myers where the number of consecutive days with no rainfall data reached 1,078. In this specific case, rainfall data were taken from the Naples rainfall database to replace this gap (Table 2). Weather characteristics of the datasets are presented in Tables 3 and 4. Figures 2 through 5 show the results of three sites (Jacksonville, Orlando, and Miami) that were used as representative cities for north, central, and south Florida, respectively. Cities located near these representative cities showed similar trends when analyzing the different meteorological parameters.
Analysis of Meteorological Parameters
Air Temperature
Daily maximum and minimum temperatures were plotted against the day of the year (Figure 2). There were no obvious erroneous daily temperature values. For all locations, the mean daily maximum temperature for the 30-year period ranged from 25.9°C (78.5°F) in Mobile to 29.2°C (84.6°F) in Miami. Mean daily minimum temperature ranged from 12.9°C (55.3°F) in Tallahassee to 22.6°C (72.6°F) in Key West.
Credit: Consuelo Romero, UF/IFAS
Wind Velocity
Average daily wind speed (U2) was plotted against day of the year (Figure 3). During the quality control screening procedures, it was found that the average wind speed at all sites exceeded the threshold for concern of 5 mi h-1 (Allen et al. 1998) at least 50% of the time as seen in Figure 3. Through detailed investigation of the sites, including photos of the stations, it was determined that the wind velocity was measured at 32 ft height, excluding Fort Myers and Tampa, which were measured at 26 ft height. Wind velocity data for all sites were adjusted to 6.5 ft accordingly by standard methods (Allen et al. 1998). Mean daily average wind speed at 6.5 ft for the 30-year period ranged from 4.2 mi h-1 in Tallahassee to 7.7 mi h-1 in Key West. Weather stations located closer to the coast had higher wind speeds than those located toward the interior.
Credit: Consuelo Romero, UF/IFAS
Solar Radiation
Estimated daily average solar radiation (Rs) and the computed clear sky solar radiation (Rso) were plotted against the day of the year (Figure 4). Daily values of Rso were calculated as a function of the station elevation extraterrestrial radiation (Ra, the amount of solar radiation received at the top of the earth’s atmosphere) using the procedures given by Allen et al. (1998). Solar radiation appeared reasonable and generally did not exceed the Rso envelope as recommended by Allen et al. (1998), and the relationship between the two variables showed similar trends throughout the years. All locations, except Key West and Orlando, had no more than five Rs values that exceeded Rso. Since the Rs data values were derived from air temperature, a significant difference between minimum and maximum temperatures in a day would cause these high Rs values. These temperature differences could be due to very clear sky conditions, resulting in higher air temperatures during the day and relatively lower air temperatures during the night (Allen et al. 2005). Mean daily average Rs ranged from 17.9 MJ m-2 d-1 in Miami to 20.0 MJ m-2 d-1 in Fort Myers.
Credit: Consuelo Romero, UF/IFAS
Dew Point Temperature
In a humid climate, Tdew (dew point temperature) should equal Tmin most days. For arid or semiarid regions, a difference of 2°C–4°C is typical (Allen et al. 2005). Although Tdew deviated more than 3°C–4°C from Tmin on some days for all sites, the long-term (30 years) daily average difference between Tmin and Tdew was less than 3°C for all sites (Table 4). This demonstrates the presence of very humid periods in Florida.
Rainfall
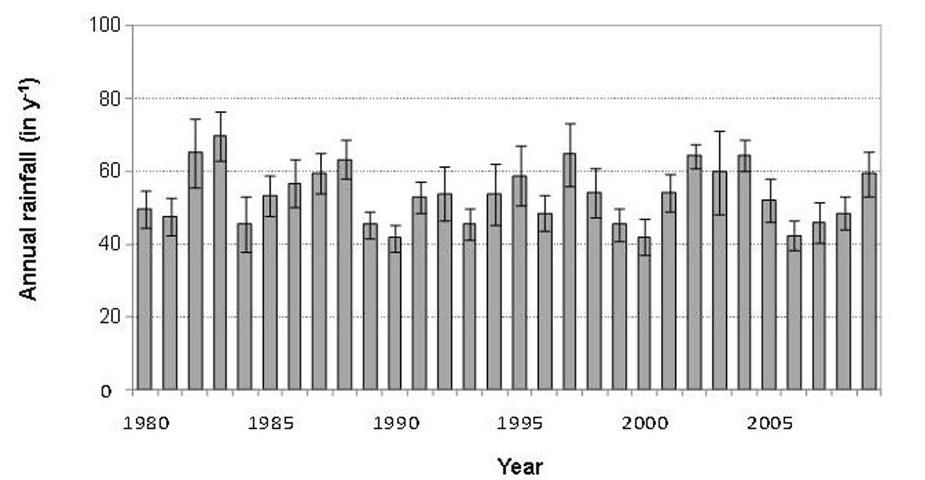
Cumulative annual rainfall was plotted against the year (Figure 5). For all locations, average annual rainfall for the 30-year period ranged from 41.7 inches in Key West to 69.6 inches in Mobile. The average annual rainfall for the 7 rainfall stations within the SWFWMD was 52.8 inches. Error bars in Figure 6 represent the variability within these 7 rainfall stations.
Credit: Consuelo Romero, UF/IFAS
Credit: Consuelo Romero, UF/IFAS
Summary
Thirty years of meteorological data for ten sites in Florida and one in Alabama were evaluated using quality check procedures to show that both measured and calculated data are reasonable. The percentage of missing values was very low for maximum and minimum temperature, and the percentage of missing values for dew point was around 0.01%. The percentage of missing values for rainfall was 0.6% for most locations except Fort Myers, which had almost 10% of missing rainfall data.
In the two following Ask IFAS publications in this series, reference evapotranspiration (ETo) is calculated for the same locations using this corrected meteorological database (“Net Irrigation Requirements for Florida Turfgrass Lawns: Part 2—Reference Evapotranspiration Calculation” [https://edis.ifas.ufl.edu/publication/ae481]), which will then be used with rainfall and other inputs to create daily soil water balances to determine net irrigation requirements for turfgrasses in Florida (“Net Irrigation Requirements for Florida Turfgrass Lawns: Part 3—Theoretical Irrigation Requirements” [https://edis.ifas.ufl.edu/publication/ae482]).
Acknowledgments
The authors want to thank the Southwest Florida Water Management District (SWFWMD) for funding this research. We are also grateful to our four reviewers (K. Migliaccio, C. Martinez, M. McCready, and J. Tichenor) for their valuable comments to the manuscript.
References
Allen, R. G. 1996. “Assessing Integrity of Weather Data for Reference Evapotranspiration Estimation.” Journal of Irrigation and Drainage Engineering 122 (2): 97–106. https://doi.org/10.1061/(ASCE)0733-9437(1996)122:2(97)
Allen, R. G. 1997. “Self-Calibrating Method for Estimating Solar Radiation from Air Temperature.” Journal of Hydrologic Engineering 2 (2): 56–67. https://doi.org/10.1061/(ASCE)1084-0699(1997)2:2(56)
Allen, R. G. 2008. “Quality Assessment of Weather Data and Micrometeorological Flux – Impacts of Evapotranspiration Calculation.” Journal of Agricultural Meteorology 64 (4): 191–204. https://www.jstage.jst.go.jp/article/agrmet/64/4/64_64.4.5/_pdf
Allen, R. G., L. S. Pereira, D. Raes, and M. Smith. 1998. Crop Evapotranspiration: Guidelines for Computing Crop Water Requirements. Irrigation and Drainage paper no. 56 ed. Rome, Italy: United Nations Food and Agriculture Organization. https://www.fao.org/3/X0490E/X0490E00.htm
Allen, R. G., I. A. Walter, R. L. Elliot, and T. A. Howell. 2005. The ASCE Standardized Reference Evapotranspiration Equation. Reston, VA: American Society of Civil Engineers. https://doi.org/10.1061/9780784408056
Beard, J. B., and M. P. Kenna (eds.). 2006. Water Quality and Quantity Issues for Turfgrasses in Urban Landscapes. CAST Special Publication 27. Ames, Iowa: Council for Agricultural Science and Technology.
DeOreo, W. B., P. W. Mayer, B. Dziegielewski, and J. Kiefer. 2016. Residential End Uses of Water, version 2. Water Research Foundation. ISBN 978-1-60573-235-0.
Hargreaves, G. H., and Z. A. Samani. 1982. "Estimating Potential Evapotranspiration." Journal of Irrigation and Drainage Engineering 108 (3): 223–230. https://doi.org/10.1061/JRCEA4.0001390
Irmak, S., J. O. Payero, D. L. Martin, A. Irmak, and T. A. Howell. 2006. "Sensitivity Analyses and Sensitivity Coefficients of Standardized Daily ASCE-Penman-Monteith Equation." Journal of Irrigation and Drainage Engineering 132 (6): 564–578. https://doi.org/10.1061/(ASCE)0733-9437(2006)132:6(564)
United States Department of Commerce (DOC). 2009. National Climatic Data Center. Accessed February 1, 2024. https://www.ncei.noaa.gov
Table 1. Location and elevation of weather stations in Florida and Mobile, Alabama.
Table 2. Percentage (%) of missing values of total database. The total number of records per weather parameter was 10,950.
Table 3. Values of daily weather parameters (except for rainfall) for the 30-year period (1980–2009) of weather station data records.
Table 4. Daily average difference between minimum temperature and dew point temperature for the 30-year period (1980–2009) of weather station data records.