Introduction
All animals excrete waste in the process of metabolizing food into the energy, nutrients, and proteins they use for survival and growth. In fish, this primary metabolic waste product is ammonia.
In fish, the majority of ammonia is eliminated from the body primarily by diffusion through the fish’s gills into the water. Smaller amounts are excreted in the urine or across other tissues.
Fertilizers and the decay of uneaten feed and organic matter contribute to ammonia, but in most aquaculture or hobbyist systems, the digestion of the feed eaten by the fish is the primary source of the compound. The more feed a fish is fed, the more ammonia the fish will produce. However, even a starved fish will produce some ammonia.
Of all the water quality parameters that affect fish, ammonia is the most important after oxygen, especially in intensive systems. At low concentrations, ammonia causes stress and damages gills and other tissues. Fish exposed to low levels of ammonia over time are more susceptible to bacterial infections, have poor growth, and will not tolerate routine handling as well as they otherwise would. At higher concentrations, ammonia will kill fish, and many unexplained production losses have likely been caused by ammonia.
Ammonia accumulates easily in aquatic systems because it is a natural byproduct of fish metabolism. Because it is continuously excreted, producers and other fish owners must regularly measure ammonia and eliminate it from systems before it can accumulate and damage or kill fish. Additionally, ammonia may be present in source waters such as some municipal (city) or well waters.
Ammonia is colorless and, even at levels toxic to fish, odorless. Therefore, the only way for a producer or aquarist to know if ammonia is present is to test the water.
In water, ammonia exists in two chemical forms: un-ionized ammonia (NH3) and ionized ammonium (NH4+). The combined concentration of these two forms is called total ammonia or total ammonia nitrogen (TAN). The portion of the total ammonia in the un-ionized or ionized forms is affected primarily by pH and temperature and, to a lesser extent, salinity. The portion of un-ionized ammonia increases with increasing pH and/or temperature but decreases slightly with increasing salinity. It is important to know the portion of ammonia in the un-ionized form (NH3) because it is approximately 100 times more toxic to fish than the ionized (NH4+) form.
The Nitrogen Cycle
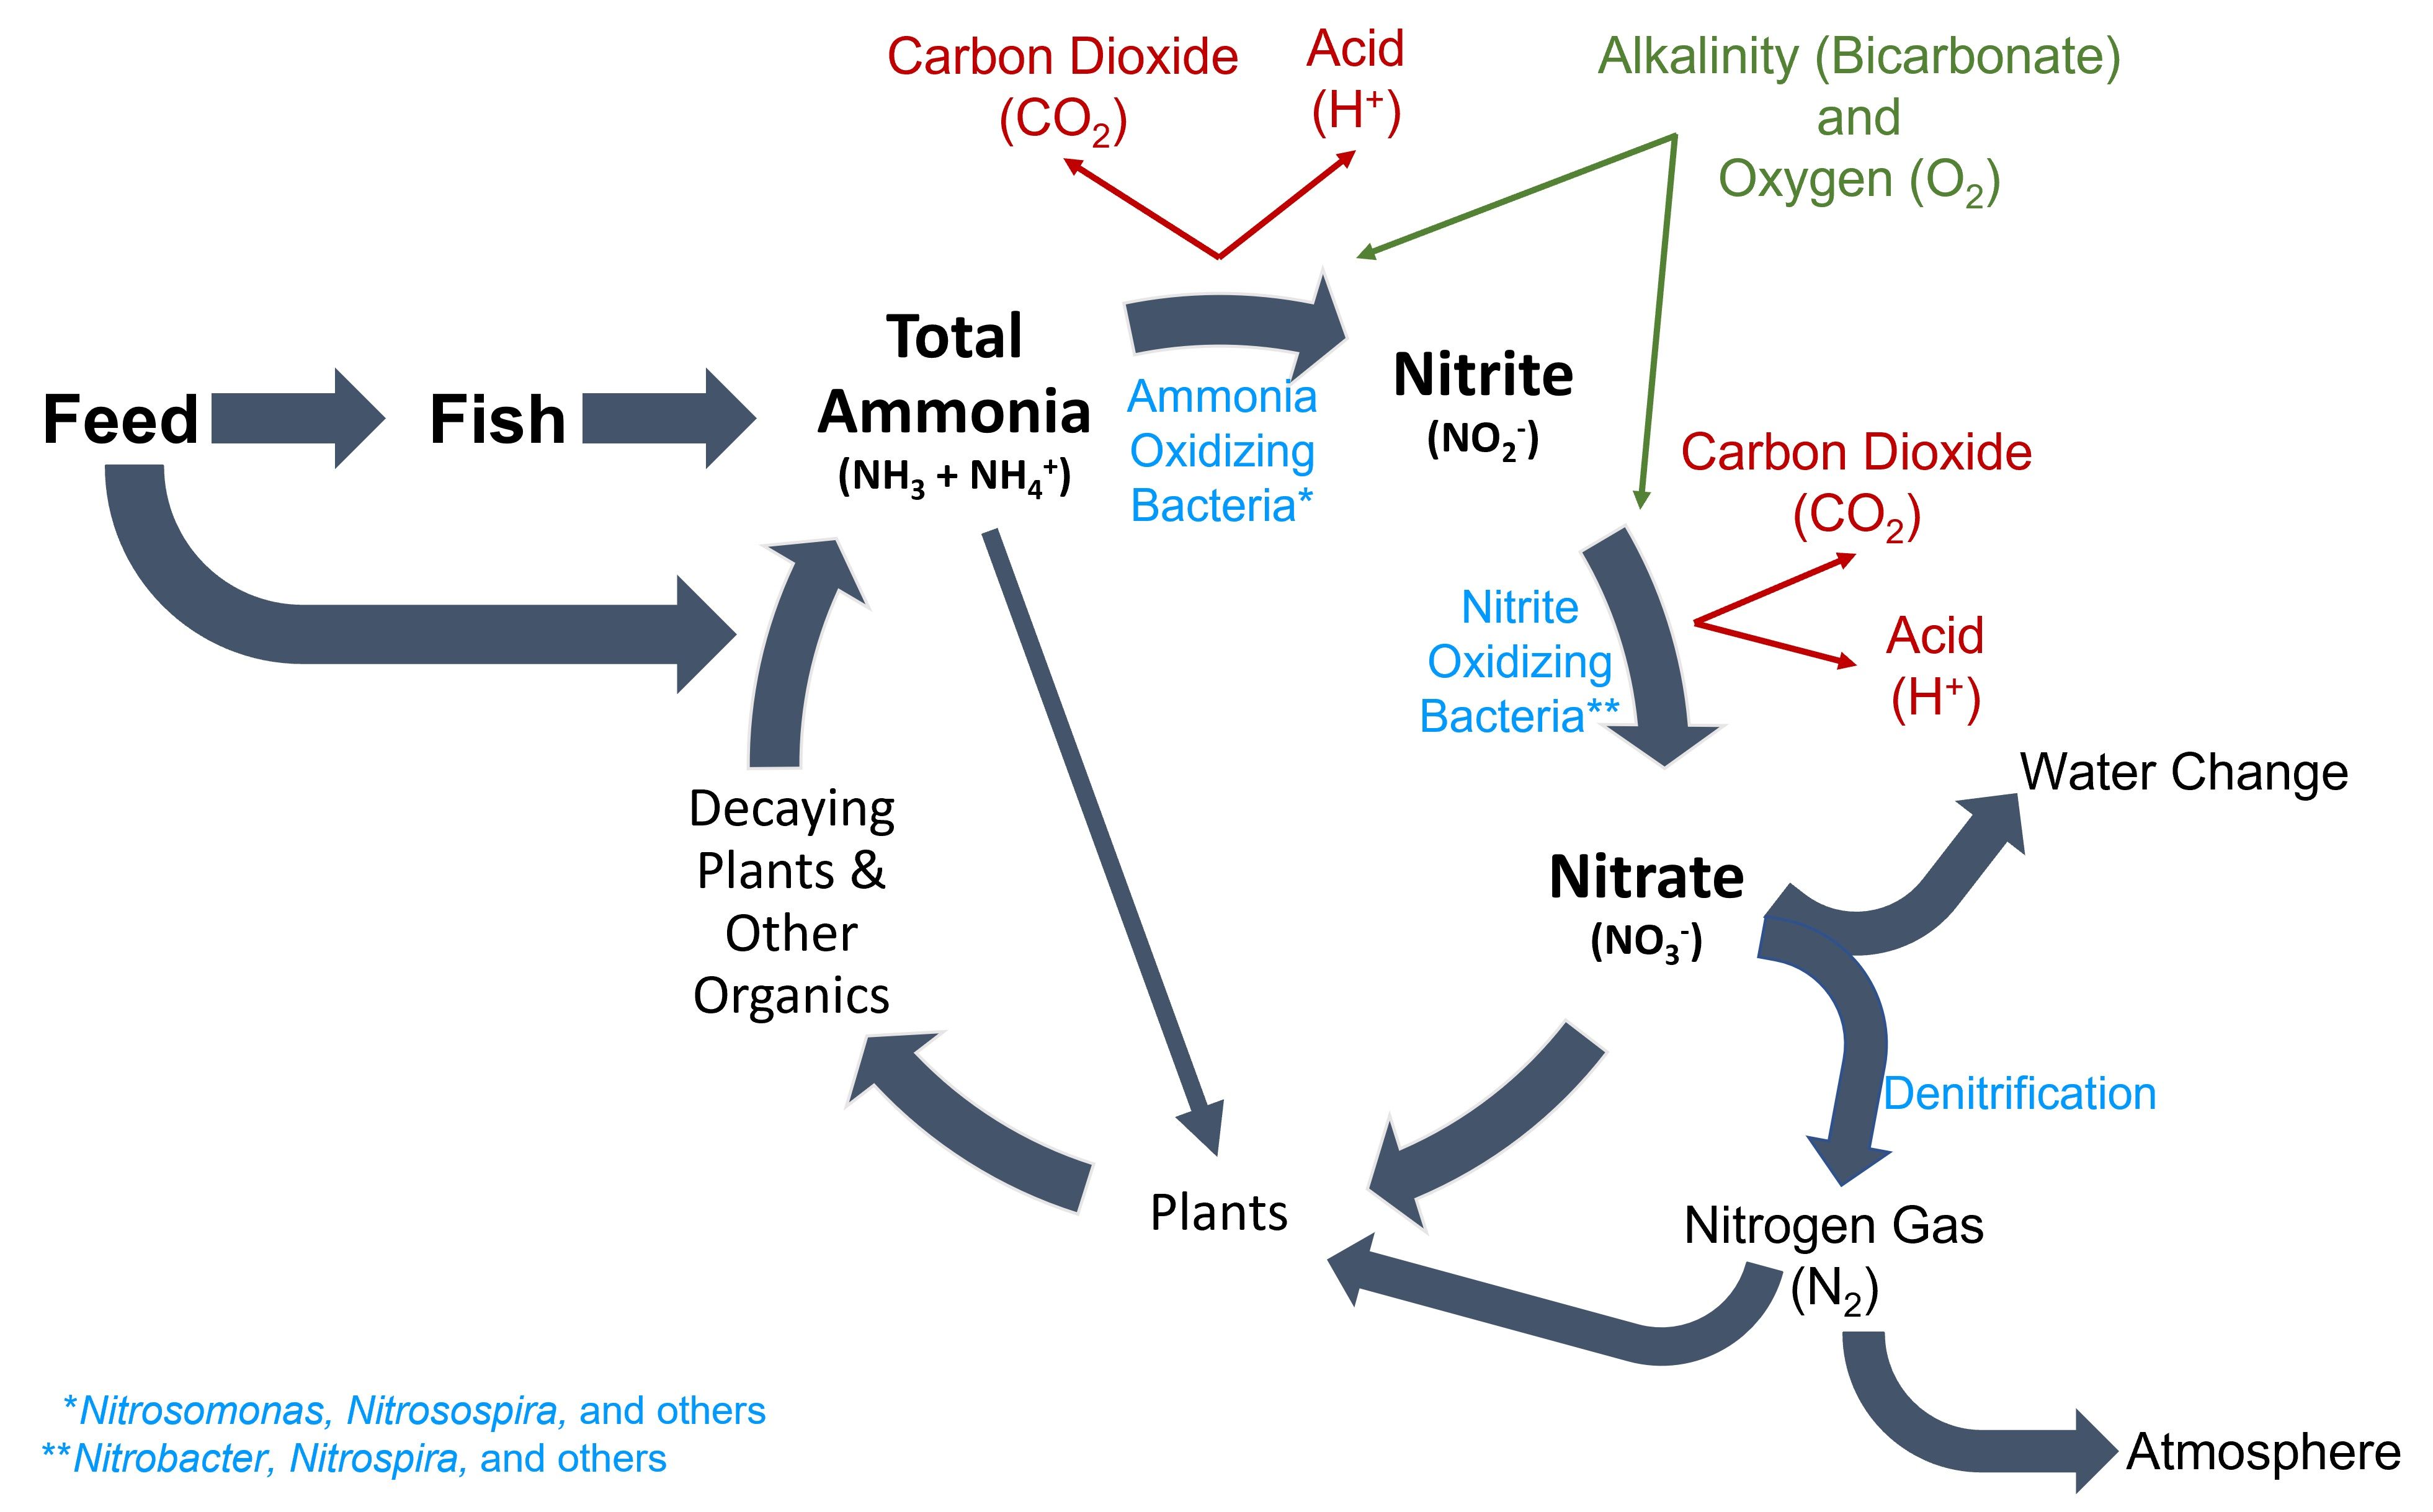
A biological process called the nitrogen cycle (or nitrification) eliminates ammonia from water by converting it to a less toxic compound through a series of reactions. The ammonia excreted by fish is converted to a compound called nitrite (NO2-) by several genera of bacteria, including Nitrosospira and Nitrosomonas. As a group, these bacteria are called ammonia-oxidizing bacteria (AOB). Other groups of bacteria, including Nitrospira and Nitrobacter (and collectively called nitrite-oxidizing bacteria [NOB]) convert nitrite to the much less toxic nitrate (NO3-). Nitrification is an aerobic (oxygen required) process that results in the production of carbon dioxide (CO2) and free hydrogen ions (H+), reducing the pH of the water unless sufficient buffers (alkalinity) are present.
In ponds, the nitrification process takes place on the surface layers of the mud/substrate and on plants or other structures where the nitrifying bacteria colonize. In tanks or aquaria, a biological filter (“biofilter”), must be provided as a place where the bacteria can colonize and flourish. A new biofilter requires six to eight weeks to build up sufficient bacteria to effectively reduce ammonia and nitrite levels.

Credit: UF/IFAS
Both groups of nitrifying bacteria (AOBs and NOBs) need oxygen and alkalinity to function. If oxygen levels are not sufficient, the bacteria can stop functioning or die, and ammonia and nitrite levels will increase. Alkalinity (primarily bicarbonate and carbonate) is also used by the nitrifying bacteria. Over time, alkalinity levels in water, particularly in recirculating tank systems, will decrease. At a total alkalinity less than 20 milligrams per liter (mg/L), common species of nitrifying bacteria do not function effectively. Additionally, once alkalinity is depleted, pH of the water can drop significantly and quickly, killing both f ish and nitrifying bacteria. This phenomenon is commonly referred to as “old tank syndrome,” though it may also occur in relatively newly established systems with naturally low-alkalinity water.
Nitrite is toxic to fish at levels as low as 0.10 mg/L. Traditionally, nitrate has been considered non-toxic to fish even at levels up to 200 mg/L. However, more recent research is showing nitrate may be more detrimental than previously believed. In natural systems and ponds, nitrate is taken up as a fertilizer by plants, including phytoplankton, so levels typically remain low. In closed systems with little or no water exchange, however, nitrate can accumulate to higher than 250 mg/L. Water changes or separate denitrification systems are needed to remove nitrate from recirculating system water.
Ammonia Testing
All aquaculturists and hobbyists should invest in a dependable water quality test kit. A good water quality management program will reduce fish disease problems, promote growth, and lessen the need for chemical treatments. A water quality test kit will pay for itself many times over, both in numbers of fish saved and increased production.
Most commercial ammonia test kits measure the total ammonia nitrogen (TAN) in milligrams per liter (mg/L), which is the same as parts per million (ppm). Again, it is the un-ionized ammonia (or UIA) portion of the TAN that is more toxic. To determine the UIA fraction from the TAN measurement, the temperature and pH of the water must also be known. At high temperatures and high pH, there is more UIA. Therefore, a good ammonia test kit will include a TAN test, a pH test, and a thermometer.
There are two common types of ammonia test kits, and each uses a different testing method to determine TAN. One is the Nessler’s method and the other is the ammonia salicylate method. If formalin or formalin-containing products have been used in the water within 24–72 hours, the Nessler’s method will result in a falsely elevated ammonia reading. Use of ammonia binding products and many “water conditioners,” such as those used in pre-treating municipal water sources, will also cause false high ammonia readings with the Nessler’s method. This method also produces false reactions when used to test seawater. The reagent used in the Nessler’s method contains a small amount of mercury that in many states must be disposed of as hazardous waste.
The other testing method is the ammonia salicylate method. This method is not affected by ammonia binding products or formalin treatments. The ammonia salicylate method is also more accurate than the Nessler’s method when testing ammonia in seawater.
When Should Ammonia Be Tested?
In general, ammonia should be tested once a week in any production system. Ammonia (and other water quality parameters) should also be tested immediately any time fish appearance or behavior changes (including reduced feeding).
If multiple tanks depend upon a common biofilter (i.e., a recirculating system), there is no need to check every tank individually. A good practice is to consistently test the ammonia level in the tank with the highest feeding rate and spot test other tanks from time to time. Although a system shares a common filtration system, there can be some differences in water quality between tanks. If fish show any signs of abnormality, water quality should be tested immediately in that individual tank.
Keep records for all tests and monitor trends. Whenever ammonia is found, increase the frequency of testing until the problem is corrected. As mentioned previously, whenever fish are sick, test the water quality immediately.
Ammonia is likely responsible for more unexplained losses in aquaculture than any other water quality parameter. Because it is colorless and odorless at levels toxic to fish, the only way to know if it is present is to test for it. Fish submitted to a diagnostic laboratory are often tested for infectious diseases (bacteria, parasites, fungi or viruses) only. Even if a water sample is submitted to the laboratory for testing, it provides only a one-time evaluation that provides no insight into past trends. It is the responsibility of producers and aquarists to regularly test the water quality, which is very often the underlying problem. Fish may become sick even weeks after a water quality problem has been corrected, so a single, lab-tested sample cannot be used to fully evaluate the water quality effect on a fish disease problem.
Interpreting the Ammonia Test
In healthy ponds and tanks, ammonia levels should always be zero. Presence of ammonia is an indication that the system is out of balance. Therefore, any ammonia in a pond or tank should alert the producer or aquarist to examine system management and to start corrective measures.
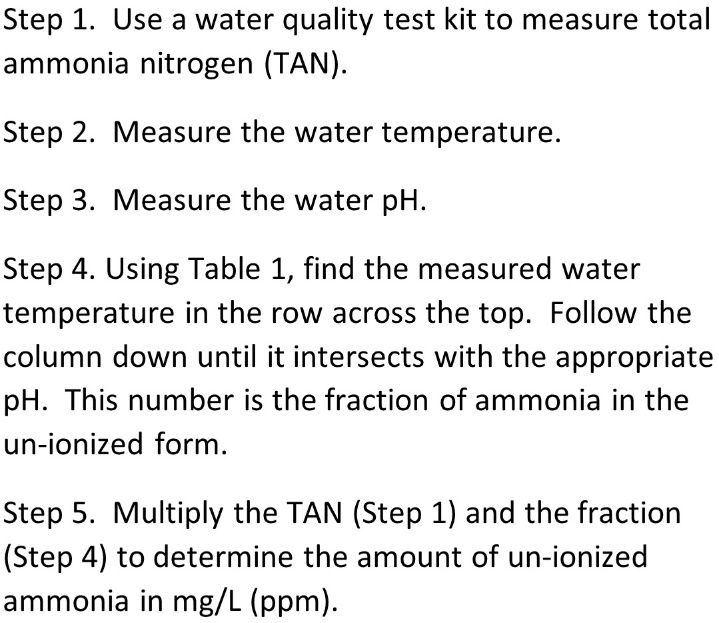
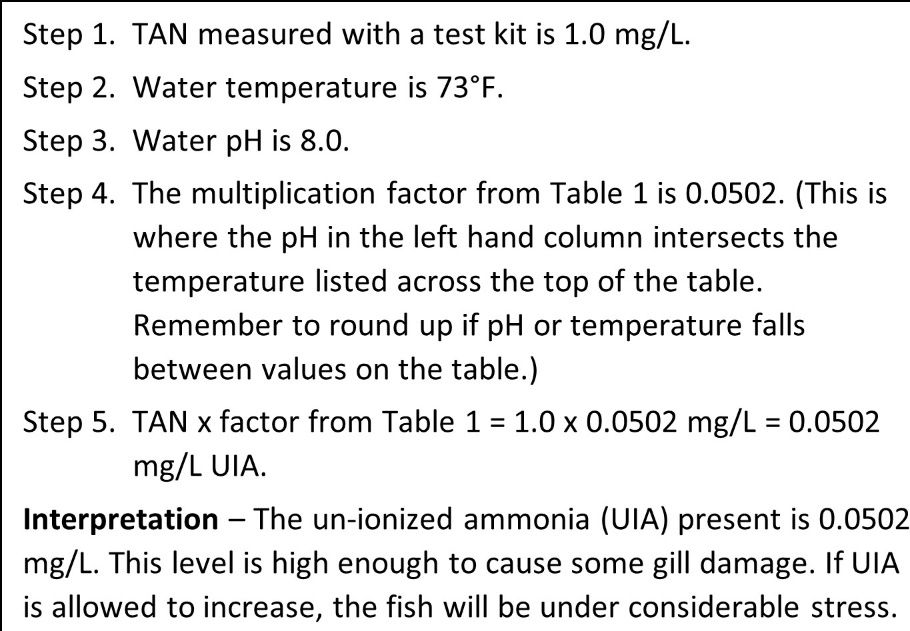
To determine UIA, three tests must be performed: TAN, pH, and temperature. Once these three parameters are measured, the fraction of UIA can be calculated using a multiplication factor found in Table 1. Find the measured temperature on the top row of the table and the measured pH in the left column. The number at which the appropriate column and row intersect in the table is multiplied by the measured TAN to give the UIA in mg/L. If temperature or pH falls between values on the table, round up to the next highest value to determine the “worst case scenario” because higher pH and temperature result in more UIA. This calculation is summarized in Figure 2, and an example is given in Figure 3.

Credit: undefined

Credit: undefined
Anytime the UIA is higher than 0.05 mg/L, damage to fish tissues can occur. As the concentration rises above 0.05 mg/L, it causes more and more damage. At 2.0 mg/L, sensitive fish will typically die. Even if fish do not die directly from high ammonia levels, they become more susceptible to infectious disease. Again, any ammonia indicates a problem in your system. If you find it, take corrective measures immediately.
Management of an Ammonia Problem
The first thing to do when ammonia is present in a pond or tank is to reduce or stop feeding. Fish may not eat during periods of ammonia stress, and the uneaten feed will only make the situation worse. Reducing or stopping feed for a short period of time (e.g., 1–3 days) will not typically have a negative effect on fish (except fry). Overfeeding is a major cause of high ammonia concentrations, and stopping the feeding will allow the nitrogen cycle to “catch up” with the nutrient load. A 25% to 50% water change will help remove some ammonia, assuming the incoming water source does not contain ammonia. This process is only feasible in tanks or very small ponds, so do not try to solve an ammonia problem in a large pond using this method.
Low levels of dissolved oxygen limit the ability of nitrifying bacteria to convert ammonia and nitrite, so it is important to monitor dissolved oxygen and take steps to increase oxygen if it falls below 5 mg/L
In ponds, the addition of a phosphate fertilizer may help to relieve high TAN levels over a period of days by stimulating phytoplankton growth, which helps remove ammonia from the system; however, it may not help quickly enough in an acute ammonia crisis. Use a 0–20–0 fertilizer at a rate of 40 pounds per acre. It is important not to use a fertilizer that contains nitrogen because nitrogen will add to the problem. If phosphorus is not a limiting factor for algal growth in the pond, the phosphate fertilizer method will not work at all. Similarly, if the pond already has a heavy phytoplankton bloom, fertilizer should not be added.
In tank systems, water changes and the use of ammonia-binding products can alleviate ammonia toxicity in the short term. However, for long-term management, it is best to establish a properly designed and sized biofilter.
In tanks without a biofilter, the producer or aquarist should strongly consider incorporating one. Given the six to eight weeks necessary to establish a biofilter, this will not help in a crisis, but it is a long-term solution to the problem.Biofilters should be sized appropriately according to feed input.
With the exception of high-flow raceways, such as those used in the salmonid aquaculture industry, many flow-through tank systems do not have sufficient flow to eliminate ammonia adequately, so testing and management of ammonia in these systems is still critical.
Some chemicals used to treat diseases in fish, especially antibiotics, can be detrimental to the nitrifying bacteria in the biofilter. Both ammonia and nitrite levels should be tested more frequently after applying a disease treatment to ensure that the biofilter is still functioning appropriately.
Summary
Ammonia is a major waste product of fish and is also produced as a breakdown of feed and other organics. It can accumulate in aquaculture or aquarium systems, where it will, at the very least, decrease production. It is frequently a stressor that leads to disease, and in other cases it kills fish directly. The only way to detect its presence is to test for it. A fish farmer or aquarist should invest in a dependable water quality test kit, learn how it works, and use it regularly.
Ammonia test kits only measure the total ammonia nitrogen (TAN). When this test indicates a reading above zero, producers or aquarists can determine the amount of the more toxic un-ionized ammonia (UIA) after measuring pH and water temperature. The multiplication factors are found in Table 1, and an example calculation is found in Figure 3. When ammonia is present, the fish in the system should not be fed (or feed should be reduced) until the problem is corrected. In small systems, a water change may help, and in large ponds, a 0–20–0 fertilizer may help.
Test for ammonia regularly and take corrective measures as soon as you detect it. Severe problems may occur when tests are not performed frequently enough. Even after an ammonia problem has been corrected, fish may become sick weeks later. Once fish begin to die, it is difficult to correct an ammonia problem without losing more fish.
Recommended
Fish Health Management Considerations in Recirculating Aquaculture Systems—Part 1: Introduction and General Principles (UF/IFAS Circular 120) https://edis.ifas.ufl.edu/FA099
Southern Regional Aquaculture Center publications, available at https://srac.tamu.edu/
Ammonia in Fish Ponds (SRAC Publication No. 463)
Nitrite in Fish Ponds (SRAC Publication No. 462)
Managing Ammonia in Fish Ponds (SRAC Publication No. 4603)
How to Start a Biofilter (SRAC Publication No. 4502)
Recirculating Aquaculture Tank Production Systems: An Overview of Critical Considerations (SRAC Publication No. 451)
Recirculating Aquaculture Tank Production Systems: Management of Recirculating Systems (SRAC Publication No. 452)
Recirculating Aquaculture Tank Production Systems: A Review of Current Design Practice (SRAC Publication No. 453)
Reference
Emerson, K., R. C. Russo, R. E. Lund, and R. V. Thurston. 1975. “Aqueous Ammonia Equilibrium Calculations: Effects of pH and Temperature.” Journal of the Fisheries Research Board of Canada 32:2379–2383.
Table 1. Fraction of un-ionized ammonia in aqueous solution at different pH values and temperatures. Calculated from data in Emerson et al. (1975). To calculate the amount of un-ionized ammonia present, multiply the total ammonia nitrogen (TAN) by the appropriate factor selected from this table using the pH and temperature from your water sample. See the example in Figure 3.