Introduction
Approximately 71% of the 400,000 acres of sugarcane in Florida is grown on organic soils in the Everglades Agricultural Area (EAA) (VanWeelden et al. 2021). Because the Everglades is a historically phosphorus (P)-limited system, P loads carried in EAA drainage water are an environmental concern (Bottcher, Tremwel, and Campbell 1995). The Everglades Forever Act (Florida State Statutes 1994) requires annual P loads in EAA basin drainage to be reduced by at least 25% annually relative to historic baseline trends documented in 1978-1988 basin drainage data (Whalen and Whalen 1994). The South Florida Water Management District requires Florida sugarcane growers to use best management practices (BMPs) designed to reduce P loads in farm drainage water in order to achieve the basin-level P load reduction targets (Rice, Izuno, and Garcia 2002). An important BMP growers use to meet part of the load reduction requirements is soil testing to determine the appropriate P fertilizer application rates (Daroub et al. 2018).
The Everglades Soil Testing Laboratory previously used water-extractable P (Pw) to make P fertilizer recommendations for sugarcane (McCray et al. 2019). Water-extractable P is a soil test developed primarily for short-season vegetable fertilizer recommendations in Florida (Forsee 1950). Most vegetable crops require higher levels of available soil P than sugarcane (Hochmuth et al. 2018), and these crops usually have a significantly shorter crop growing season. Sugarcane has a growing season of 8–16 months in Florida (typically more than 12 months for newly planted cane), so a soil test that includes water-extractable plus a measure of reserve P is an improvement over the water extractant (Glaz et al. 2000; Korndorfer et al. 1995). A substantial amount of work in recent years compares water to other extractants in an effort to update the soil test P calibration for sugarcane. Korndorfer et al. (1995) compared water, Mehlich 1, and 0.5 N acetic acid as P extractants and determined that acetic acid-extractable soil P (Pa) related best to sugarcane crop response. Andreis and McCray (1998) also developed a soil test calibration for sugarcane using the Bray 2 extractant. One limitation of the water extractant is its sensitivity to pH, with more P extracted at lower pH. Research with vegetables grown on organic soils in Florida indicates that the Mehlich 3 extractant performs satisfactorily over a wider pH range than water (Hochmuth et al. 2018). Mehlich 3 has been determined to be useful as a P extractant on a wide range of soil types (Hanlon and Johnson 1984; Tran et al. 1990) and has the advantage of potentially being used for extraction of other macro and micronutrients (Mehlich 1984).
A study examining the relationships of soil-extractable P with sugarcane tonnage and sugar yield was conducted at six locations of varying soil type and depth, with a total of 20 crop years (number of locations X number of crops at each location) (Table 1). As a result of that study, sugarcane P fertilizer recommendations for organic soils have been revised, based on the Mehlich 3 soil extraction method.
Sugarcane Response to P Fertilizer
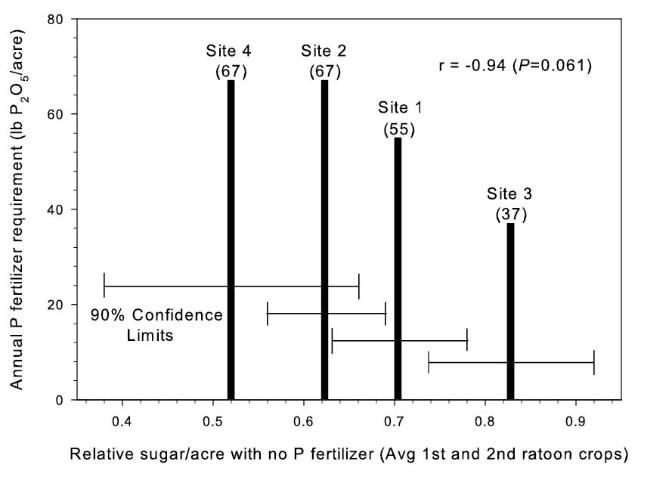
There were significant responses in tons cane/acre (TCA) to P fertilizer in 17 of 20 total crop years in the study (Table 2) (McCray et al. 2010). These included TCA responses across crop years at 5 of 6 sites, but site 6 only had a significant TCA response in the third ratoon crop. With banded P at sites 1–4, tons sugar/acre (TSA) responses to P fertilizer were similar to TCA responses. There were linear reductions in sucrose concentration (lb sugar/ton cane) at sites 1, 2, and 4 with increasing P rate, but at banded P rates < 36 kg P/ha (75 lb P2O5/acre) there was < 5% reduction in sucrose concentration compared with zero P (McCray et al. 2010). At sites 5 and 6, the influence of P rate on TCA and TSA did not differ among the sugarcane varieties, although at site 6 the influence of P rate on sucrose concentration varied among the varieties. Based on measured yield responses to banded P fertilizer up to 33 kg P/ha (67 lb P2O5/acre), McCray et al. (2010) determined that the maximum P fertilizer recommendation for Florida Histosols should be maintained at 36 kg P/ha (75 lb P2O5/acre). The annual P fertilizer requirement was determined to be inversely related to relative sugar yield without P fertilizer (Figure 1).
Extractable Soil P Related to Sugarcane Yield
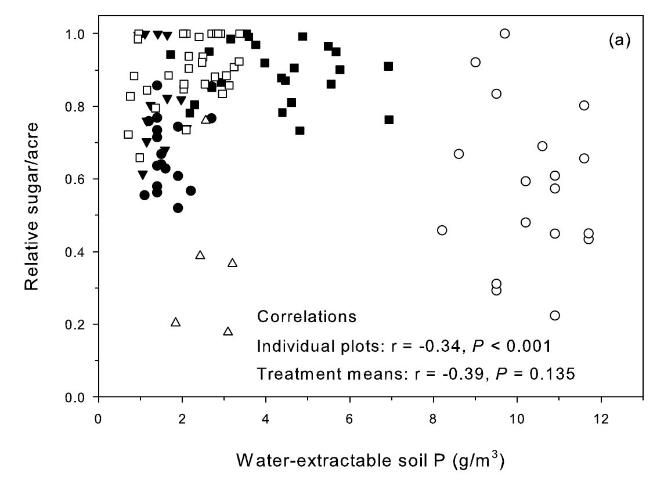
Relative sugar yield was used in the study to allow comparisons across crop sites and crop years that differed because of variation in soils, rainfall, and other growing conditions. Relative yield was determined by dividing the yield of a specific treatment (i.e., a single specific plot) by the highest yielding treatment present within the same replication of the experimental design. These relative yield calculations were performed separately within each replication for each specific crop year and study location. Relationships between relative sugar/acre without P fertilizer and extractable soil P in samples from the zero P treatment before each crop year were used to evaluate soil-test P extractants for prediction of yield response to P fertilizer (Figures 2 and 3) (McCray et al. 2012a). Decreasing relative sugar yield in these relationships indicates increasing response to P fertilizer. There was a negative correlation between relative sugar/acre and Pw (Figure 2a), which can be partially attributed to soil-test values ranging from 8 to 12 g P/m3 at Site 2 where there were strong TCA and TSA responses to P fertilizer all four crop years (Table 2). Phosphorus fertilizer was not recommended at Pw > 6.6 g P/m3 (Gascho and Kidder 1979), so no P fertilizer was recommended for site 2 using the Pw test. The Pw test tends to be undesirably influenced by soil pH, thus elevated Pw values at site 2 likely reflect its acidic (pH=4.8) soil properties (Table 1).
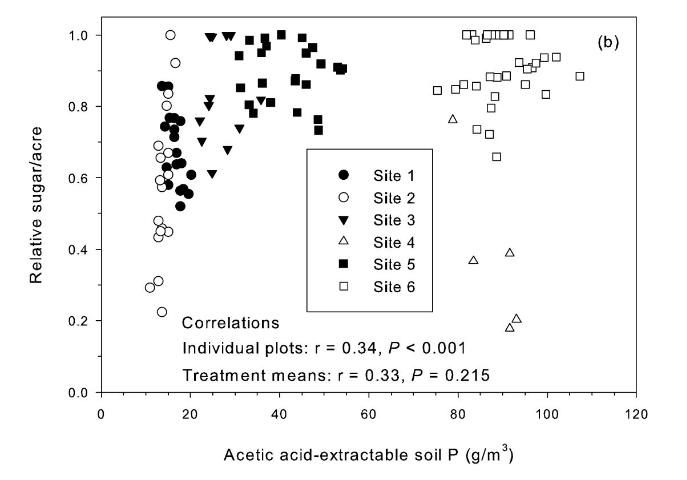
Correlation of relative sugar/acre and Pa was positive but not significant for treatment means (Figure 2b). The Pa soil test is potentially a useful test, except there was a strong TCA and TSA response at site 4 (Table 2) with pH 6.9 and Pa values > 80 g P/m3(Figure 2b). Korndorfer et al. (1995) proposed acetic acid as a replacement for water as a soil-test P extractant for Florida sugarcane. The "high" soil test category proposed by Korndorfer et al. (1995) was > 39 g P/m3, which was acceptable for five of the six test sites. However, the Pa test would not predict the yield response under the conditions of Site 4.
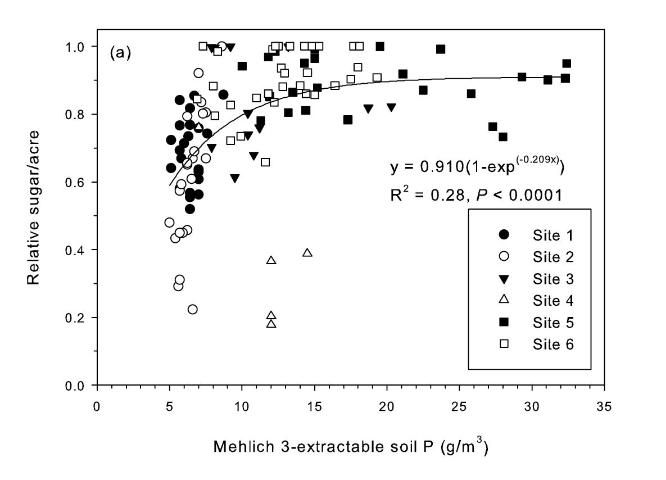
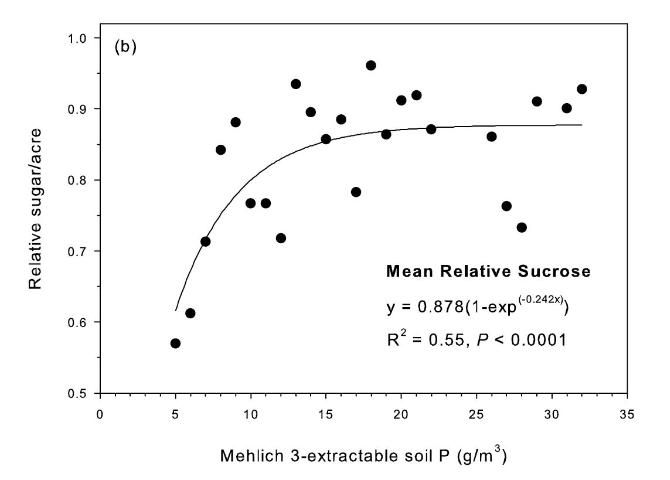
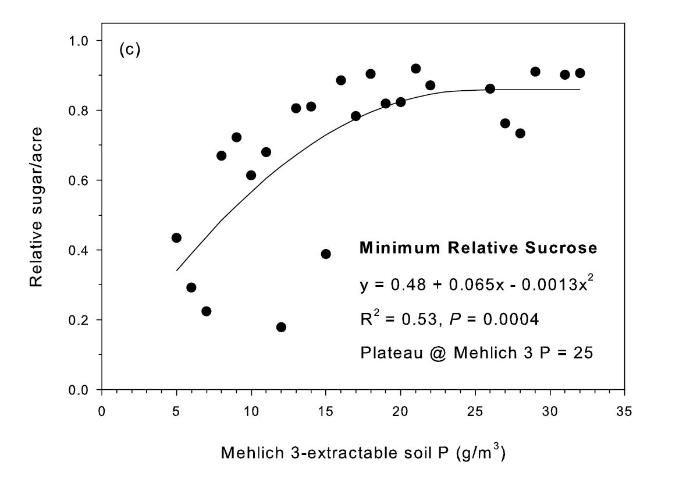
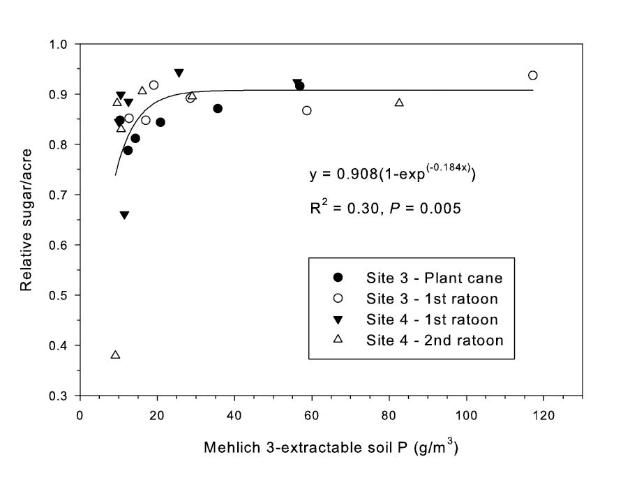
The strongest relationship between relative sugar yield and extractable P occurred using the Mehlich 3 extractant (Figure 3) (McCray et al. 2012a). There was an exponential relationship between pre-crop Mehlich 3 extractable P (Pm) and zero P relative sugar yield using individual zero P plots from each crop year of each site (Figure 3a). Mean relative sugar yield reached 99% of maximum for the exponential model at Pm of approximately 19 g P/m3 (Figure 3b), indicating that the probability of response to P fertilizer increases as Pm is decreased from 19 g P/m3. Relative sugar yield ranged as low as 0.22 (22%) at site 2 and as low as 0.18 (18%) at site 4 (Figure 3a). While relative yield for a given Pm value was measured at 1.00 with Pm > 7 g P/m3 (individual points in Figure 3a) in some instances, there were also minimum relative yield values < 0.50 with Pm < 15 g P/m3 (Figure 3c). The relationship of minimum relative sucrose with Pm is useful for ensuring that adequate P is available across the range of growing conditions in EAA soils. Minimum relative sugar yield reached a plateau at Pm of approximately 25 g P/m3 (Figure 3c). This indicates that there should be a low probability of sugarcane yield response to P fertilizer at Pm > 25 g P/m3. Also, although Pm values without P fertilizer application were all less than 35 g P/m3 (Figure 3a), there was no yield response beyond approximately 30 g P/m3 when Pm values were increased to over 100 g P/m3 in the banded row (Figure 4).
The reasons that the Mehlich 3 extractant works better than other extractants in predicting a sugarcane yield response to P fertilizer are demonstrated by the forms of soil P removed by each extractant (Table 3) (McCray et al. 2012b). The forms of soil P generally decrease in plant availability in the order of labile P, Fe-Al bound P, humic-fulvic bound P, Ca-Mg bound P, and residual P (Castillo and Wright 2008; Reddy et al. 1998). Water P only extracts labile P or the quickly available fraction, and so does not include any measure of reserve P that may become available through time. This illustrates why the water-extractable P test was developed for vegetables and not for long-term crops such as sugarcane. With water-extractable P there is also the problem of the large increase in extractable P with pH < 6 that does not relate well to sugarcane yield response to P fertilizer (McCray et al. 2010). Acetic acid-extractable P includes some residual P, which is not very available to plants. This explains why there are some locations with high Pa (such as Site 4) that do respond to P fertilizer application. Bray 2-extractable P includes labile P and Fe-Al bound P, but may also include some residual P. Mehlich 3 is the only extractant tested that included labile and non-labile (primarily Fe-Al bound) P, while excluding residual P.
Phosphorus Calibration Using Mehlich 3
Relationships between Pm and relative sugar/acre (Figure 3) were used to develop a new soil test P calibration (Table 4). A Pm value of 25 g P/m3 was chosen because above this value there is little probability of a yield response to P fertilizer in the plant cane crop (Table 4), as demonstrated by the yield plateau reached at that soil test level (Figure 2c). The greatest sucrose yield responses were determined with Pm < 15, so Pm values in this range were assigned the two highest P fertilizer rates, with Pm < 8 assigned the highest rate of 75 lb P2O5/acre for plant cane and first ratoon. The Pm range of 16–25 was divided into two equally spaced categories, with no P fertilizer recommended for plant cane with Pm > 25.
A maximum recommended banded P fertilizer rate for sugarcane was set at 75 lb P2O5/acre (Table 4) based on the results of banded applications in this study (McCray et al. 2010) and previous work (Andreis and McCray 1998). Banding P fertilizer for sugarcane in the EAA is a BMP intended to reduce P application rates and subsequent P discharge (Liu et al. 2006). Because of the difficulty in obtaining representative soil samples on which to base ratoon crop fertilizer recommendations after banding P fertilizer, these recommendations for plant cane and ratoon crops are based on preplant soil samples, consistent with previously published fertilizer recommendations (Gascho and Kidder 1979). The recommended P fertilizer rates of 40–75 lb P2O5/acre are constant from plant cane through the first ratoon for Pm < 25 g/m3 (Table 4). This is based on the consistent P requirement across crop years for banded rates in the study (McCray et al. 2010). For crops older than the first ratoon, P fertilizer recommendations at the highest two P application rates (Pm < 15) decrease slightly because the highest rates would have presumably been applied for two years (plant cane and first ratoon crops) and crop nutrient removal is expected to be less for later ratoon crops. Recommended P rates increase successively after plant cane for Pm 26–40 g P/m3 because of the probability that soil test values in this range may decrease through time such that the P fertilizer requirement will increase. For situations when no P fertilizer has been applied previously in the crop cycle, soil samples can be collected for ratoon crops specifically to determine the P fertilizer requirement, but there would not be an expected yield response for the sample year beyond a maximum Pm value of 25 g/m3.
Scope/Intent of UF/IFAS Fertilizer Recommendations
UF/IFAS fertilization and amendment recommendations are advisory in nature and emphasize efficient fertilizer use and environmentally sound nutrient management without losses of yield or crop quality. It is generally assumed that the nutrients will be supplied from purchased, commercial fertilizer and that expected crop yields and quality will be typical of an economically viable production system. Growers should consider UF/IFAS recommendations in the context of their entire management strategy, including return on investment in fertilizer and amendments. While relationships have not been developed relating specific water quality or other environmental parameters with soil test calibrations, use of soil test recommendations that have been developed through field research with crop yield response is an important best management practice consistent with an economically and environmentally sound nutrient management plan.
References
Andreis, H. J., and J. M. McCray. 1998. "Phosphorus Soil Test Calibration for Sugarcane Grown on Everglades Histosols." Commun. Soil Sci. Plant Anal. 29:741–54.
Bottcher, A. B., T. K. Tremwel, and K. L. Campbell. 1995. "Best Management Practices for Water Quality Improvement in the Lake Okeechobee Watershed." Ecological Engineering 5:341–56.
Castillo, M. S., and A. L. Wright. 2008. "Soil Phosphorus Pools for Histosols under Sugarcane and Pasture in the Everglades, USA." Geoderma 145:130-5.
Daroub, S. H., T. A. Lang, O. A. Diaz, and M. Chen. 2018. Best Management Practices in the Everglades Agricultural Area: Soil Testing. SL225. Gainesville, FL: University of Florida Institute of Food and Agricultural Sciences. Accessed October 26, 2015 https://edis.ifas.ufl.edu/ss445
Florida State Statutes. 1994. Florida Statute Section 373.4592. The Everglades Forever Act. Amendment of the 1991 Marjory Stoneman Douglas Everglades Protection Act. Tallahassee, FL.
Forsee, W. T., Jr. 1950. "The Place of Soil and Tissue Testing in Evaluating Fertility Levels under Everglades Conditions." Soil Sci. Soc. Am. Proc. 15:297–9.
Gascho, G. J., and G. Kidder. 1979. Responses to Phosphorus and Potassium and Fertilizer Recommendations for Sugarcane in South Florida. Technical Bulletin 809. Gainesville, FL: University of Florida Institute of Food and Agricultural Sciences.
Glaz, B., G. Powell, R. Perdomo, and M. F. Ulloa. 2000. "Sugarcane Response to Phosphorus Fertilizer in Relation to Soil Test Recommendations on Everglades Histosols." Agron. J. 92:375–80.
Hanlon, E. A., and G. V. Johnson. 1984. "Bray/Kurtz, Mehlich III, AB/D, and Ammonium Acetate Extractions of P, K, and Mg in Four Oklahoma Soils." Commun. Soil Sci. Plant Anal. 15:277–94.
Hochmuth, G., E. Hanlon, G. Snyder, R. Nagata, and T. Schueneman. 2018. Fertilization of Sweet Corn, Celery, Romaine, Escarole, Endive, and Radish on Organic Soils in Florida. BUL313. Gainesville, FL: University of Florida Institute of Food and Agricultural Sciences. Accessed October 26, 2015 https://edis.ifas.ufl.edu/cv008
Korndorfer, G. H., D. L. Anderson, K. M. Portier, and E. A. Hanlon. 1995. "Phosphorus Soil Test Correlation to Sugarcane Grown on Histosols in the Everglades." Soil Sci. Soc. Am. J. 59:1655–61.
Liu, G. D., E. H. Simonne, K. T. Morgan, and G. J. Hochmuth. 2018. Soil and Fertilizer Management for Vegetable Production in Florida. HS711. Gainesville, FL: University of Florida Institute of Food and Agricultural Sciences. https://edis.ifas.ufl.edu/cv101
McCray, J. M., R. W. Rice, Y. Luo, and S. Ji. 2010. "Sugarcane Response to Phosphorus Fertilizer on Everglades Histosols." Agronomy J. 102:1468–77.
McCray, J. M., R. W. Rice, Y. Luo, and S. Ji. 2012a. "Phosphorus Fertilizer Calibration for Sugarcane on Everglades Histosols." Commun. Soil Sci. Plant Anal. 43:2691–2707.
McCray, J. M., H. S. Sandhu, R. W. Rice, and D. C. Odero. 2019. Nutrient Requirements for Sugarcane Production on Florida Muck Soils. SS-AGR-226. Gainesville, FL: University of Florida Institute of Food and Agricultural Sciences. https://edis.ifas.ufl.edu/sc026
McCray, J. M., A. L. Wright, Y. Luo, and S. Ji. 2012b. "Soil Phosphorus Forms Related to Extractable Phosphorus in the Everglades Agricultural Area." Soil Sci. 177:31–8.
Mehlich, A. 1984. "Mehlich 3 Soil Test Extractant: A Modification of Mehlich 2 Extractant." Commun. Soil Sci. Plant Anal. 15:1409–16.
Reddy, K. R., Y. Wang, W. F. DeBusk, M. M. Fisher, and S. Newman. 1998. "Forms of Soil Phosphorus in Selected Hydrologic Units of the Florida Everglades." Soil Sci. Soc. Am. J. 62:1134–47.
Rice, R. W., F. T. Izuno, and R. M. Garcia. 2002. "Phosphorus Load Reductions under Best Management Practices for Sugarcane Cropping Systems in the Everglades Agricultural Area." Agricultural Water Management 56:17–39.
Tran, T. S., M. Giroux, J. Guilbeault, and P. Audesse. 1990. "Evaluation of Mehlich-III Extractant to Estimate the Available P in Quebec Soils." Commun. Soil Sci. Plant Anal. 21:1–28.
VanWeelden, M., S. Swanson, W. Davidson, M. Baltazar, and R. Rice. 2021. Sugarcane Variety Census: Florida 2020. Sugar J. 84(2):6-15.
Whalen, B. M., and P. J. Whalen. 1994. Nonpoint Source Regulatory Program for the Everglades Agricultural Area. Paper FL94-101. Florida Section of the American Society of Agricultural Engineers. St. Joseph, Michigan: ASAE.
Basic characterization of experiments in phosphorus rate studies with sugarcane on organic soils in Florida.
Initial soil extractable P for each P rate study and response to P fertilizer in response years and relative yield without P fertilizer.
Phosphorus forms having significant relationships with extractable soil phosphorus in organic soils using water, acetic acid, Bray 2, and Mehlich 3 (McCray et al. 2012b).