This fact sheet is one of a series titled Reclaimed Water Use in the Landscape addressing various issues related to use and management of reclaimed water in urban landscapes.
Introduction and Purpose
Almost all irrigation waters contain salts and other chemical constituents that either contact plant surfaces if irrigated with overhead sprinklers or are left behind in the soil after plants have used the water. Some of the reclaimed water constituents may contribute to plant nutritional needs but may also be detrimental if their concentrations exceed satisfactory ranges. Substances present in irrigation water can also impact irrigation equipment by causing corrosion of parts or clogging of emitters. The extent to which irrigation water will affect plant growth, soil health, and the functioning of irrigation equipment can be assessed by a water quality test. If water quality tests are conducted soon after new irrigation systems are constructed and at regular intervals after the onset of an irrigation regimen, you can often prevent any potential problems by appropriate landscape management decisions.
Understanding how information is conveyed on a water quality report is a first step to being able to manage irrigation practices and to make any needed maintenance adjustments. The purpose of this publication is to explain the units of measurement and analytical terms reported in an irrigation water quality report. The information provided here can be used by commercial growers, landscapers, UF/IFAS Extension agents, and homeowners who want a better understanding of water quality parameters, how they are quantified, and what their desirable levels are in reclaimed water. Users that only need to assess the quality of their water against known desirable values can find quick summaries in the tables of this publication. Other users who need information about how water quality values are derived and quantified will find more detailed discussions in the text of this publication.
Understanding Units of Measurement
Water quality data are reported in various chemical units summarized in Table 1. There is no "standard" requirement for laboratories to report water analyses data in particular units, so it is important to understand common units of measurements and conversions. Table 2 lists common conversion factors.
Understanding Water Quality Characteristics
Water quality parameters that can be found in an irrigation water quality report are described below and may include:
-
pH
-
Total soluble salts (indicated by electrical conductivity)
-
Bicarbonates, carbonates, and total alkalinity
-
Nutrients
-
Hardness
-
Sodium hazard
-
Specific ions toxic to plants at excess levels (boron, chlorine, sodium)
Water pH. The term pH denotes "potential of hydrogen (H+)" and is a measure of the water's H+ ion concentration, which also expresses the water's acidity or alkalinity. The pH measurement scale ranges from 0 to 14 with the following interpretations:
The pH value of water can affect the forms and availability of nutrients in irrigation water and fertilizer solutions. The pH may also affect the efficacy of some pesticides and impact equipment functioning. Figure 1 shows a palm frond with leaf tip damage from micronutrient toxicity, which is one problem that can result when irrigation water pH is too low (acidic).
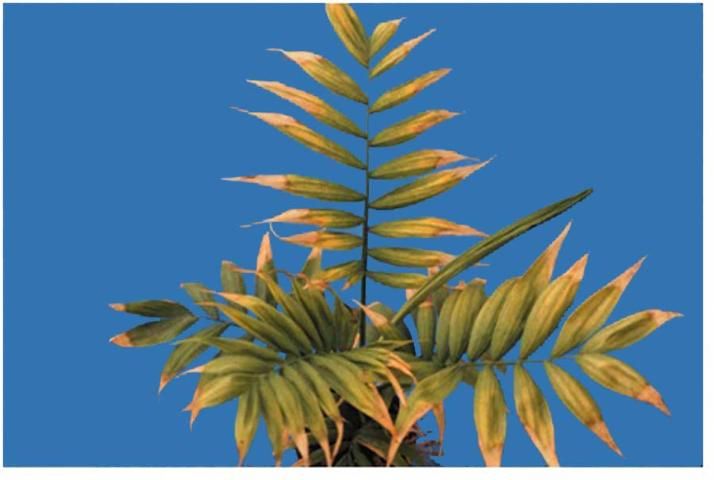
Credit: http://flrec.ifas.ufl.edu/palm_prod/palm_problems_key.shtml
A pH value between 6.5 and 8.0 is desirable for most irrigation water (Duncan et al. 2009). Table 3 summarizes some problems that may develop when irrigation water pH values fall outside the desirable range.
Total Soluble Salts. The accumulation of high total soluble salts in irrigation water is a serious problem that can lead to plant injury and detrimental soil conditions. Higher than desirable salt levels can cause physiological drought conditions in the soil, in which excess salts draw water away from plant roots. When experiencing physiological drought, plants can wilt from water stress even when the soil has plenty of moisture.
The total soluble salts in irrigation water are determined by the electrical conductivity of the water (ECw) and expressed in deci-siemens per meter (dS/m) or milli-mhos per centimeter (mmhos/cm). Pure water is a poor conductor of electricity. Water with increasing amounts of salt conducts electric current more and more effectively, and so a high ECw value is an indication of a high salt content.
The ECw value of water is usually reported with water quality test results. Occasionally, total soluble salts will be designated with the abbreviation TDS for "total dissolved salts" and reported in ppm or mg/L. You may also see the designation TSS for "total soluble salts," likewise reported in ppm or mg/L, but this designation can be confusing since it is also used to report "total suspended solids." Be sure to double check the meaning if you see TSS used on your water quality reports. For discussion here, total soluble salts will be designated as TDS.
The laboratory or the customer can convert the ECw value to TDS by multiplying ECw by an appropriate conversion factor:
-
Use 640 as the conversion factor when ECw is <5.0 dS/m.
-
Use 750 as the conversion factor when ECw is >5.0 dS/m or when the irrigation water is influenced by seawater.
For example, for irrigation water with an ECw value of 4.2 dS/m, the TDS value is
TDS, mg/L = ECw (in dS/m or mmhos/cm) x 640 = 4.2 x 640 = 2,688 mg/L TDS
Duncan et al. (2009) reported that ECw values between 0.40 and 1.20 dS/m are desirable; this value range translates to a TDS range of 256 to 832 mg/L. However, Ayers and Westcot (1994) report that ECw values greater than 3.0 dS/m are common in many irrigation waters. Table 4 summarizes irrigation water salinity classifications and gives advice for management options.
Specific Ions: Chloride, Sodium, Boron. Irrigation water contains naturally occurring ions that can pose a toxicity hazard to landscape plants and turf if found at high enough concentrations. As a hazardous ion accumulates in the root or shoot zone, the plant will suffer stress and chemical injury. In some instances, direct foliage contact from irrigation water with high levels of these ions can also damage turf. The ions that most commonly pose a toxicity hazard are chloride, with a critical level of 70 ppm, and boron, with a critical level of 0.7 ppm. Sodium toxicity can occur in some circumstances, but soil permeability issues usually arise before toxic levels are attained. Table 5 summarizes management considerations for the prevention of chloride, boron, and sodium toxicities from irrigation water. Note that as total salinity or EC increases, the potential for ion toxicity increases. Germinating seed and young seedlings are most at risk because of their juvenile developing root systems.
Bicarbonates, Carbonates, and Alkalinity. Both bicarbonates (HCO3) and carbonates (CO3) are salt ions that can be found in irrigation water. These ions may be especially high in irrigation water (such as reclaimed water) that is derived from domestic wastewater because of the influence of domestic water use (HCO3 and CO3 are commonly found in household detergents). Furthermore, in Florida the limestone that makes up our aquifers (porous rocks that hold underground water supplies) contributes natural dissolved HCO3 to many of the state's water sources. See Table 3 for problems associated with the presence of HCO3 and CO3 in high pH (>8.0) irrigation water.
Dissolved HCO3 and CO3 together contribute to the total alkalinity in water. Hydroxide ions (OH-) also contribute to alkalinity, but their role is minimal. Alkalinity describes how much acid is required to lower the pH of water to a certain level. The more alkalinity present in irrigation water, the more acid it will take to bring the pH down to the desired value, and the more likely you are to have problems associated with high pH measurements (see Table 3).
In a water quality test report, the concentration of all of the ions that make up the alkalinity term are combined and reported as equivalents of calcium carbonate, CaCO3, which is the main component of lime. Alkalinity can therefore have a liming effect on the soil. Table 6 lists desired ranges for HCO3, CO3, and total alkalinity in irrigation water. Possible corrective measures for excess alkalinity include soil amendments with sulfur and injecting the irrigation water with acid. You can also check out https://edis.ifas.ufl.edu/pdffiles/SS/SS16500.pdf for more information about how to correct problems of excess HCO3 in irrigation water.
Hardness. Water hardness is a measure of the dissolved mineral content in water. The dissolved minerals that contribute to hardness in water are predominantly dissolved ions of calcium and magnesium. These ions enter a water supply when water contacts minerals as it flows through the aquifer or over land. For example, in Florida calcium ions in water come from the calcium-bearing minerals that make up the limestone aquifer. In this way, hard water contains the same mineral components of limestone, and when used for irrigation, it is the same as adding a small amount of lime to the soil every time you water. The chalky white deposits and scaling associated with hard water come from compounds of calcium and magnesium that precipitate out of the mineral-laden water.
In a water quality test report, hardness is typically expressed in mg/L but may sometimes be reported as grains per gallon (gpg), with 1 gpg equal to 64.8 mg of calcium carbonate (lime) per gallon of water. Table 7 outlines water hardness interpretations for various values. Hardness values less than 150 mg/L are desirable in most irrigation water.
Using hard water for irrigation can have a liming effect on the soil, cause white deposits on plant foliage, and clog irrigation equipment. The best solution for hard water is to regularly check and maintain your irrigation equipment and avoid overhead drip irrigation so that the water does not contact plant foliage. While water softeners can be used for household uses, do not soften your irrigation water, as this action will increase the salt content of the water and bring its own set of problems (see Total Soluble Salts, above).
Sodium Permeability Hazard. Though there are several types of salt ions that affect irrigation water, sodium (Na) is the most important in terms of affecting soil structure and water infiltration. As Na levels increase, soil structure is diminished because Na causes soil particles to disperse and soil aggregates to break apart. With diminished soil structure, water infiltration rates decline and plant roots receive less water and gas exchange. The sodium permeability hazard therefore relates the sodium level in irrigation water to its potential to bring about detrimental soil conditions and reduced water infiltration. Concentrations of sodium are especially high in reclaimed water due to domestic sources and in coastal areas due to seawater intrusion. Consult https://edis.ifas.ufl.edu/ss545 for ways to manage sodium in reclaimed water irrigated sites. Described below are methods for calculating the sodium permeability hazard, and desired values are listed in Table 7.
Sodium Adsorption Ratio. The sodium adsorption ratio (SAR, sometimes also called RNa) is the traditional means of assessing the sodium permeability hazard. SAR is expressed in milli-equivalents per liter (meq/L) and is calculated by relating free calcium (Ca) and magnesium (Mg) levels to Na levels as follows:

A SAR of less than 6 is usually satisfactory, while values greater than 6 indicate a potential problem for reduced water infiltration, particularly on poorly drained soils with high clay content.
You may occasionally see the term adj SAR, which stands for "adjusted SAR." This value accounts for the effects of any HCO3 and CO3 in the irrigation water. As mentioned earlier, HCO3 and CO3 will remove free Ca and Mg from the soil, and this reaction creates room for Na to accumulate, thereby increasing the sodium permeability hazard when HCO3 and CO3 are present in irrigation water. When HCO3 and CO3 values exceed 120 and 15 meq/L, respectively, a lab may calculate and report an adjusted SAR value to account for their effects. The methods used to calculate adj SAR are outlined in Lesch and Saurez (2009). Check with the lab that performs your water quality test if you are unsure whether the lab is reporting the traditional SAR or the adjusted SAR value.
Residual Sodium Carbonate. One other parameter you may see on your water quality report is the residual sodium carbonate (RSC). The RSC formula is a quick test to determine if irrigation water can reduce free Ca and Mg in the soil. RSC is calculated by:
RSC (meq/L) = (HCO3 + CO3) – (Ca + Mg), where all ion concentrations are in meq/L
A negative RSC value indicates little risk of Na accumulation due to offsetting levels of Ca and Mg. A positive value indicates that HCO3 and CO3 will reduce free Ca and Mg in the soil, thereby creating room for Na to accumulate and causing problematic soil conditions. Duncan et al. (2009) report that a RSC value of less than 1.25 is desirable. Table 8 summarizes sodium permeability hazards, as indicated by SAR and RSC values.
The sodium hazard should be evaluated with ECw data at hand. As ECw increases, so does the SAR level at which you will see detrimental effects on soil structure and water infiltration (Figure 2). Increasing free Ca in the soil will amend a sodium permeability problem because Ca has a more powerful electrical attraction to soil particles and will displace Na. Free Ca can be increased in low-calcium soils with gypsum (calcium sulfate). On other soils containing insoluble Ca, irrigation water can be treated with acid, or soil can be amended with elemental sulfur.
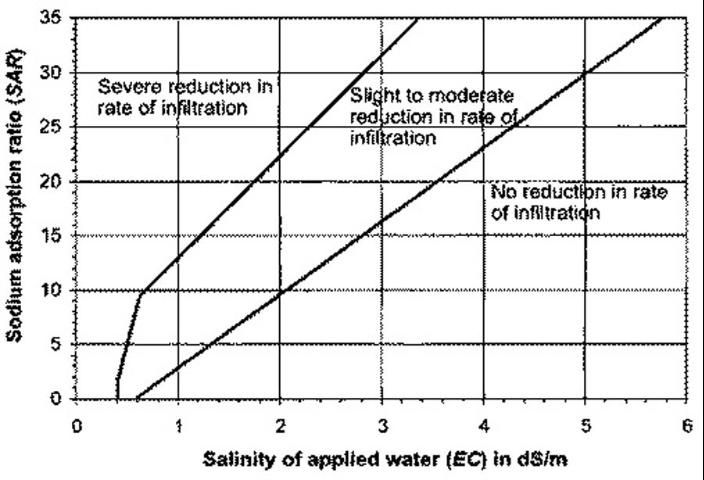
Credit: Duncan et al. (2009)
Summary
Determining what to test in water and how to interpret the results of a water quality report are confusing problems, and they are exacerbated by incomplete water analysis reports with confusing units or no reference points. Further, composition of irrigation water, especially reclaimed water, is quite variable (seasonal effects, source differences) so make sure to test the samples a few times a year to understand the variability, or contact the reclaimed water provider for more information as many providers routinely test water for several parameters. Remember that a water quality test can help to identify and diagnose the problems, but a good understanding of what to test is essential!
Now, let's pretend that you are having plant damage problems in a site irrigated with reclaimed water: what would you test in the reclaimed water sample? We suggest that you contact the reclaimed water provider to determine if they can provide you with the latest water quality analysis report. If the provider cannot, we suggest that you first measure pH and electrical conductivity and compare these values against Tables 3 and 6. If that does not solve the problem, more water quality analysis would be needed to diagnose the problem. Consider this exercise as similar to a visit to a doctor's office to diagnose the problem! The next analysis should be to determine total concentrations of sodium, chloride, and boron, especially if plants are irrigated with overhead sprinklers. See Toor and Lusk (2011) for more information on Constituents of Concern in Reclaimed Water (https://edis.ifas.ufl.edu/ss543). If these additional tests do not solve the problem, more tests on reclaimed water may become apparent to calculate Sodium Adsorption Ratio (SAR) and Residual Sodium Carbonate (RSC) and compare values in your water against Table 7. The UF/IFAS Extension Soil Testing Laboratory in Gainesville can test water for selected constituents (pH, electrical conductivity, hardness, sodium, chloride) for a small fee. A sample submission form can be found at https://edis.ifas.ufl.edu/pdffiles/SS/SS18400.pdf.
References
Ayers, R. S. and D. W. Westcot. 1994. Water Quality for Agriculture. FAO Irrigation and Drainage Paper 29, Rev. 1, Reprinted 1994. Food and Agricultural Organization, Rome, Italy.
Duncan, R.R., Carrow, R., and M. T. Huck. 2009. Turfgrass and Landscape Irrigation Water Quality: Assessment and Management. CRC Press, Boca Raton, FL.
Hanson, B., S. R. Grattan, and A. Fulton. 1999. Agricultural Salinity and Drainage. Div. of Agric. and Nat. Res. Publ. 3375. Univ. of California, Davis, CA.
Lauchli, A., and U. Luttge. 2002. Salinity: Environment-Plants-Molecules. Kluwer Academic Publ., Boston, MA.
Lesch, S.M., and D.L. Suarez. 2009. A short note on calculating the adjusted SAR index. Transactions of the ASABE. 52(2):493-496.