Introduction
The United States is the second largest producer of lettuce in the world, averaging about 21% of the world's production. In 2007, almost 4.6 million tons of lettuce were harvested from 313,036 acres of land (USDA 2009; USDA 2005). Florida contributed less than 1% of the national lettuce (head, leaf, or romaine) production that year, with approximately 7,239 harvested acres. Currently, it is estimated more than 10,000 acres of lettuce are grown in the Everglades Agricultural Area (EAA). Almost 90% of the lettuce in Florida is grown on organic muck soils in Palm Beach County around the southern tip of Lake Okeechobee in the EAA (USDA 2009). In Florida, the average cost of lettuce production is approximately $3,400 per acre. Average yields are nearly 30,000 pounds per acre, and the fertilizer cost represents approximately 8% of the total production cost (Hochmuth et al. 1994).
Lettuce is a leafy vegetable that has rapid growth and reaches harvest in 60–70 days in South Florida. This leads to high demands for nitrogen (N) fertilization to maintain adequate plant-available N concentrations in the soil during the short growing season. Growers need to supply the required amounts of N to obtain high yields. A good N fertilization scheme should reduce costs, conserve natural resources, and minimize negative environmental impacts. The keys to using fertilizer efficiently are understanding the crop nutrient requirements to predict fertilizer needs and management as well as knowing the appropriate amounts to apply (Vitosh 1990). Lettuce growers also need to know the nutritional status of the crop through soil and plant tissue testing.
Relationships between fertilization rates, plant growth, and yield response have been developed for many crops grown in Florida. The Soil Testing Laboratory at the UF/IFAS Everglades Research and Education Center performs soil and tissue tests to provide growers with suggested fertilization rates for different crops. Such N recommendations for crisphead and romaine lettuce are 60–90 lb N/ac. Nitrogen uptake proceeds very slowly in lettuce until the crops enter the folding stage, then N flux increases to about 3 lb/acre per day during heading. In general, lettuce takes up about 80% of its total N during the last four weeks (folding to heading). Lettuce growers may add supplemental N fertilization at the beginning of this stage of lettuce growth (Doerge, Roth, and Gardener 1991). N fertilizer applications for lettuce are often split, with half of the recommended rate applied at planting and the other half applied four weeks before harvest (see Table 1).
Everglades Agricultural Area Soils
Soils in the EAA typically have 85% organic matter, and organic material exposed to the atmosphere continues to decay, a process known as subsidence. During subsidence, nutrients in the soil are released and can be made available for uptake by crops (Wright and Hanlon 2012). As subsidence proceeds in organic soils, quantities of N are released along with carbon. This organic matter contains N in the form of amino acids, proteins, and nucleic acids (Wright and Hanlon 2012). When broken down, these release inorganic N forms available for crop uptake.
In the soil, N in decomposing organic matter may be converted into inorganic N forms by soil microorganisms (bacteria and fungi) in a process called mineralization. These bacteria and fungi, also called decomposers, may be found in the upper soil layer where they transform N. However, the amounts of N released by organic matter decomposition is not enough to meet the demand of the lettuce crops, so growers need to apply N fertilizer to supply the entire lettuce N demand.
Nitrogen Management and Cycling
The atmosphere contains about 79% N2 gas. Although unavailable to most plants, large amounts of N2 can be used by leguminous plants through "N fixation." In this biological process, nodule-forming Rhizobia bacteria inhabit the roots of leguminous plants and through a symbiotic relationship convert atmospheric N2 to a form plants can use (Lindemann and Glover 2008). Non-symbiotic N fixation also occurs; in this process, certain free-living microorganisms not associated with plants can fix small amounts of atmospheric N. However, in the muck soils of the EAA, biological N fixation is likely insignificant unless N-fixing legumes are grown.
Plants generally require N in the largest amounts compared to all plant-essential nutrients. Nitrogen promotes rapid growth and increases lettuce's size and quality. It is also an essential part of the chlorophyll manufacturing process through photosynthesis (Doerge, Roth, and Gardener 1991). Nitrogen can be added to the soils in various forms, including synthetics forms, compost, and manure, but plants use N only as nitrate (NO3) and in a minor degree as ammonium (NH4). When N fertilizer is applied to soils, organisms living in the soil convert the unavailable N to available N. Then, NO3 and NH4 ions dissolved in the soil water can be taken up by plant roots.
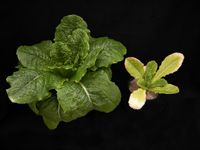
When N is deficient, root systems and plant growth are stunted and a pale green color can be observed in the leaves (Figure 1). Older leaves show "firing" and die, and the crop is often low in crude protein (Liu, Simonne, and Hochmuth 2012). Figure 1 illustrates two plants that started to grow on the same day. However, N was withheld from one plant to cause a nutrient deficiency during growth, while the other plant received complete nutrition (IPNI 2008).

Credit: L. Santos
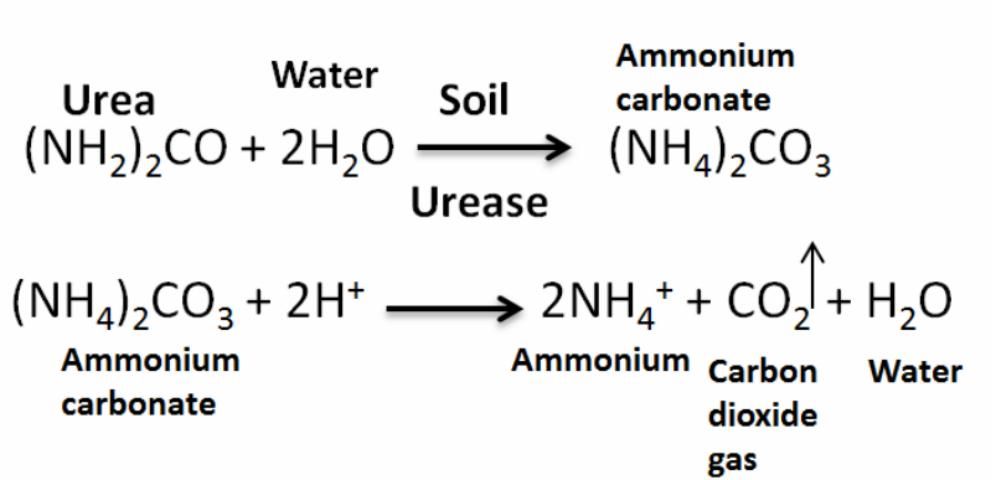
Most of the N used by crops is derived from synthetic N fertilizers, such as urea, the primary source of dry N fertilizer in the United States. Once applied to the soil, urea reacts with water and urease (produced by soil bacteria) to form ammonium carbonate (Figure 2). Then this reacts with hydrogen and forms NH4, carbon dioxide, and water. This process occurs within two or three days (faster under warm conditions). Then NH4 is converted to NO3 in a process called nitrification (Figure 3), when NH4 in the soil is oxidized by bacteria (Nitrosomas) to form NO3, which can be readily taken up by plants.

If urea is applied on the surface and not incorporated (either by rain or tillage), N losses to the air (as ammonia) can approach 40% of the applied N (Vitosh 1990). The N fertilizer losses potentially include NH3 volatilization, leaching (downward movement of NO3 out of the root zone), denitrification (conversion of NO3 to N2), plant uptake, and removal in harvested plant biomass (Jones et al. 2007). In addition, if the urea is applied too close to the seed, the hydrolysis of urea can cause a rapid increase in pH, resulting in ammonia release that can damage seedlings. Moreover, if urea is applied as a band starter, the planter should be carefully checked to ensure placement is not closer than two inches beside and below the seed (Weiss et al. 2009).

A good N fertilization management plan results in higher crop yields. The UF/IFAS Everglades Research and Education Center recommends a total N application of 60–90 lb N/acre for lettuce (Table 1). However, for an appropriate N intake, the grower should schedule these applications two times and use two application methods (Table 1). Plant tissue analysis is also an important tool to determine nutrient status. This technique permits diagnostic as well as suspected nutritional deficiency or toxicity (Hochmuth et al. 2004). In lettuce, the tissue analysis can be done at the 8-leaf age, using the oldest undamaged leaf (Santos et al. 2012). Table 2 shows the adequate and deficient ranges of N in lettuce.
References
Doerge, T. A., R. L. Roth, and B. R. Gardner. 1991. Nitrogen Fertilizer Management in Arizona. College of Agriculture Doc. 19102. University of Arizona.
Hochmuth, G., E. Hanlon, R. Nagata, G. Snyder, and T. Schueneman. 1994. Fertilization Recommendations for Crisphead Lettuce Grown on Organic Soils in Florida. SP153. Gainesville: University of Florida Institute of Food and Agricultural Sciences. https://edis.ifas.ufl.edu/wq114.
Hochmuth, G., D. Maynard, C. Vavrina, E. Hanlon, and E. Simonne. 2004. Plant Tissue Analysis and Interpretation for Vegetables Crops in Florida. HS964. Gainesville: University of Florida Institute of Food and Agricultural Sciences. https://edis.ifas.ufl.edu/ep081.
IPNI (International Plant Nutrition Institute). 2008. Crop Nutrient Deficiency. http://www.ipni.net/article/IPNI-3153.
Jones, C. A, R. T. Koenig, J. W. Ellsworth, B. D. Brown, and G. D. Jackson. 2007. Management of Urea Fertilizer to Minimize Volatilization. EB 173. Montana State University Extension Service.
Lindemann, W. C., and C. R. Glover. 2008. Nitrogen Fixation by Legumes. Cooperative Extension Service Guide A-129. New Mexico State University.
Nitrogen fertilizer recommendations for crisphead and romaine lettuce grown on muck soils (Hochmuth et al. 1994).