Introduction
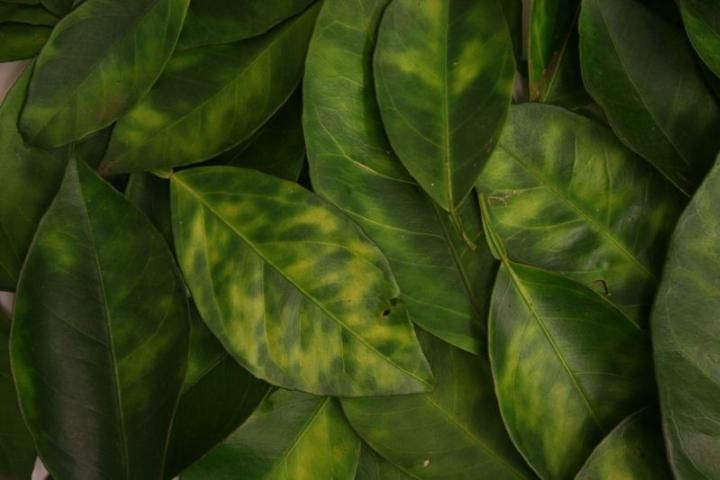
Florida is the largest orange-producing state in the United States, and the third largest orange producer in the world behind Brazil and China. Approximately 95% of all oranges grown in Florida are processed for juice (USDA/NASS 2015). The Florida citrus industry and its position in the global citrus market is being jeopardized by a bacterial disease known as citrus greening or Huanglongbing (HLB). HLB adversely affects the vascular systems of citrus trees, limiting nutrient uptake. Consequently, the disease reduces yield, fruit size and quality, and increases tree mortality and cost of production. First found in Florida in 2005, HLB has spread rapidly across the state (CREC 2015a).
Credit: UF/IFAS
As of January 2016, there is neither a cure nor an economically viable option for managing HLB-infected trees. Since HLB was first found in 2005, orange acreage and yield in Florida have decreased by 26% and 42%, respectively. Orange production dropped from 242 million to 104.6 million boxes in 2014. Even though the industry acknowledges that HLB has reached epidemic proportions across the state, estimates of the level of infection and its impact on citrus operations are scarce. This article presents the first growers'-survey-based estimates of both the level of HLB infection in Florida and the impact of HLB on citrus operations in Florida.
Surveying the Florida Citrus Industry
We conducted a survey of individuals involved in citrus production in Florida during a biannual event organized at the UF/IFAS Citrus Research and Education Center. There were 326 attendees at the event, including growers, researchers, Extension agents, the media, and state officials. The number of growers was estimated at 200. The number of completed surveys was 76, giving a response rate of 38%. Survey participants operated 156,614 acres, which accounts for approximately 30% of the total acreage devoted to citrus in Florida.
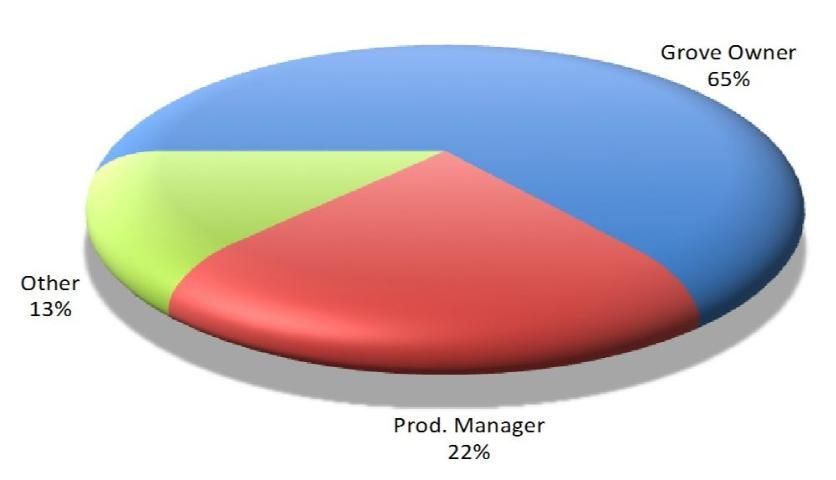
The proportion of grove owners and production managers who participated in the survey were 65% and 22%, respectively, while 13% of the respondents classified themselves as other (Figure 2). Those in the latter category defined their responsibilities as caretaker, nursery manager, manufacturer, processor, research farm manager, or researcher.
Credit:
Survey-Based Estimates on HLB Impact
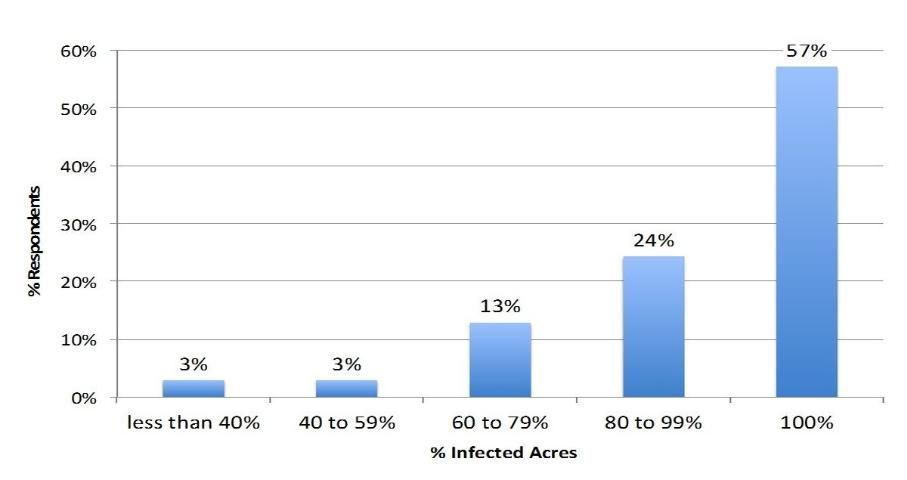
To quantify the impact of HLB on citrus operations in Florida, we asked participants to answer three questions (Figures 3, 4, and 5 show the distribution of their responses). First, we asked them to estimate the percentage of acres in their operations infected with HLB (Figure 3). The percentage of growers who indicated that 100% of their acres were infected — that is, at least one tree in every single acre of their groves was infected with the bacteria — was 57%. Another 24% of participants stated that the percentage of acres in their operations infected with HLB was greater than or equal to 80% but less than 100%. The average percentage of acres infected with the bacteria across responses was 90%.
Credit:
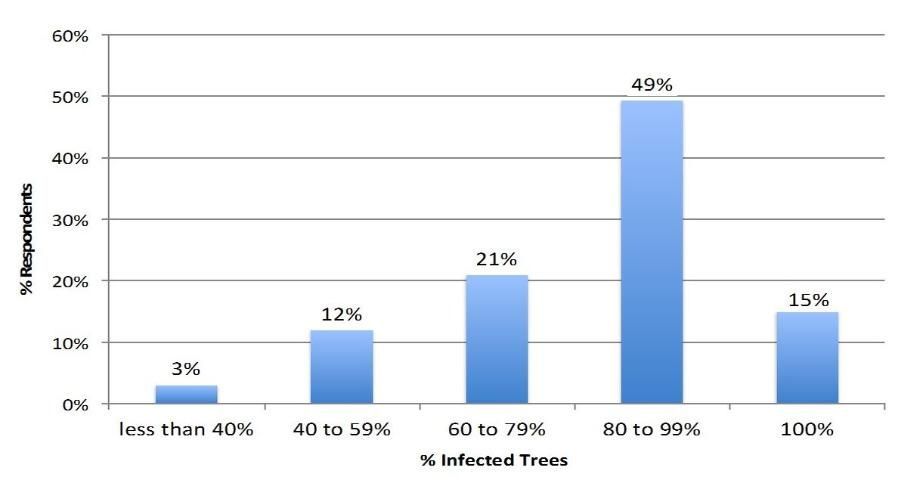
Second, we asked participants to estimate the percentage of HLB-infected trees in their operations (Figure 4). In this case, 49% of the individuals stated their operations have a percentage of infected trees that is greater than or equal to 80% but less than 100%, while 15% indicated that 100% of their trees are infected. Together these two groups account for 64% of the respondents. Taking the average across all responses, the average percentage of trees infected with HLB was 80%.
Credit:
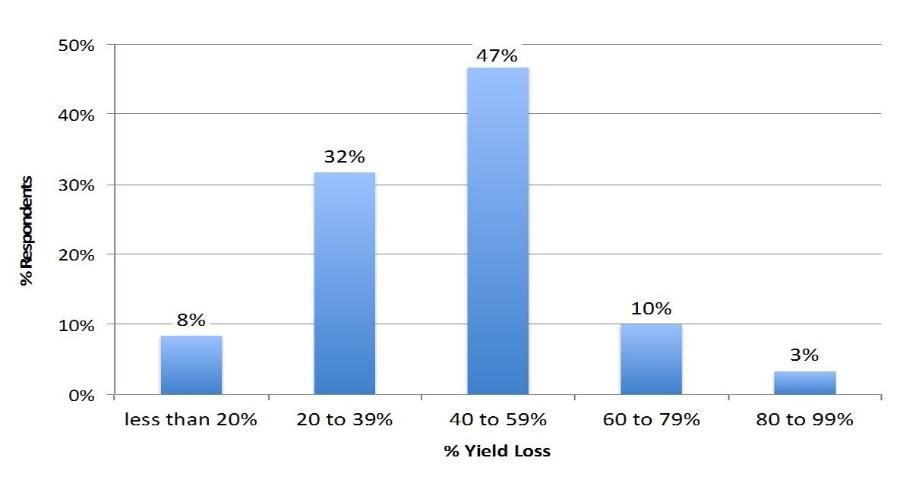
The third question, aimed at collecting data on the impact of the disease, asked growers to estimate the average percentage yield loss per acre they attribute to HLB (Figure 5). We used the midpoint of the ranges. Combining the categories reporting a yield loss greater than 40% accounts for 60% of the respondents. The average percentage yield loss across all responses was 41%.
Credit:
Analysis by Region
To analyze the survey responses by region, we categorized the location of the participants' operations into three areas: (1) central Florida, (2) central/southwest Florida, and (3) southwest Florida. Column 1 in Table 1 shows that 44 participants had operations in central Florida; 11 had operations in central/southwest Florida, and 21 had operations in southwest Florida.
Column 2 in Table 1 shows the average size of the operation for each region, which were 693, 1,962, and 5,818 acres for central Florida, central/southwest Florida, and southwest Florida, respectively. The average operation size is significantly larger in southwest Florida than in central Florida because of three severe freezes in the 1980s, which killed a large proportion of citrus trees. The industry responded by planting new larger groves farther south of central Florida, which used to be the state's primary citrus-growing region.
Even though the majority of the respondents in our sample were from central Florida, much of the acreage was in southwest Florida (Column 3 in Table 1), which resembles the actual citrus acreage distribution reflected in the 2014 USDA Florida Citrus Statistics (USDA/NASS 2015). In our sample, 71% of the total acreage is in southwest Florida, 18% in central Florida, and 11% is distributed across central/southwest Florida. USDA reports that 54% of the total citrus acreage in 2014 was in southwest Florida while 29% was in central Florida. This distribution also closely follows the regional contributions in terms of production (boxes), with southwest Florida contributing 52% of total production and central Florida contributing 30%.
Columns 4, 5, and 6 in Table 1 show the average percentage of HLB-infected acres, HLB-infected trees, and HLB-related yield loss per acre, respectively. Interestingly, the percentage of HLB-infected acres in southwest Florida was 4% larger relative to central Florida while the percentage of HLB-infected trees was 6% lower in southwest Florida relative to central Florida. Furthermore, the average percentage of HLB-related yield loss per acre in southwest Florida was 12% lower than in central Florida. The percentage of HLB-infected acres and average percentage of HLB-related yield loss for operations with groves in central/southwest Florida were the midpoint relative to the other two regions. However, these operations had the lowest percentage of HLB-infected trees.
It can be argued that the lower percentage of HLB-infected trees and percentage of HLB-related yield loss in southwest Florida relative to central Florida are due to the size of the operations. Larger citrus-growing operations can attain economies of scale. These larger operations are typically owned by corporations, which can also be vertically integrated into fruit processing or packing operations. Such integration can allow a higher level of spending in the caretaking of trees in southwest Florida relative to the smaller operations found in central Florida.
Another important consideration regarding the size of operations is related to Citrus Health Management Areas (CHMAs). A CHMA is a voluntary area-wide pest management approach suggested by researchers from the University of Florida to control the Asian Citrus Psyllid (ACP). Each CHMA constitutes a grouping of growers who work cooperatively to coordinate insecticide application to control the spread of ACP across neighboring commercial citrus groves. The idea behind this cooperative effort is that it provides a larger and more lasting effect relative to individual (uncoordinated) treatments because it minimizes movement of psyllids between groves (CREC 2015b). However, due to the decrease in profitability, many growers have reduced inputs for caretaking of trees, including insecticide applications. Thus, they either do not participate in CHMAs or do so in a limited fashion. However, by doing so, these growers impose a cost on their neighbors. Larger operations are less dependent upon the willingness of neighboring growers to participate in CHMAs and are better able to control for ACP and manage the impact of HLB.
Summary
The Florida citrus industry currently faces the challenges imposed by HLB: decreasing yields and production, lower quality fruit, and higher tree mortality rates. All of which have resulted in an increased cost of production. This article summarizes the results of a survey conducted to obtain growers' estimates on the level of infection and impact of HLB on citrus operations in Florida. From these assessments, we found that, on average, the current percentage of HLB-infected acres and HLB-infected trees in a citrus operation in Florida are 90% and 80%, respectively. Furthermore, compared to pre-HLB levels, the average percentage of HLB-related yield loss that growers attribute to HLB is 41%. In addition, citrus operations in central Florida experience a 12% higher yield loss to HLB relative to those in southwest Florida. These findings are useful in providing growers, stakeholders, researchers, and governmental agencies an industry-wide status of the progress and impact of HLB.
References
Citrus Research and Education Center [CREC]. 2015a. Greening or Huanglongbing (HLB) Worldwide.
Citrus Research and Education Center [CREC]. 2015b. Citrus Health Management Areas (CHMAs).
United States Department of Agriculture, National Agricultural Statistics Service [USDA/NASS]. 2015. Florida Citrus Statistics 2013/14.
Table 1. Responses to citrus industry survey, by region.