How Likely Is a 100-Year Rainfall Event During the Next Ten Years?
Introduction
Hydrologists and water resources engineers examine historical rainfall observations to figure out how large potential storm events may be and how often a large event of interest comes in a probabilistic sense. Such investigation and estimation processes are called rainfall frequency analysis. Information regarding the size and frequency of extreme hydrologic phenomena, such as storm events, floods, and droughts, is used to determine the capacity of a hydraulic structure and assess its failure risk. Rainfall frequency analysis finds a probability distribution that provides a good fit to rainfall depth observations and then uses the distribution to calculate the size of events that can occur with various probabilities, such as 0.5%, 1%, 10%, and 50%, in a year.
The probability of the occurrence of a given rainfall event is sometimes expressed with a recurrence interval (or return period), which represents the "average period between years in which a given rainfall depth is exceeded at least once" (NOAA 2017). The terms "once in 100 years" rainfall or "100-year" rainfall are often used to describe the severity of some rainfall events and/or to convey the idea that the event occurs, or could occur, once every 100 years on average. In practice, what these terms represent is the probability of occurrence within any one-year period of a potentially extreme hydrologic event. For example, a 100-year rainfall is a rainfall event that has a 1/100 or 1% probability of occurring within any one-year period. Similarly, a 50-year rainfall is one that has a 1/50 or 2% probability of occurring.
However, the concept of the recurrence interval and the term "average period" often create confusion regarding the expected frequency of a given event (Chow 1953; Perica et al. 2013). This fact sheet describes proper interpretation of rainfall event probabilities and recurrence intervals, particularly as they are used by engineers and water resources managers in the design and construction of hydraulic structures, such as dams, levees, and canals. This article focuses on rainfall, but its explanations and concepts can be applied to other extreme hydrologic phenomena such as flood and drought.
What do the commonly used statistics really tell us?
In a frequency analysis, a list of storm events is ranked by rainfall depth. The data are fit into a theoretical probability distribution. Annual exceedance probabilities, the percent chance of occurrence, are then calculated using a statistical formula. In the analysis, events on the list are assumed to happen independently so that, theoretically, any combination of events can occur in a given year. Finally, the probability of occurrence of a rainfall event that produces a given depth is calculated based on the probability distribution identified in the frequency analysis. It is usually not feasible to obtain a rainfall time series long enough to determine an interval between two large events that have the same rainfall depths. Thus, engineers use the probability distribution to extrapolate a recurrence interval of large rainfall events. Detailed procedures and examples of a rainfall frequency analysis can be found in the technical report prepared by Pathak (2001).
The probability of the occurrence of a rainfall event is expressed as a percentage. Its reciprocal is often translated to the "average recurrence interval" (Equation 1).
The interpretation of the relationship (Equation 1) may not be statistically accurate for two reasons. Firstly, a frequency analysis assumes that any of the rainfall events collected can happen in a single year. Also, a frequency analysis usually does not contain enough rainfall events needed to determine the interval of "recurrence" of an extreme event, such as 100-year rainfall. Secondly, even when a sufficiently long list of rainfall events is incorporated into a frequency analysis, large rainfall events do not necessarily occur throughout the entire period. For instance, the 30 largest rainfall events can be found in only 20 different individual years. Thus, the length of an analysis period does not necessarily represent the interval of the recurrence of a rainfall event found on the list. Furthermore, the recurrence interval does not provide a statistical basis to answer the question: how often might a 1% (or 100-year) rainfall event occur during the next ten years?
How often may we have a P% rainfall event in the next N years?
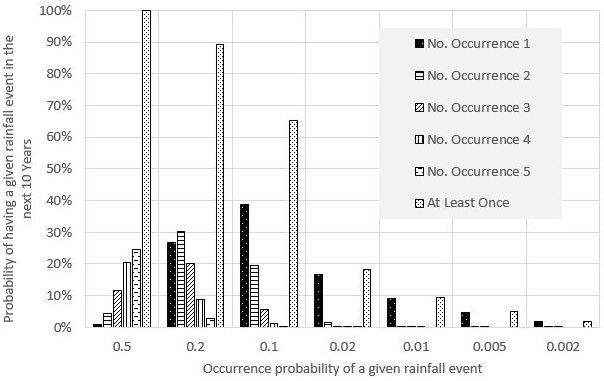
In statistics, the probability of having a P% rainfall event M times during the next N years is described using the binomial probability (Ott and Longnecker 2001). Table 1 and Figure 1 show how many times (M) a given rainfall event with a probability (P) can occur within a specific period of time (N). As shown, there is a 63.4% (rather than 50% or 100%) probability of having a 1% (0.01 occurrence probability) rainfall event at least once in the next 100 years. Such calculations demonstrate that the recurrence interval of a rainfall event (e.g., 100-year rainfall) does not accurately represent the expected frequency of an event. Thus, an event with an occurrence probability of 1% should be called a "1% event" rather than a "100-year event." The calculation also shows that there is a 9.6% chance of having a 1% (or 100-year) rainfall event in the next ten years, and a 99.9% chance of a 50% (or 2-year) rainfall event within the next decade.
In engineering, the capacity of a hydraulic structure is determined to accommodate a peak stormwater runoff, which is calculated based on a designated design storm frequency. For instance, in Miami-Dade County, the cross-sectional dimension of a canal should be big enough to safely pass open-channel flow generated by a 25-year (4%) storm event (Chin 2004; FDOT 2017). In this example, there is a 4% (1/25) probability that the canal may fail to convey stormwater. However, it should not be assumed that the canal may fail every 25 years on average, or that the canal will be safe next year if it floods this year. There is always a certain probability of canal failure each year, regardless of past events (as the independence of events is assumed in the frequency analysis). The application of stricter design criteria (i.e., a lower occurrence probability or longer recurrence interval) may reduce the chance of failure.
Credit: Young Gu Her, UF/IFAS
Summary
This publication explains the statistical basis of a rainfall frequency analysis and demonstrates a right way to interpret the recurrence interval of a design rainfall. A recurrence interval does not tell a correct return period of a given rainfall event in a statistical sense, but gives a misconception about a design storm. Regardless of its previous behavior, a storm can happen in every year with the same probability. Thus, it is more appropriate to call an event with the 1% occurrence probability a "1% event" rather than a "100-year event."
References
Chin, D. A. 2004. "An overview of urban stormwater-management practices in Miami-Dade County, Florida." U.S. Department of the Interior, U.S. Geological Survey. Accessed on June 6, 2017. https://pubs.usgs.gov/of/2004/1346/pdf/ofr20041346.pdf
Chow, V. T. 1953. "Recurrence interval." In Frequency analysis of hydrologic data with special application to rainfall intensities. Urbana, IL: University of Illinois. 15–16.
FDOT. 2017. "Florida Greenbook Drainage Chapter considerations." Florida Department of Transportation. Accessed on June 9, 2017. https://www.fdot.gov/docs/default-source/roadway/floridagreenbook/GreenbookDrainage.pdf
NOAA. 2017. "Glossary." NOAA's National Weather Service, Hydrometeorological Design Studies Center. Accessed on February 2, 2022. https://www.weather.gov/owp/hdsc_glossary
Ott, R. L. and M. T. Longnecker. 2001. An introduction to statistical methods and data analysis. 5th edition. Boston, MA: Cengage. 144–149.
Pathak, C. S. 2001. "Technical Publication EMA #390: Frequency analysis of daily rainfall maxima for central and south Florida." Hydro Information Systems & Assessment Department. Environmental Monitoring & Assessment Division, South Florida Water Management District. Accessed on January 25, 2023. https://doi.org/10.1061/40569(2001)227
Perica, S., D. Martin, S. Pavlovic, I. Roy, M. St. Laurent, C. Trypaluk, D. Unruh, M. Yekta, and G. Bonnin. 2013. "4.6.1. Overview of methodology and related terminology." In NOAA Atlas 14: Precipitation-frequency atlas of the United States, volume 9, version 2.0: Southeastern states (Alabama, Arkansas, Florida, Georgia, Louisiana, Mississippi). Silver Spring, MD: U.S. Department of Commerce, National Oceanic and Atmospheric Administration, National Weather Service. 18.