Introduction
US Topo refers to USGS (United States Geological Survey) topographic maps published as digital documents in 2009 and later. Latitude and longitude values in US Topo maps are provided in decimal degrees for each corner of a map sheet. Each map sheet (quadrangle) covers an area of 7.5' x 7.5' and uses a 1:24,000 map scale in its printed form. US Topos embed georeferencing into each PDF. Georeferencing facilitates (a) display of geographic coordinates of the current mouse pointer position on the map and (b) measurement of distances, perimeters, and areas on the PDF using the Measure tools built into Adobe Reader and Adobe Acrobat. Whereas a related publication, An Introduction to USGS Topo Maps (https://edis.ifas.ufl.edu/publication/fr432), discusses the different USGS topographic map collections, download options, and the layer structure, this publication explains the use of these geospatial readout functions along with a small showcase. It also provides background information about the UTM (Universal Transverse Mercator) grid, which is cast on US Topos as an optional layer and facilitates estimation of UTM point coordinates. This publication is intended for practitioners and an academic audience that is assumed to be familiar with basic principles of cartography, such as map scale, map projections, or geographic coordinates (i.e., latitude, longitude).
Principle of Map Projections
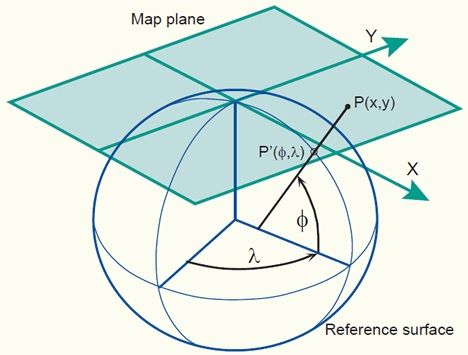
To better understand outputs derived from measuring on US Topo maps, background information about concepts related to mapping and cartography may be helpful. A map projection uses mathematical formulas or geometric procedures to transform locations of a spatial earth model, the so-called reference surface (sphere or ellipsoid), onto a two-dimensional map (Figure 1).
Credit: Knippers (2009)
After the projection, each point on the map can be traced back to a point on the reference surface. However, the opposite does not have to be true. Thus, each point on the reference surface does not necessarily need to be found on the map. For example, the southern hemisphere cannot be mapped in the setup shown in Figure 1. Through the mapping process, points with geographic coordinates (latitude and longitude, denoted, respectively, by the small Greek letter phi [φ] and the small Greek letter lambda [λ]) on a reference surface are mapped onto a flat map with 2D Cartesian coordinates (x/y or easting/northing), as demonstrated for point P in Figure 1. In a Cartesian coordinate system, the coordinate axes enclose a right angle with each other and use the same length units. Having points readily mapped on a planar map with associated 2D Cartesian coordinates simplifies geometric computations (e.g., distances or areas between given points) compared to the same computations conducted on a sphere or ellipsoid. 2D Cartesian coordinates allow one to use equations of plane geometry as opposed to more complex spherical trigonometry computations that are needed when point locations are provided as geographic coordinates. This is one of the main reasons to use map projections.
The surface onto which points of the ellipsoid or sphere are projected must be one that can unfold itself into a plane without distortion. This surface is called a developable surface, and can either be a cone, a cylinder, or a flat plane. Correspondingly, a projection belongs either to the conic, cylindrical, or azimuthal projection family. The projection used in Figure 1 is an example of an azimuthal projection. On the other hand, the Transverse Mercator projection, which is used to cast US Topos and described further below, is a cylindrical projection. Whenever a spherical or ellipsoidal reference surface is transformed to a developable surface during the mapping process, geometric distortions relating to angles, areas, distances, and directions are inevitable. However, different types of map projections come with different kinds of distortion patterns. Thus, a map projection can be selected to avoid or minimize the most disruptive distortions for a given mapping purpose and area (Knippers 2009).
Reference Ellipsoid and Geodetic Datum
Although the illustration in Figure 1 uses a sphere as reference surface, an ellipsoid (also called spheroid) is more often used in map projections due to a better fit to the Earth's shape. Several ellipsoids have been established for various regions of the planet to approximate the surface of the Earth. An ellipsoid can be defined geometrically by two components: its semi-major axis and semi-minor axis (Figure 2). An ellipsoid is formed when an ellipse is rotated about its minor axis. An ellipse used for this purpose is called a meridian ellipse. Once the correct size of an ellipsoid is established for a portion of the Earth, it needs to be attached to the Earth. This means that its location and orientation relative to the Earth need to be defined. All these parameters together (ellipsoid, location, and orientation) define the horizontal geodetic datum (short: horizontal datum), where the ellipsoid used in the definition of a geodetic datum is called a reference ellipsoid. Horizontal datums provide reference for a system of location measurements; thus, point coordinates provided on US Topo sheets reference a horizontal datum. Vertical datums provide reference for elevation measurements and define where zero elevation is. This baseline elevation becomes relevant for the interpretation of contour lines on topographic maps.
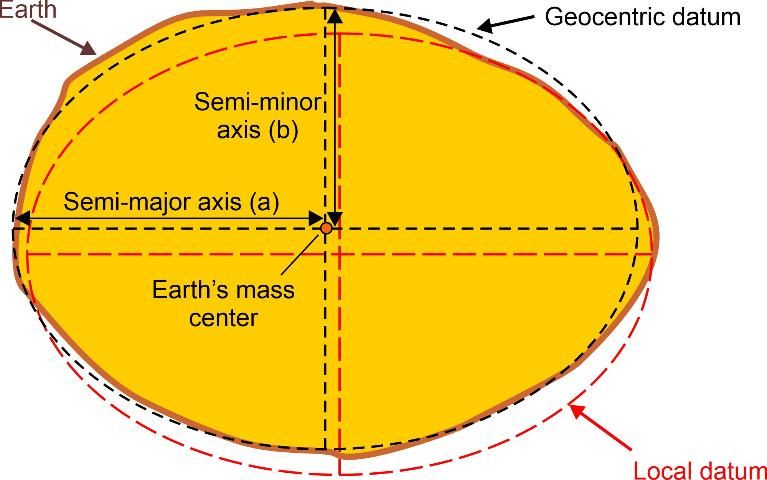
Prior to the widespread adoption of the Global Positioning System (GPS), horizontal datums (hereafter referred to as datums) were attached at one point and specifically oriented to the actual surface of the Earth to fit the mean sea-level surface over a certain part of the Earth. This datum is called a local datum, and the center of the ellipsoid as placed in such a datum does not usually coincide with the Earth's center (Figure 2). An example of a local datum is the North American Datum of 1927 (NAD27). NAD27 uses the Clarke 1866 ellipsoid, which is attached to a selected point in Meades Ranch, Kansas, and has its orientation set numerically towards a nearby station. The tethering of an ellipsoid to one point on the Earth's surface became outdated when sophisticated satellite positioning systems (e.g., GPS) orbited around the center of mass of the Earth and drove the need for a geocentric datum. The center of the ellipsoid associated with a geocentric datum coincides with the Earth's mass center (Figure 2), at least per definition. Examples of such datums include the North American Datum 1983 (NAD83) and the World Geodetic System 84 (WGS84). The initial difference between coordinates from WGS84 as originally provided in 1987 and NAD83 as first introduced in 1986 was so small that the geodetic datums could be considered equivalent. However, for the same point on the surface of the Earth, coordinates today can differ by up to two meters in both datums due to different observations used during subsequent refinements and revisions since the introduction of these datums.
Measure Tools
In the PDF viewer, the geospatial tools are located under the Measure toolbar, which can be accessed through the Tools menu (Figure 3). Within that toolbar, two tools can be used:
- The Geospatial Location Tool opens a window that shows the mouse pointer's position expressed as geographic coordinates (latitude, longitude) in either decimal degrees or degrees-minutes-seconds (D-M-S) format, depending on the readout settings.
- The Measuring Tool offers three types of measurements, which are:
- Distance between two points
- Perimeter (multi-point lines)
- Area (area of a closed polygon)
For each measurement, snapping can be enabled for more precise measurements of map objects. Available snapping types include snapping to paths, endpoints, midpoints, or intersections.
Figure 3 shows the Gainesville East quadrangle with the Mark Bostick Golf Course at the University of Florida highlighted in yellow. To demonstrate the different types of measurements, consider an application scenario where some fairways on this golf course need to be redesigned. For this purpose, approximate dimensions of the golf course are needed, which can be measured from the US Topo map. In Figure 3, the Distance Tool is activated. The tool returns a distance of 902.07 m for the longer of the two golf course diagonals shown in red. Note that while the measurement is listed to the nearest centimeter, its true accuracy is closer to 1–2 meters. This is due to (a) the limited spatial resolution of the underlying aerial image, (b) the screen resolution, which limits the number of pixels that the mouse pointer can be placed on to set the start and end point of the measured line, and (c) the distance distortion associated with the utilized map projection.
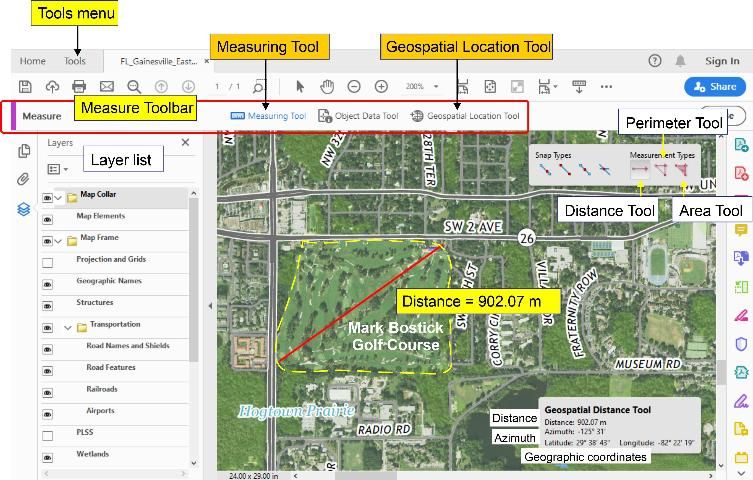
With any of the measurement modes activated on the Measuring Tool, the following information is displayed together with other measurement results as shown in the bottom right of Figure 3:
- Geographic coordinates of the current mouse pointer position expressed as latitude and longitude values in the NAD83/WGS84 geodetic datum. These datums can be assumed identical for a given readout precision of 1–2 meters.
- For the last measured line segment, its azimuth is shown at the same location. The azimuth (or direction) of a line measures the clockwise angle from north to the given line. Depending on the reference north used, different azimuth values result. The azimuth displayed for measurements on US Topos relates to geographic north.
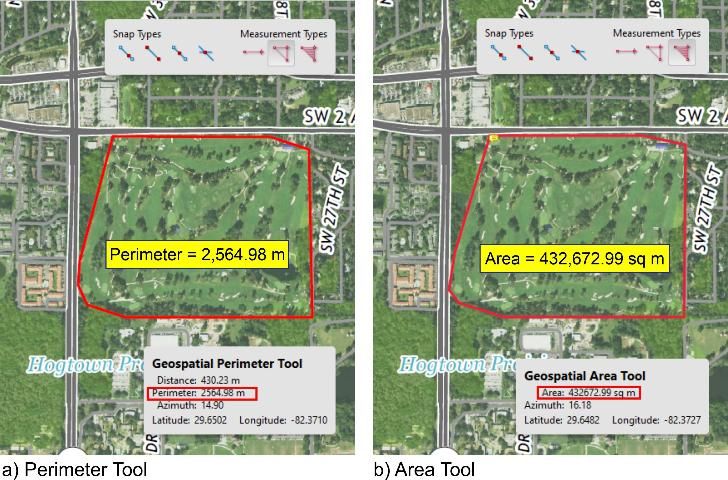
Next, the perimeter of the course is traced with the Perimeter Tool (Figure 4a) and the area is determined using the Area Tool (Figure 4b). This returns a perimeter of 2,564.98 m and an area of 432,672.99 m2, respectively.
One can change display units in the Adobe Measure tools as follows:
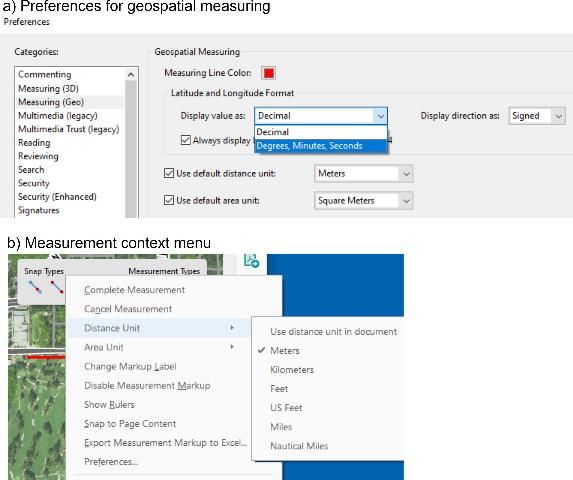
- The first method (Figure 5a) changes the default readout settings under Preferences. This page can be reached from the Adobe menu Edit / Preferences / Measuring (Geo). Coordinate values can be set to display as decimal degrees or D-M-S format, and several unit options (metric and US) are available for distance and area measurements.
- The second method (Figure 5b) is to activate the context menu through a mouse right click while conducting a distance, perimeter, or area measurement. This approach allows changing distance and area units of the current measurement only.
UTM Coordinates
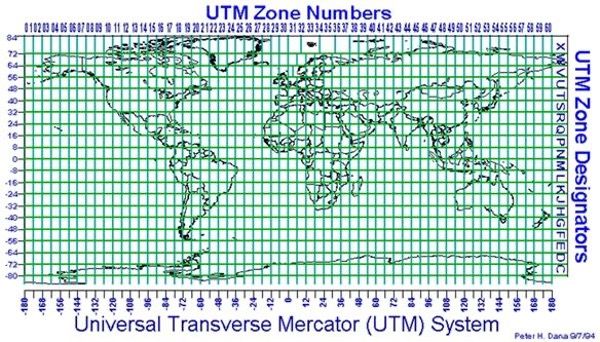
US Topo quadrangles are cast using the Transverse Mercator projection. Mapping the entire world within one map sheet leads to excessive distortions in distance, area, and direction. These excessive distortions would not be acceptable for topographic maps; therefore, the Transverse Mercator projection is applied individually for different zones around the world. This limits map distortions to 1:2,500 at the central meridian of each zone. This system of zones is called the UTM grid system (Figure 6). It employs a series of 60 longitudinal zones in the area between 84° North and 80° South covering the whole world. Each zone is 6° wide in longitude, with a few exceptions north of 56° latitude. In addition, the letter after the zone number designates a latitudinal band. Each zone uses the Transverse Mercator projection, where the central meridian of the projection coincides with the longitudinal center of the zone. Most of Florida falls into UTM Zone 17.
Credit: http://www.jaworski.ca/utmzones.htm
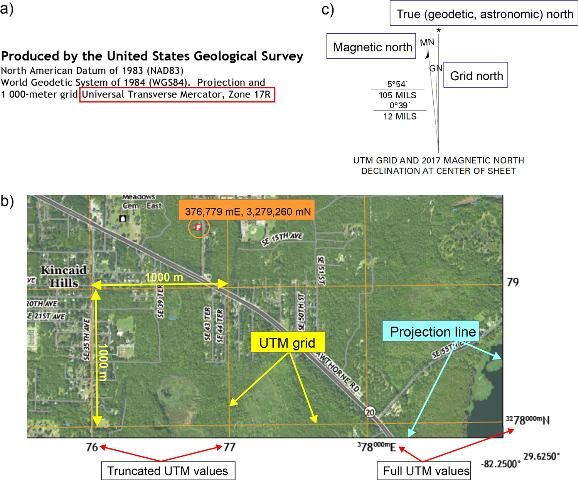
For each US Topo quadrangle, the map margin shows the current UTM zone. Figure 7a shows that the Gainesville East Quadrangle is located in Zone 17R. Each 6° wide UTM zone has an easting value of 500,000 meters for points on the central meridian. This so-called false easting avoids negative easting values within the entire zone. For locations in the northern hemisphere, the equator has a northing value of 0 meters (Campbell 2001). To assist the map reader with assessing a location's UTM coordinates, US Topo quadrangles display a 1000-meter grid reflecting UTM easting and northing coordinates. The 1000-meter grid is aligned with the central meridian of the used UTM zone and shown in orange (Figure 7b). Full UTM easting and northing values are provided on the projection line for the first grid lines in from the northwest and southeast corners of the map, respectively. Thereafter, truncated UTM values consisting of the 10,000 and 1,000 meter digits, are shown for the other grid lines (Figure 7b). Using this UTM grid information together with distances measured on scale bars allows one to estimate the UTM coordinates of a point of interest. For example, the fire station circled in Figure 7c was found to have an easting value of 376,779 m and a northing value of 3,279,260 m.
US Topos include different types of north directions that are shown in the declination diagram (Figure 7c).
- Grid north (GN) describes north-south lines of the plane grid system associated with the map projection. GN runs parallel to the central meridian of the UTM zone used for this US Topo quadrangle.
- True north (*), which is also called geodetic or astronomic north, points towards the north pole and runs along a meridian, as is the case with the western and eastern segments of the projection line of a US Topo quadrangle. The angle between true north and grid north, measured in clockwise direction, is called meridian convergence (γ) (van Sickle 2015). For the Gainesville East Quadrangle, grid north is slightly leaning towards the west (by an angle of 39'), as shown in the declination diagram. This can also be noticed at the bottom of the quadrangle where the east-west UTM grid line at 3,278,000 mN does not not run exactly parallel to the southern portion of the projection line but encloses an angle of 39' with it.
- Magnetic north (MN) points towards the north pole of the Earth's magnetic field. MN is constantly undergoing a slow drifting motion. The deviation of the compass from true north is an angle called declination (or magnetic declination). Declination varies both by geographic location and time. At the center of the Gainesville East quadrangle, the declination is shown to be 5°54' in counter-clockwise direction. The declination has to be taken into account when converting magnetic north to geographic north. Therefore, declination compensation is essential for navigation or orientation tasks in the field where a magnetic compass is used.
Summary
US Topo maps provide a variety of geospatial measurement tools thanks to their built-in georeferencing capabilities. Point coordinate readout is currently limited to geographic coordinates. If additional coordinate systems are necessary, websites such as USGS TopoView or software that uses an online connection to map servers (e.g., Google Earth) can provide these. The same is true for US Topo GeoPDFs published before July 2017 where an Adobe plug-in called TerraGo Toolbar allowed users to toggle between multiple coordinate systems for readout. However, since July 2017, US Topo maps use a different implementation of PDF georeferencing based on the ISO 32000 PDF standard. This new standard limits coordinate functionality at present but is expected to be enhanced in the future. Nevertheless, US Topo maps maintain a clear advantage when downloaded to a user device by providing offline availability in case of data loss in the field and standard access to numerous data layers not found in typical web mapping applications.
Web Resources
US Topo Map Users Guide
National Map Download Client
https://apps.nationalmap.gov/downloader/
USGS Store Map Locator
USGS TopoView
https://ngmdb.usgs.gov/topoview/
How Universal Transverse Mercator (UTM) Works
https://gisgeography.com/utm-universal-transverse-mercator-projection/
Literature Cited
Campbell, J. 2001. Map Use & Analysis (4th ed.). New York, NY: McGraw-Hill.
Knippers, R. 2009. Geometric Aspects of Mapping. https://kartoweb.itc.nl/geometrics/
van Sickle, J. 2015. GPS for Land Surveyors (4th Ed.). CRC Press. https://doi.org/10.1201/b18480