Citrus Leaf Sampling Procedures for Nutrient Analysis

Tripti Vashisth, Jamie D. Burrow, Davie Kadyampakeni, and Rhuanito S. Ferrarezi


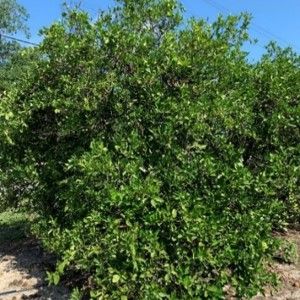
Figure 1. Select the trees that represent the grove health status.
Figure 1.  Select the trees that represent the grove health status.


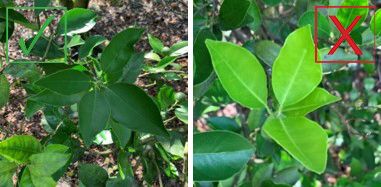
Figure 2. Collect fully expanded leaves with no obvious disease or pest damage.
Figure 2.  Collect fully expanded leaves with no obvious disease or pest damage.


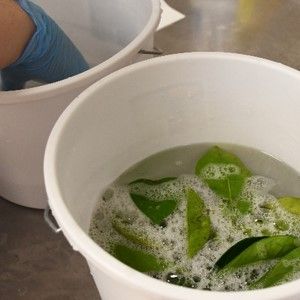
Figure 3. Wash and air-dry leaves the day of collection.
Figure 3.  Wash and air-dry leaves the day of collection.


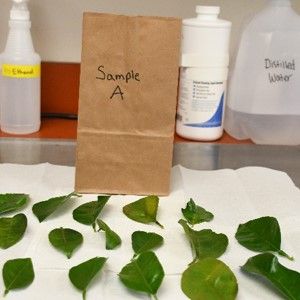
Figure 4. Send leaves to laboratory in a paper bag.
Figure 4.  Send leaves to laboratory in a paper bag.


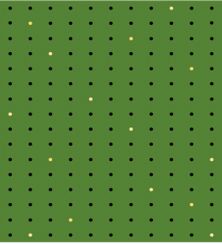
Figure 5. Analyze the block and randomly select trees for good representation of the entire block.
Figure 5.  Analyze the block and randomly select trees for good representation of the entire block.


Goal

  • To assess trees' nutritional requirements to maintain balanced nutrients for optimum tree growth

  • To prevent any nutrient deficiency or toxicity that can compromise tree health and yield or reduce revenue

Timing

  • Leaf nutrient concentrations continually change throughout the year; therefore, timing of the leaf sampling process is critical.

  • The best time to collect is July and August, targeting 4-to-6-month-old spring flush.

Procedure

  • Grove area should be 20 acres or less.

  • Each sample set should be the same variety and rootstock that has received the same fertilization plan.

  • Leaves should be a representation of the entire grove; gather 100 leaves from nonfruiting twigs from 15 to 20 uniform trees, selected randomly.

  • Label a clean, new paper bag with information to reference when results are received.

  • Wash leaves soon after collection. Do not let the leaves get dehydrated before washing.

  • Wash and air-dry leaves the day of collection.

  • If you are not able to wash on the day of leaf sample collection, store in the refrigerator overnight.

  • Using thumb and forefinger, rub the leaves gently while soaking in mild detergent solution, and then thoroughly rinse with clean water.

Examples
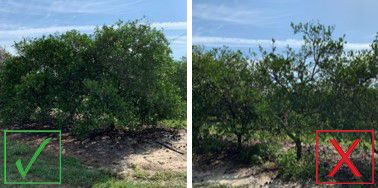
 

Figure 6. Collect samples from healthy-looking trees.
Figure 6.  Collect samples from healthy-looking trees.


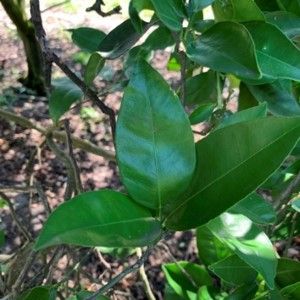
Figure 7. Collect healthy-looking, 4-to-6-month-old leaves from nonbearing twigs.
Figure 7.  Collect healthy-looking, 4-to-6-month-old leaves from nonbearing twigs.


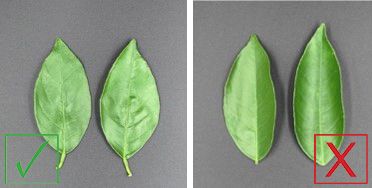
Figure 8. Leave petiole attached.
Figure 8.  Leave petiole attached.


Additional Suggestions for HLB-Affected Trees

Sampling from HLB-Affected Trees


Sampling from HLB-Affected Trees

  • Because the majority of trees (if not all) have HLB, the leaf nutrient sampling should be done from trees that are representative of the grove.

  • Severely declining trees should not be considered for nutrient analysis.

  • Fully expanded, average-size leaves should be collected; don't collect small leaves or leaves with psyllid damage.

When to Sample

  • HLB-affected trees perform better under a good fertilizer program. Sampling three to four times per year is suggested so that you have enough time to adjust the fertilizer program to address tree nutrient needs.

  • The below guidelines for leaf nutrients are for 4-to-6-month-old spring flush leaves; therefore, the table cannot be used as the sole guide for leaf nutrient sampling conducted throughout the year.

  • Sample after a month if a soil-applied program was applied, or two weeks after foliar fertilization.

  • Take 1–2 sample sets per 10-acre block.


Table 1. 

Guidelines for interpretation of orange tree leaf analysis based on 4-to-6-month-old spring flush leaves from nonfruiting twigs.

Element

Unit of Measure

Deficient

Low

Optimum

High

Excess

Suggested Range for

HLB3

N

%

<2.2

2.2–2.4

2.5–2.7

2.8–3.0

>3.0

2.6–2.9

P

%

<0.09

0.09–0.11

0.12–0.16

0.17–0.30

>0.30

0.14–0.23

K

%

<0.7

0.7–1.1

1.2–1.7

1.8–2.4

>2.4

1.5–2.10

Ca

%

<1.5

1.5–2.9

3.0–4.9

5.0–7.0

>7.0

3. 5–6.00

Mg

%

<0.20

0.20–0.29

0.30–0.49

0.50–0.70

>0.70

0.35–0.60

Cl

%

<0.2

0.20–0.70

>0.701

4

Na

%

0.15–0.25

>0.25

4

Mn

mg/kg or ppm2

<18

18–24

25–100

101–300

>300

50–150

Zn

mg/kg or ppm

<18

18–24

25–100

101–300

>300

50–150

Cu

mg/kg or ppm

<3

3–4

5–16

17–20

>20

10–18

Fe

mg/kg or ppm

<35

35–59

60–120

121–200

>200

90–160

B

mg/kg or ppm

<20

20–35

36–100

101–200

>200

68–150

Mo

mg/kg or ppm

<0.05

0.06–0.09

0.10–2.0

2.0–5.0

>5.0

4

1 Leafburn and defoliation can occur at Cl concentration >1.0%;

2 ppm = parts per million;

3 These are suggestions for HLB-affected trees based on field observations; these ranges have not been scientifically proven yet.

4 Unknown for HLB-affected trees; use healthy optimum range.


Sources: Obreza, T. A., and K. T. Morgan (eds.). Nutrition of Florida Citrus Trees. Second Edition. SL253. https://edis.ifas.ufl.edu/ss478; Obreza, T. A., M. Zekri, E. A. Hanlon, K. Morgan, A. Schumann, and R. Rouse. Soil and Leaf Tissue Testing for Commercial Citrus Production. SL253.04. https://edis.ifas.ufl.edu/ss531


Footnotes

1. This document is HS1355, one of a series of the Horticultural Sciences Department, UF/IFAS Extension. Original publication date February 2020. Visit the EDIS website at https://edis.ifas.ufl.edu for the currently supported version of this publication.
2. Tripti Vashisth, assistant professor, Horticultural Sciences Department; Jamie D. Burrow, Extension program manager; Davie Kadyampakeni, assistant professor, Department of Soil and Water Sciences, UF/IFAS Citrus Research and Education Center; and Rhuanito S. Ferrarezi, former assistant professor, Horticultural Sciences Department, UF/IFAS Indian River Research and Education Center; UF/IFAS Extension, Gainesville, FL 32611.