This article introduces manual and automatic counting techniques using ImageJ, an open-source image processing program (Figure 1). Counts (e.g., number of leaves, fruits, seeds, or plants) are a common type of data gathered in horticultural research. In many instances, using ImageJ can increase the ease and accuracy of gathering count data. When image processing can easily separate objects of interest from the background, automatic counting with ImageJ can eliminate tedious manual counting processes. Furthermore, additional plant growth data, such as leaf area, plant width, and canopy area, can be collected from the same image. The image processing and analysis techniques introduced in this article are easily accessible and simple to use and thus can be adopted by users who have a limited background in image analysis. This article is part of a series introducing various image-based measurements with ImageJ for horticultural research. The tutorial video for this article is available at the UF IFAS Horticultural Crop Physiology Lab YouTube channel (https://youtu.be/iqOgbf9nDPQ). Other ImageJ tutorial videos are also available at https://www.youtube.com/playlist?list=PL4qrjj3jZ6i568ToiUV-DvAsQ0Gyb30hK. The intended audience for this article includes researchers, UF/IFAS Extension faculty, students, certified crop advisors, and crop consultants.
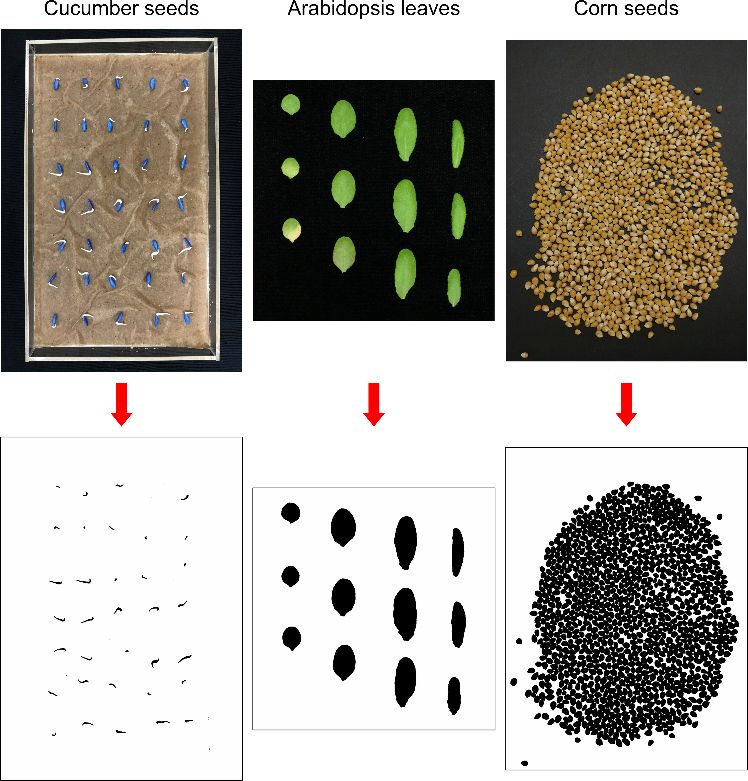
Introduction
Counting the number of plants or specific plant tissues is often performed in horticultural research. For example, seed germination is determined by counting the number of germinated seeds over time. Seedling emergence is calculated similarly to seed germination. Flower and fruit number provide important information to forecast crop yields or to study reproductive phenology.
ImageJ is an open-source image processing program in which many custom plugins are available to solve various image processing and analysis problems. ImageJ can improve the ease, accuracy, and speed of count measurements in many cases. When image processing can easily separate objects of interest from the background, automatic counting with ImageJ is extremely fast and can eliminate tedious manual counting processes. When image processing for automatic counting is not feasible, counter tools in ImageJ can be used to facilitate easy manual counting. ImageJ is also capable of collecting various plant growth measurements, such as leaf area, plant width, and canopy area (Agehara 2020), allowing count and additional growth data collection from the same image simultaneously.
This article introduces simple image processing and analysis techniques for manual and automatic counting using ImageJ. In the following sections, we will demonstrate different techniques step by step using the following examples: seed germination, flower and fruit counts, leaf counts, and seed counts. The advantages and disadvantages of the techniques introduced in this article are listed below.
Advantages
- Automatic counts can eliminate tedious manual counting processes and can also provide other valuable data about each object counted (e.g., total number of leaves, area of each leaf).
- ImageJ counter tools can label the counted objects and eliminate the problem of "losing track" during the counting process.
- Multiple measurements can be performed on the same image (e.g., leaf counts, flower counts, fruit counts).
- Cost and tools needed are minimal—you only need an image-capturing device (digital camera, smartphone, or scanner) and ImageJ.
- Images themselves are very good visual data.
- Photographs can be saved with metadata, such as geolocation, date, and time, automatically.
Disadvantages
- Image-based counts can only count what is visible in the picture (e.g., fruit hidden by the plant canopy cannot be counted).
- Accuracy of measurements can be affected by the image quality.
- Using ImageJ for image processing and analysis requires some basic computer literacy and the installation of a compatible version of Java software (https://www.java.com/en/download/).
Download ImageJ Software
- Go to https://imagej.net/Fiji/Downloads.
- Select your platform (Mac/Linux/Windows) and click on the appropriate link.
- Install the program.
Note: Fiji is a version of ImageJ bundled with many plugins. We will need the cell counter plugin to perform manual counts.
Example 1: Seed Germination
This example will use a photograph of cucumber seeds sown in an acrylic tray. The photograph was taken using an iPhone 7 smartphone. In this example, we will count the number of seeds with emerged radicles using the automatic count feature in ImageJ.
- Import the image: Go to "File > Open" and navigate to the image or drag the file onto the ImageJ toolbar.
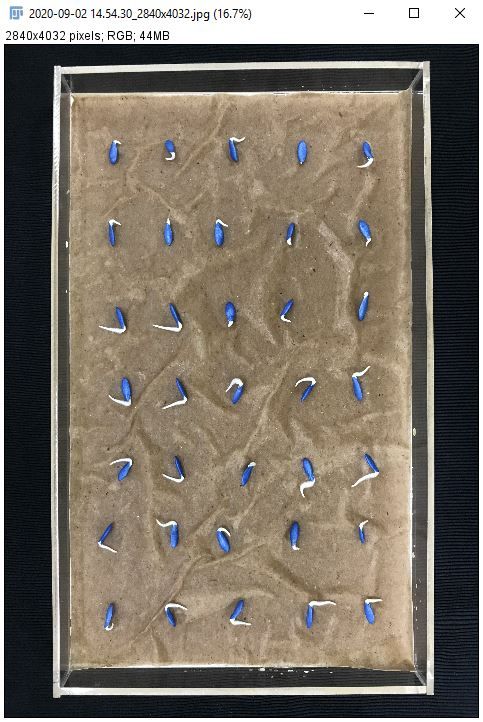
Credit:
2. Click the "Rectangle" tool (highlighted below).

Credit:
3. Select the smallest rectangle possible around the seeds.
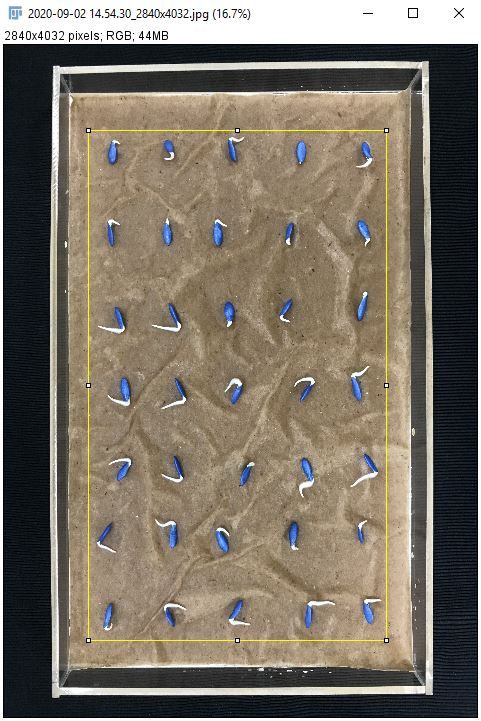
Credit:
4. Go to "Image > Crop."
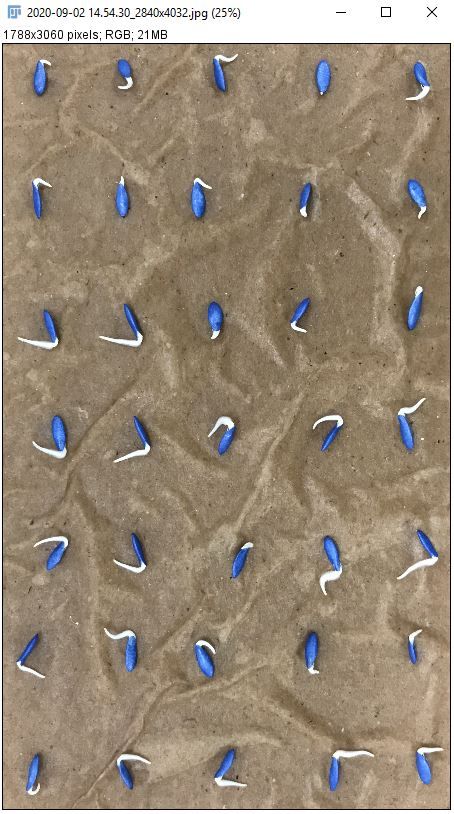
Credit:
5. Go to "Image > Adjust > Color Threshold" to select radicle area.
i. Adjust color threshold parameters (hue, saturation, and brightness).
Note: In this image, hue between 0 and 255, saturation between 0 and 25, and brightness between 220 and 255 works well.
ii. Click on "Select."
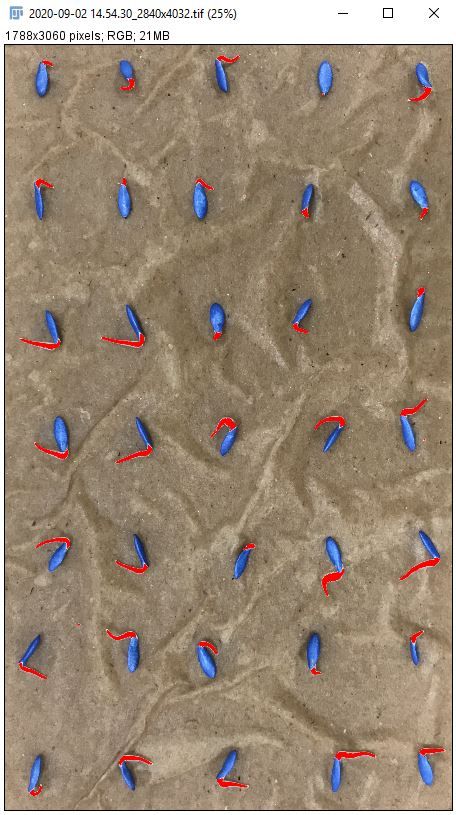
Credit:
6. Go to "Process > Binary > Make Binary" to convert the color image to a binary image.
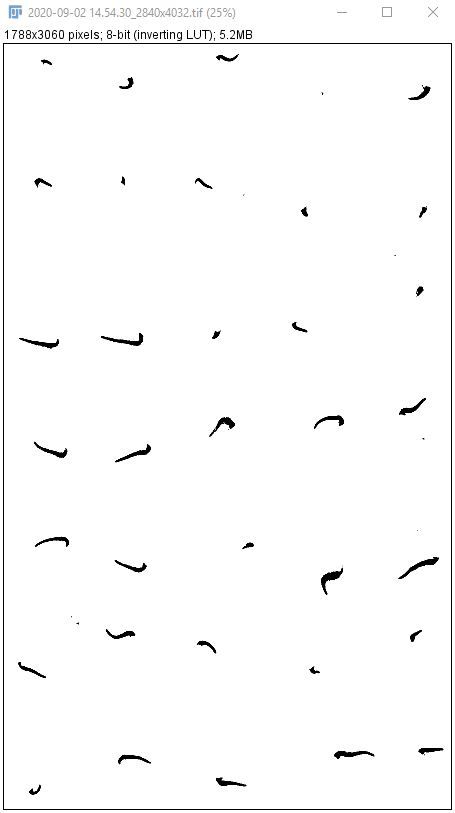
Credit:
7. Use the "Paintbrush Tool" to remove large clusters of pixels that are not seedling radicles.
i. Open the original image.
Note: This step is easiest when comparing the binary image to the original.
ii. Double click the "Paintbrush Tool" (highlighted below).
iii. Select the following parameters.

Credit:
- Brush width: 100
- Color: White
- Paint on overlay: Unchecked
iv. Click on "OK" and erase the pixels that are not seedling radicles.
8. Determine the size of the smallest pixel cluster to count. This can be done by two methods:
Method #1: Use the "Rectangle" tool to measure the smallest emerged radicle.
i. Go to "Analyze > Set Measurements" and select "Area" and "Limit to threshold."
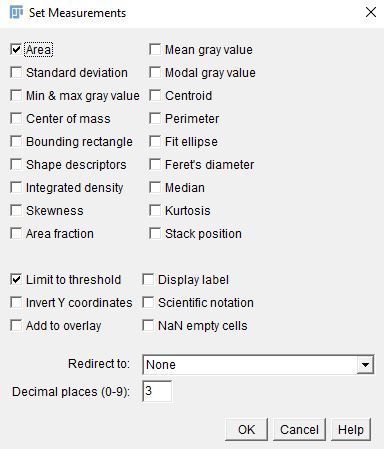
Credit:
ii. Click on "OK."
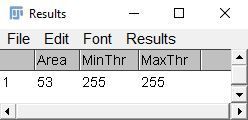
iii. Click the "Rectangle" tool and select the area of the smallest emerged radicle.
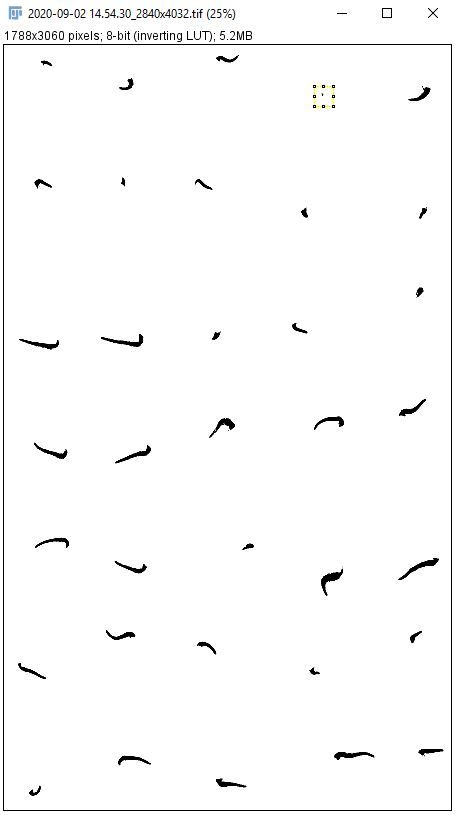
Credit:
iv. Go to "Analyze > Measure" or Ctrl+M to measure the radicle area.
Credit:
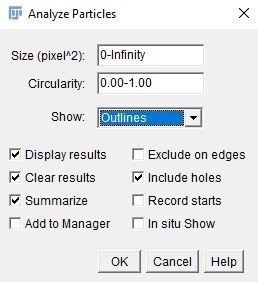
Method #2: Use "Analyze > Analyze Particles" to measure all the pixel clusters.
i. Enter the following parameters.
- Size (unit^2): 0–Infinity.
- Circularity: 0.00–1.00
- Show: Outlines
Note:
- The "Size" option defines the range of pixel cluster sizes to include in the analysis. We include the full range of sizes so all pixel clusters are recorded.
- The "Circularity" option excludes pixels by roundness by setting the minimum and maximum circularity. Zero is not round at all and 1 is a perfect circle.
- The "Show" option provides multiple possible visual outputs. We chose "Outlines" because it assigns a visible number to each pixel cluster for easy identification.
ii. Select the options checked in the image below.
iii. Click on "OK."
Credit:
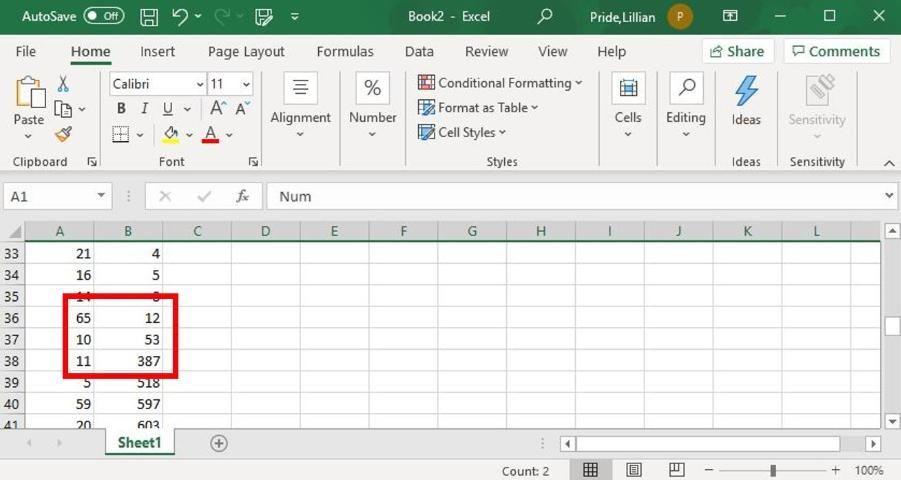
iv. Copy all the results from the "Results" table into Excel.
v. Insert a row at the top of the Excel sheet and label the first column "Num" and the second column "Area."
vi. Select the top row.
vii. In Excel, go to "Home > Editing > Sort & Filter > Filter."
viii. Click the carrot next to "Area" and select "Sort Smallest to Largest."
ix. Find the section in the sorted Excel sheet where there is a big jump in area values.
Credit:
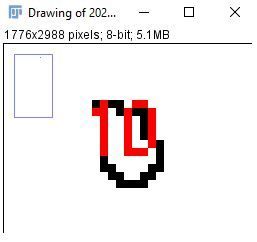
x. Confirm that the value you suspect to be the smallest radicle is a radicle by zooming in on the image to find the numbered pixel cluster.
Note: ImageJ numbers from the upper left to the lower right.
Credit:
Note: Method #1 is the simpler method when there are only a few items to count. Method #2 is more reliable when there are many items to count.
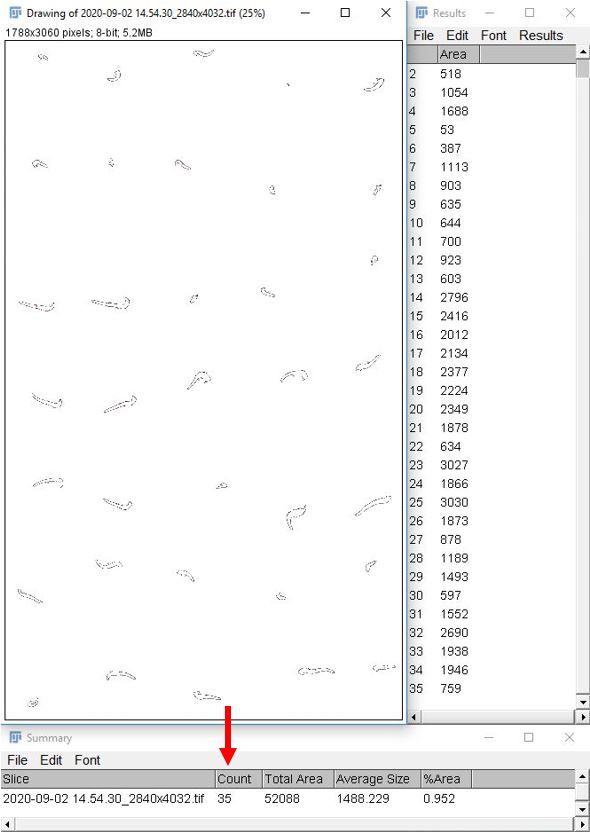
9. Go to "Analyze > Analyze Particles" to count the number of seed with emerged radicles.
i. Enter the following parameters.
- Size (unit^2): 53–Infinity.
- Circularity: 0.00–1.00
- Show: Outlines
Note: Because we know the smallest pixel cluster we want is 53 pixels^2, we adjusted the minimum value under the "Size" option to be 53.
ii. Click on "OK."
10. Record the desired information from the "Summary" and "Results" tables. The number of seeds with emerged radicles is in the "Summary" table under the "Count" column, indicated by a red arrow in the image below.
Credit:
Example 2: Flower and Fruit Count Measurements
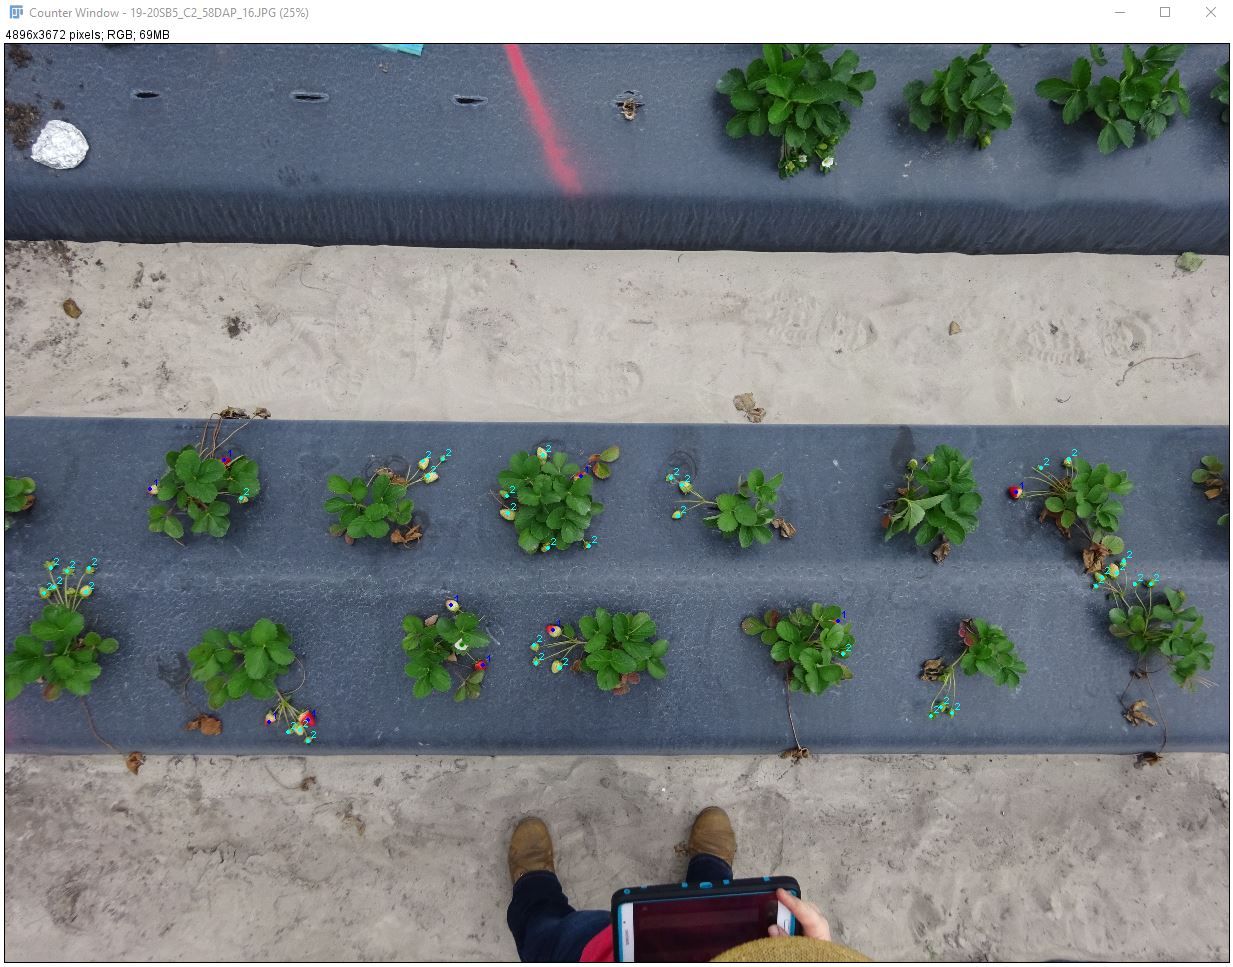
This example will use a photograph of strawberry plants in the field. The photograph was taken using a compact digital camera (SONY DSC-RX100) in the middle of a cloudy day. In this example, we will count the number of strawberries turning red, unripe (white) strawberries, and flowers in the photograph using one of Fiji's manual count plugins. This method minimizes time in the field and eliminates the problem of losing track during the counting process. These advantages are especially important when count number is high.
- Import the image: Go to "File > Open" and navigate to the image or drag the file onto the ImageJ toolbar.
Credit:
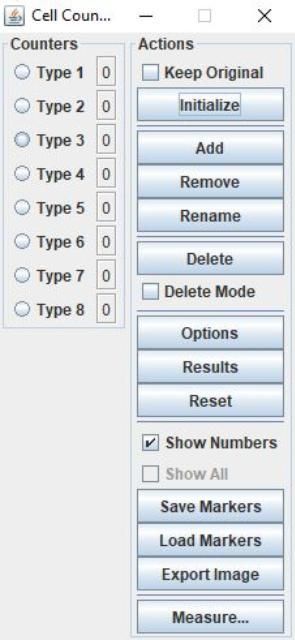
2. Go to "Plugins > Analyze > Cell Counter > Cell Counter" to count the red fruit, white fruit, and flowers.
Credit:
i. Click on "Initialize."
ii. Select "Counters > Type 1."
iii. Click on all the fruit with some red coloration.
Note:
- ImageJ will assign the "Counters > Type 1" number 1 to each fruit while "Type 1" is active.
- If you miss a fruit, you can always select "Counters > Type 1" again later and select the missing fruit.
- To delete a selection, select "Delete Mode" and click the selection.
iv. Select "Counters > Type 2."
v. Click on all the white fruit.
vi. Select "Counters > Type 3."
vii. Click on all the flowers.
Note:
- If the default number of counters is too few for the number of count categories, click on "Add."
- To easily transfer the count results from ImageJ to another program like Excel, click on "Results" and copy and paste the results.

Credit:
Example 3: Leaf Count and Area Measurements
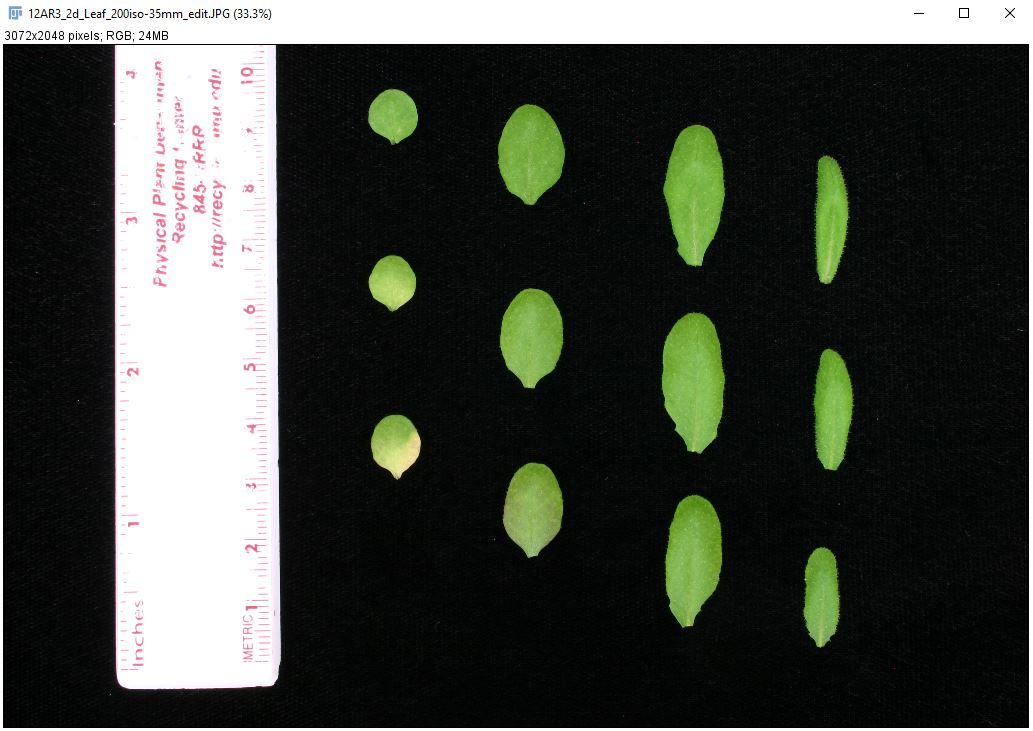
This example will use a scanned image of Arabidopsis leaves. The picture was taken with indoor lighting using a Canon EOS Digital Rebel. In this example, we will count the total number of Arabidopsis leaves and obtain the area of each leaf using the automatic count feature in ImageJ. This method is particularly useful when collecting both leaf number and area data, and when leaves are small.
- Import the image.
Credit:
Note: ImageJ labels objects in order from the upper left corner to the lower right corner. Arrange the leaves in the order you want them labeled. This eliminates the need to resort the data.
2. Select the "Straight Line" tool (highlighted below).

Credit:
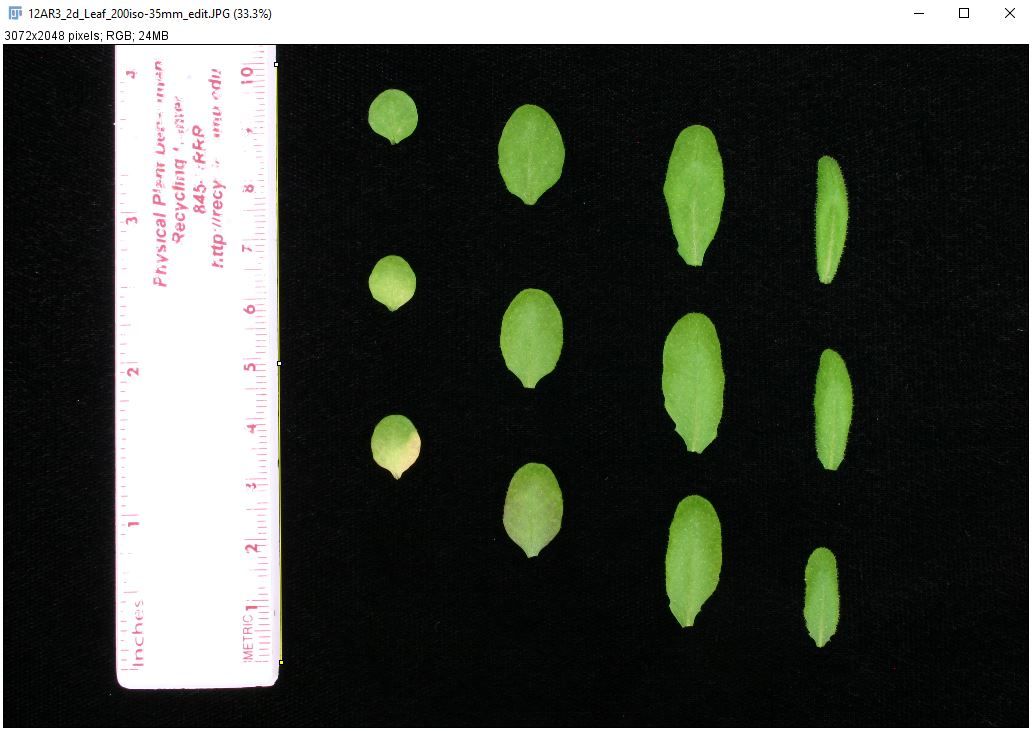
3. Draw a line to an object of known size (e.g., ruler).
Note: It might be helpful to zoom in on the ruler. If your mouse has a scroller, hold "Shift" or "Ctrl" and scroll to zoom in or out. You can also use "+" and "-" to zoom in and out, respectively.
Credit:
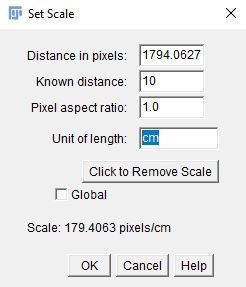
4. Go to "Analyze > Set Scale" to set the distance to the line.
i. Enter the following parameters (e.g., ruler length = 10 centimeters).
- Known distance: 10
- Unit of length: cm
- Global: Unchecked
Credit:
ii. Click on "OK."
Note:
- For accurate image size calibration, the reference object should be large and near the object of interest.
- When the "Global" option is checked, the same image calibration will be applied to images that will be imported subsequently. Use this option when the same image needs to be imported multiple times to perform different sets of image analysis or when all images in a set have the same scale (e.g., scanned images, images taken using a tripod). When working on an image with a different scale, "Set Scale" must be done again.
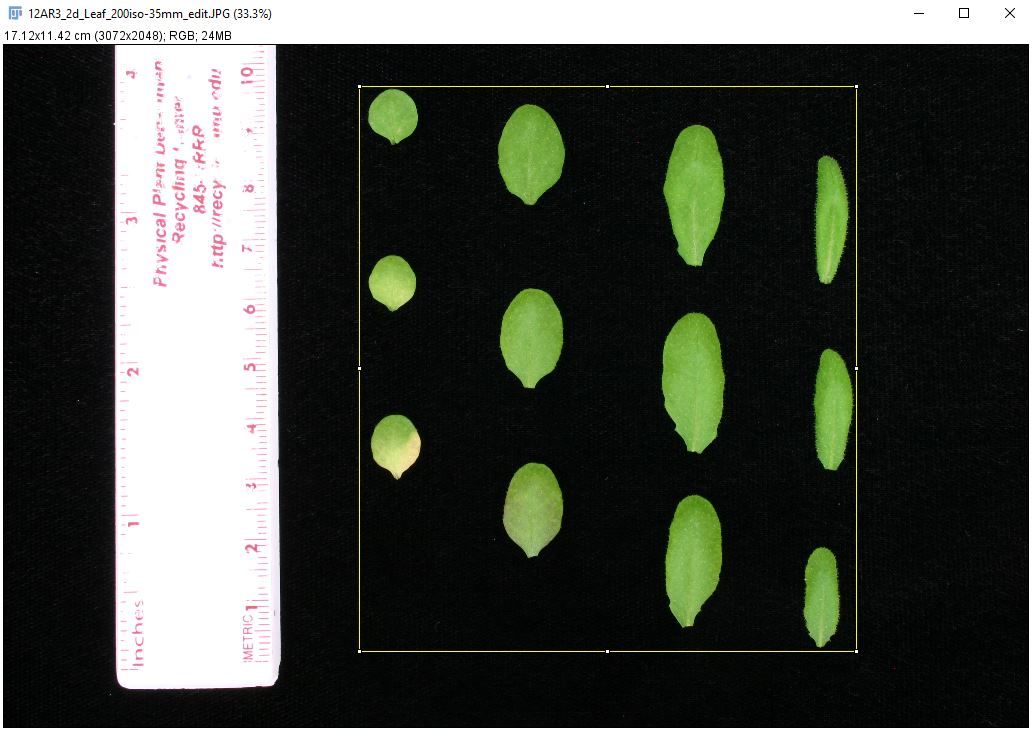
5. Click the "Rectangle" tool.
6. Select the smallest rectangle possible around the leaves.
Credit:
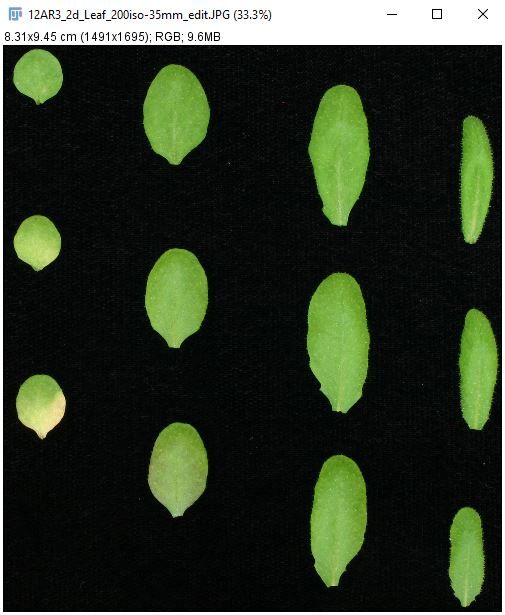
7. Go to "Image > Crop."
Credit:
8. Go to "Image > Adjust > Color Threshold" to select leaf area.
i. Adjust color threshold parameters (hue, saturation, and brightness).
Note: In this image, hue between 30 and 135, saturation between 0 and 255, and brightness between 80 and 255 works well.
ii. Click on "Select."
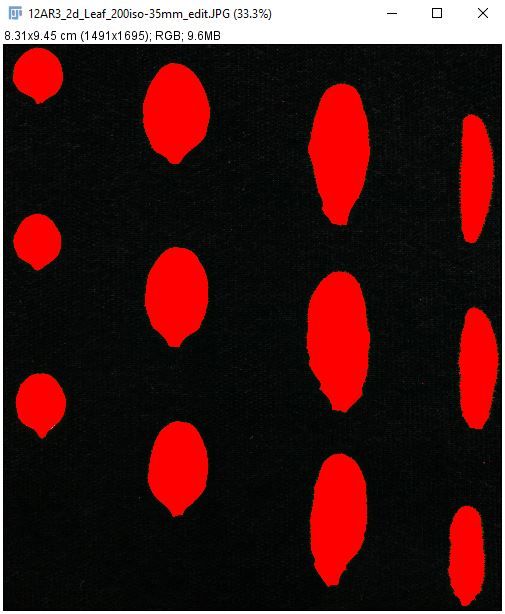
Credit:
9. Go to "Process > Binary > Make Binary" to convert the color image to a binary image.
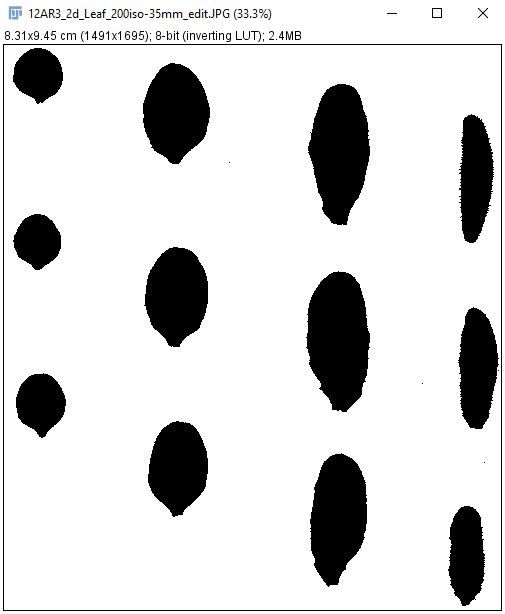
Credit:
10. Go to "Analyze > Analyze Particles" to count the leaves and to measure the individual area of each leaf.
i. Enter the following parameters.
- Size (unit^2): 0.1–Infinity.
- Circularity: 0.00–1.00
- Pixel units: Unchecked
- Show: Outlines
ii. Select the options checked in the image below.
iii. Click on "OK."
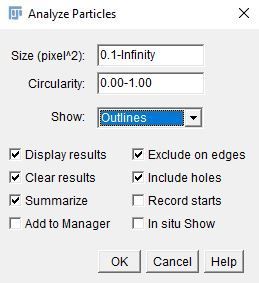
Credit:
11. Record the desired information from the "Summary" and "Results" tables. The individual leaf area data are in the "Results" table, indicated by a red arrow in the image below.
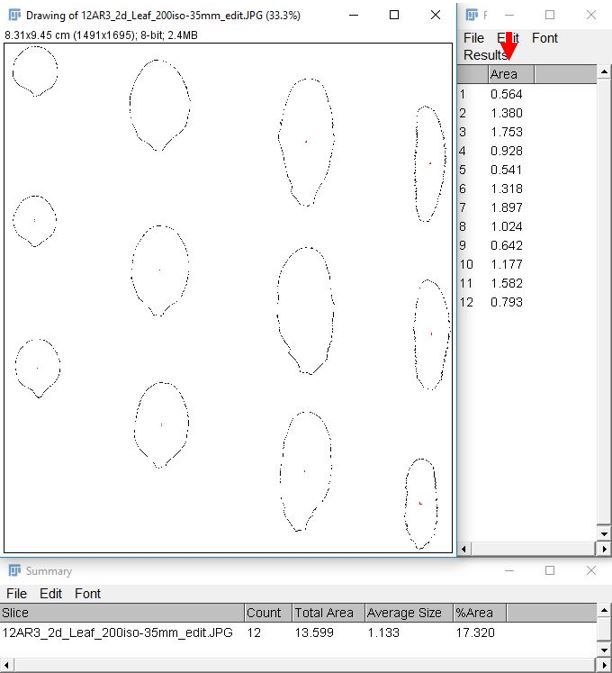
Credit:
Note: Leaf areas can be copied directly from the "Results" table into Excel.
Example 4: Seed Count Measurement
This example will use a photograph of corn seeds. The photograph was taken using an LG-H872 smartphone. In this example, we will count the total number of corn seeds using the automatic count feature in ImageJ.
This technique also works with smaller seeds, such as tomato, spinach, and mustard seeds. Regardless of the seed size, the best results are obtained when images are captured on a high-contrast background. It is also important to spread the seeds evenly in a single layer.
- Import the image.
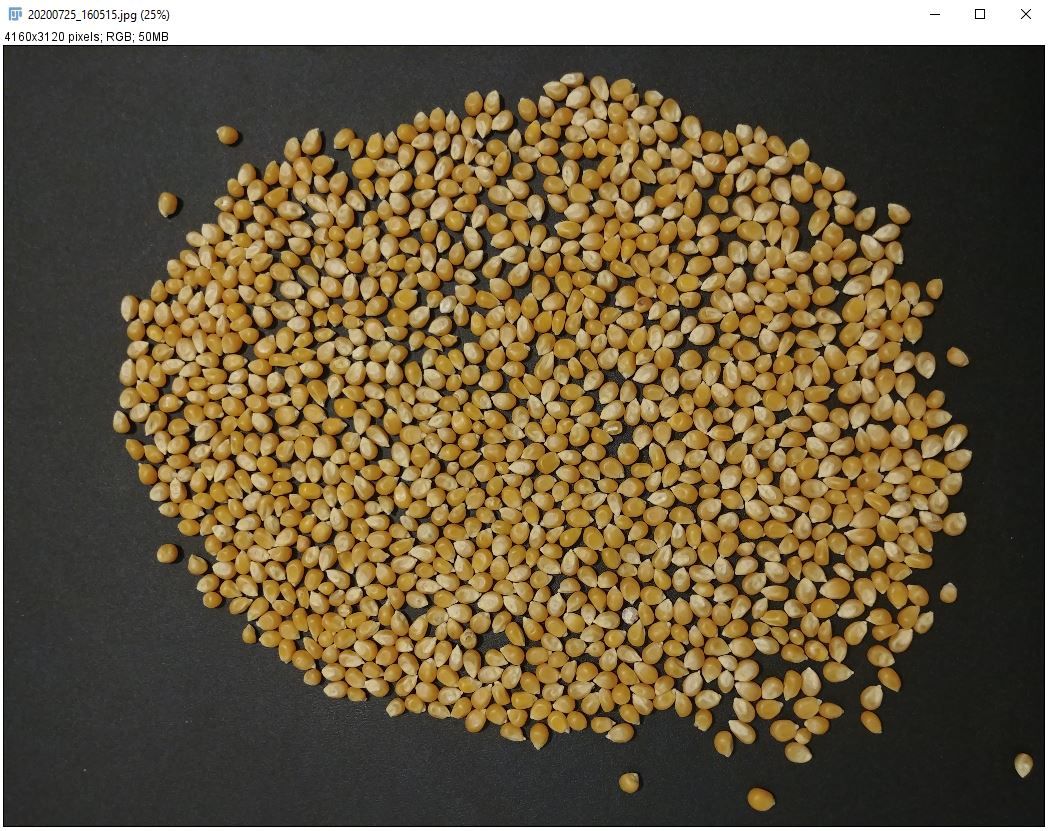
Credit:
2. Go to "Image > Adjust > Color Threshold" to separate the seed from the background.
i. Adjust color threshold parameters (hue, saturation, and brightness).
Note: In this image, hue between 0 and 55, saturation between 0 and 255, and brightness between 90 and 255 works well.
ii. Click on "Select."
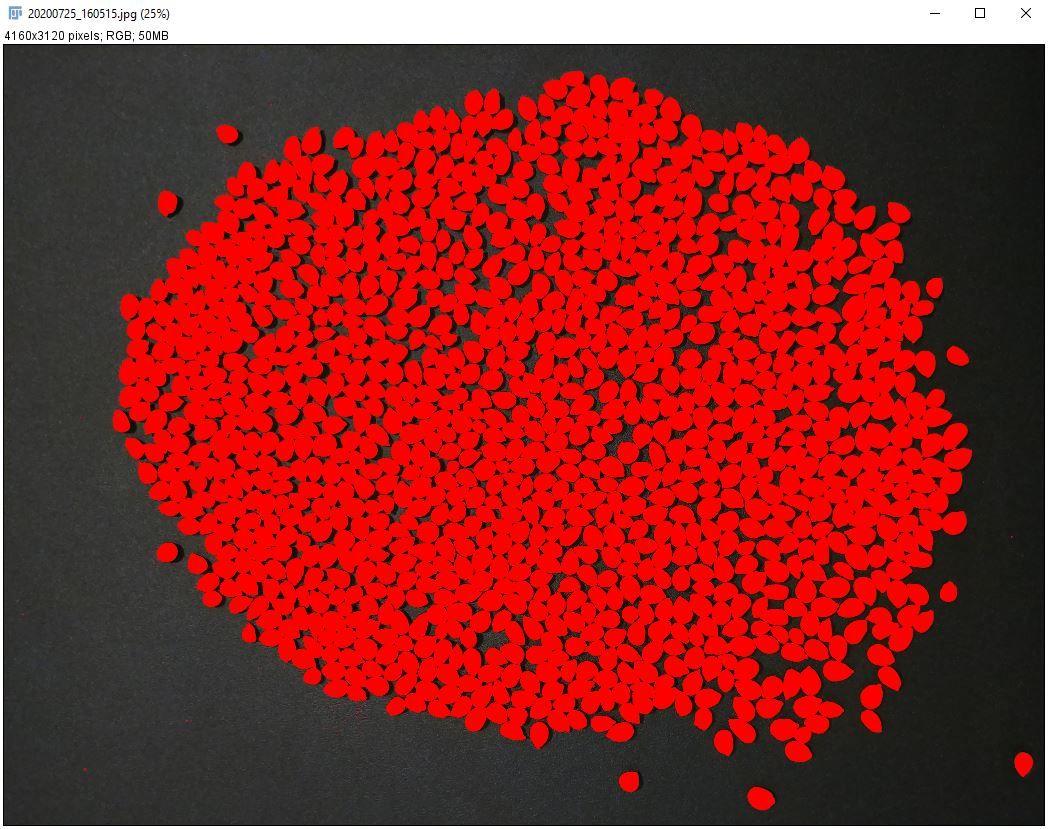
Credit:
3. Go to "Process > Binary > Make Binary" to convert the color image to a binary image.
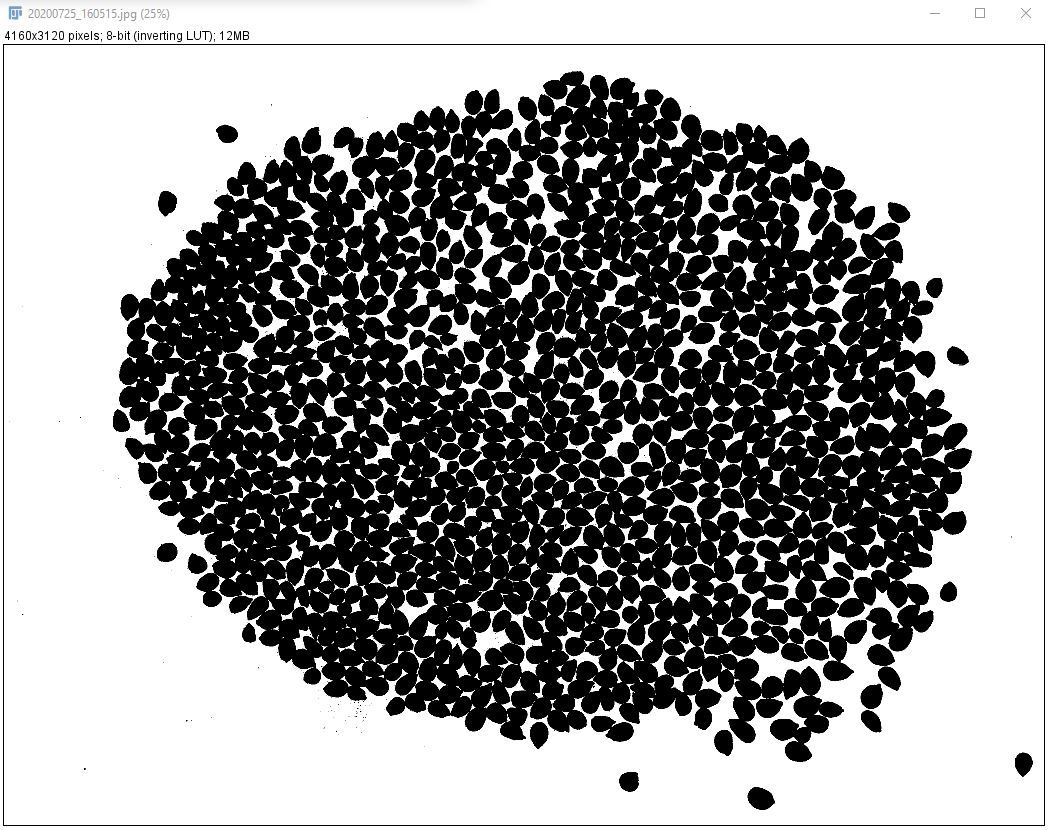
Credit:
4. Go to "Process > Binary > Watershed" to put a 1-pixel line between kernels.
5. Use Method #2 under step 8 of Example 1 to identify the size of the smallest pixel cluster to count.
6. Go to "Analyze > Analyze Particles" to count the kernels and to measure the individual area of each kernel.
i. Enter the following parameters.
- Size (unit^2): 1331–Infinity.
- Circularity: 0.00–1.00
- Show: Outlines
ii. Click on "OK."
7. Record the desired information from the "Summary" and "Results" tables. The count data are in the "Summary" table, indicated by a red arrow in the image below.
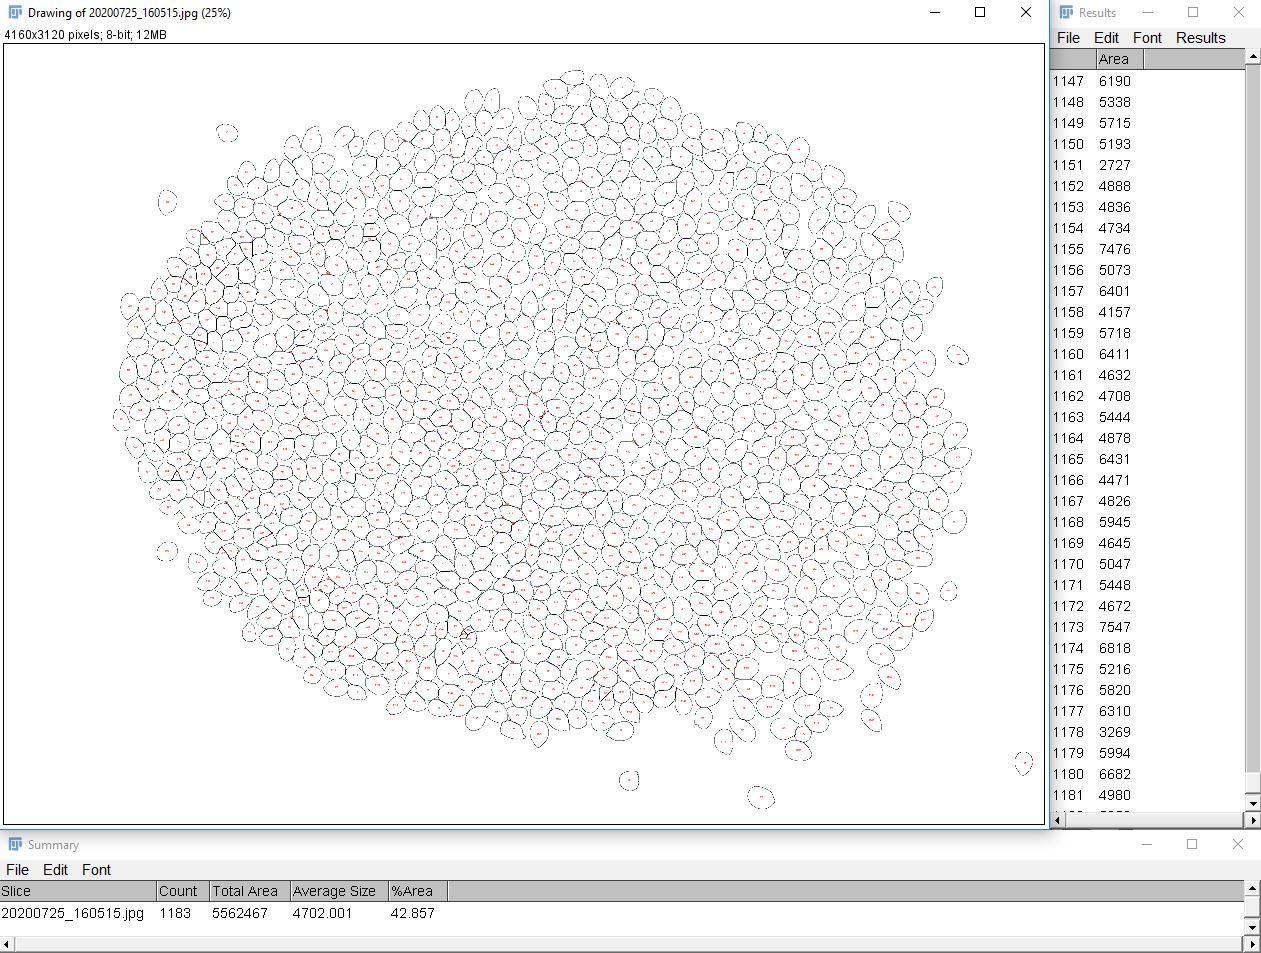
Credit:
Literature Cited
Agehara, S. 2020. Simple Imaging Techniques for Plant Growth Assessment. HS1353. Gainesville: University of Florida Institute of Food and Agricultural Sciences. https://doi.org/10.32473/edis-hs1353-2020