Introduction
Turfgrasses are used in urban areas to provide multiple benefits to society and the environment. They cover millions of acres of home lawns, commercial properties, roadsides, parks, etc. An important question is whether turfgrasses are properly managed. Many critics emphasize that turfgrasses demand too much urban water in a time when water resources are scarce. While indoor water use remains fairly constant throughout the year, outdoor water use increases during the spring and summer (DeOreo et al. 2016). Flattening the peak demand is an objective of water agencies (Beard and Kenna 2006), and better irrigation management may result in less fertilizer and pesticide use, which would be better for the environment.
Urban landscape irrigation is one of the largest growing water use sectors in Florida. The state's water management districts have been working collectively to find ways to assist urban water users to irrigate more efficiently and to enhance planning and regulatory programs in order to conserve water. There is adequate research information to make specific recommendations, such as the specific cultural practices or systems approaches that could be applied to decrease turfgrass water use. Those recommendations could be used immediately to conserve water and maintain turfgrass quality and its functional benefits to society.
The calculation of net irrigation requirements for turfgrass is essential for determining water allocation and can help scientists and irrigation managers to determine irrigation scheduling. This Net Irrigation Requirements for Florida Turfgrass Lawns series explains the process of estimating net irrigation requirements for Florida turfgrasses. The process used here gives a long-term (30-year) historical analysis of turfgrass monthly net irrigation requirements. The first article in the series explains how the weather data were gathered and checked for quality; this second article shows the calculation of evapotranspiration for selected sites throughout the state (plus one in Alabama, to cover the west side of the Florida Panhandle); and the third and final article outlines the results of the net irrigation estimation. Since Florida's urban landscape water demand is expected to grow considerably over the next few decades, the use of current information in terms of turfgrass irrigation needs will provide urban irrigators with information to help them reduce the amount of water applied, conserve water, and reduce water bills.
Evapotranspiration is the process by which water is transferred from the land to the atmosphere by evaporation, from the soil and other surfaces, and by transpiration from plants (Jensen et al. 1990). Reference evapotranspiration (ETo) is the evapotranspiration rate from a reference surface that is well watered and affected only by climatic parameters (Allen et al. 1998). It can be calculated using the Environmental & Water Resources Institute of the American Society of Civil Engineers (ASCE-EWRI) standardized method (Allen et al. 2005), which requires inputs from daily weather data parameters such as incoming solar radiation, air temperature, relative humidity, and wind speed (Allen et al. 1998). Evapotranspiration is greater in areas exposed to full sun than in shaded conditions. Plants transpire more when the temperature is high because high temperatures dry the air and create a larger gradient in vapor pressure between the air and the leaf (Shearman and Beard 1973). Plant water use increases on windy days and also increases when relative humidity decreases (Huang 2006).
Weather conditions may vary throughout Florida. We evaluated this variability in terms of ETo variation in specific locations. This information could be valuable for urban water managers as managing water becomes a higher priority for policy makers and utility managers (Borisova et al. 2009).
Objective
The objective of this publication is to calculate reference ET for ten locations in Florida and one in Alabama using the corrected weather data shown in the first publication in this series, “Net Irrigation Requirements for Florida Turfgrass Lawns: Part 1 — Report of Gathered Weather Data and Quality Check” (https://edis.ifas.ufl.edu/publication/AE480).
Methodology
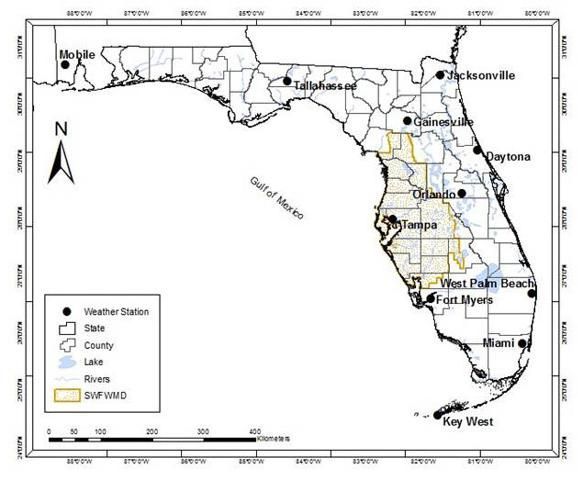
Daily measured meteorological data for a 30-year period (January 1, 1980–December 31, 2009) were gathered and quality checked from 11 weather stations located at airports in major cities in or near Florida (Figure 1; https://edis.ifas.ufl.edu/publication/AE480).

Credit: C. C. Romero, UF/IFAS
The quality-checked weather data were used to calculate ETos (short grass reference crop; equivalent to ETo at a daily time step) on a daily basis from 1980 to 2009 using the ASCE-EWRI standardized method (Allen et al. 2005). The ETos equation is expressed as follows:

Credit:
where ETos is short grass reference crop evapotranspiration, Rn is net radiation, G is soil heat flux density at the soil surface, T is mean air temperature, u2 is wind speed, es is saturation vapor pressure, ea is actual vapor pressure, Δ is the slope of the saturation vapor pressure-temperature curve, and γ is the psychometric constant. The description and definition of each component of this equation can be found in Allen et al. (2005).
Solar Radiation (Rs) and Adjustment of the Hargreaves-Samani Coefficients (Kr)
Solar radiation (Rs) is an input required for the calculation of net radiation (Rn) in Equation 1. Since Rs is infrequently measured, it can be calculated using the Hargreaves-Samani formula (Hargreaves and Samani 1982):
Rs = Kr (Tmax – Tmin)0.5Ra
(Equation 2)
where:
Kr = adjustment coefficient (0.16 for interior locations, 0.19 for coastal locations, [oC-0.5])
Tmax = daily maximum air temperature [°C]
Tmin = daily minimum air temperature [°C]
Ra = extraterrestrial radiation [MJ m-2 d-1]
Adjusting the Hargreaves-Samani Coefficients (Kr)
It was recognized that the Hargreaves-Samani method led to overestimation of solar radiation in Florida (Jacobs et al. 2004). The adjustment coefficient Kr is empirical and differs for “interior” or “coastal” regions. A value of 0.16 was recommended for interior locations, which means an area where land mass dominates, while 0.19 was the value recommended for a coastal region, which means an area where a large land mass and air masses are influenced by a nearby water body (Allen et al. 2005). However, Samani (2000) pointed out that not all coastal sites are the same, and differences in Kr values can be found among sites (Samani and Pessarakli 1986). Based on this information, a calibration procedure to adjust the Hargreaves-Samani coefficients was applied to all sites in this study.
Because Florida ground-based solar radiation data are extremely sparse from 1991 to present, a project entitled "Satellite-based Solar Radiation, Net Radiation, and Potential and Reference Evapotranspiration Estimates over Florida" (Jacobs et al. 2008) proposed an effort to provide solar radiation data from Geostationary Operational Environmental Satellites (GOES). These data were calibrated based on measured Rs data throughout Florida. The estimates have been found to be within 10% of ground-based measured values (Tarpley 1979; Jacobs et al. 2008). The resulting datasets were transferred to the U.S. Geological Survey (USGS) in Orlando, Florida. The estimated solar radiation data from 1996 through 2004 were used to calibrate the Hargreaves-Samani coefficients on a daily basis at the eleven locations under evaluation. Daily average temperature and extraterrestrial radiation data for the same locations and time span from the original weather database from the National Climatic Data Center (NCDC) were also used for the calibration process. The resulting new coefficients were applied to the entire 30-year NCDC dataset to estimate solar radiation.
Results and Discussion
Calibration of Hargreaves-Samani Coefficients (Kr) and New Solar Radiation Estimation
Table 1 shows the new adjusted Hargreaves-Samani coefficients (Kr) for 10 sites in Florida and one in Mobile, Alabama. The average was calculated for each month of the year over the 8-year USGS data record. The average monthly values across locations ranged from 0.14 to 0.24. Coastal areas like Miami and West Palm Beach tended to show high values (0.20 on average), while inland cities such as Tallahassee, Gainesville, and Orlando showed the lowest mean value (0.15). These results are similar to those recommended by Allen et al. (2005), except for Mobile and Jacksonville, which are located in coastal areas but showed low coefficient values (0.15). Key West showed an average value of 0.24, which for an island seems to be high; Allen (1995) reported a value of 0.20 for Hilo, Hawaii. The lowest mean coefficient value was found during the months of December through March, with an average value of 0.16. The highest mean coefficient values were calculated for April, May, and October with a value of 0.18. The annual average was lower in the northern part of the state (0.15 in Mobile and Tallahassee) than in the south (0.22 in Key West and Miami).
The highest coefficient values calculated for Key West are related to the low temperature difference observed in the area, which on average was 5.8 for a 30-year period (8.8°C for Hilo, Hawaii [Allen 1995]). At low latitudes, the temperature difference becomes negligible and consequently Equation 2 become insensitive (Jagtap 1991), overestimating the Hargreaves-Samani coefficients.
The calibrated solar radiation data for the period 1996–2004 were compared with the USGS solar radiation data. Differences were observed to be within 3.5% of USGS data (Table 2).
Reference Evapotranspiration Calculation
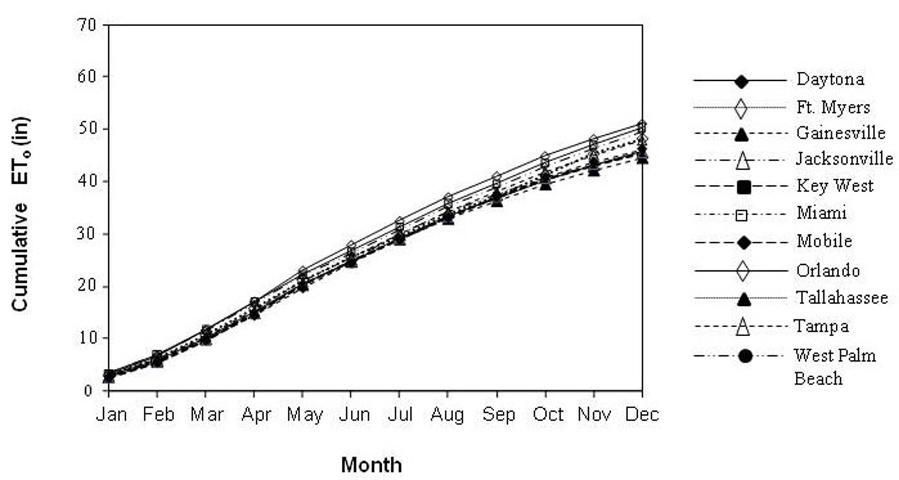
The average, minimum, and maximum ETo values over the 30-year period (1980–2009) for each location are shown in Table 3. For all locations, mean annual ETo for the 30-year period ranged from 51.0 in y-1 in Tallahassee to 65.2 in y-1 in Key West. Central areas of the state like Orlando and Tampa showed different mean ETo values, ranging from 57.9 in y-1 to 59.5 in y-1, respectively. Maximum annual ETo was calculated for Key West at 72.0 in y-1. Minimum annual ETo was calculated for Mobile at 46.2 in y-1. Long-term cumulative ETo was the highest in both Miami and Key West, and the lowest was in both Tampa and West Palm Beach (Figure 2).

Credit: C. C. Romero, UF/IFAS
The 30-year average ETo values were higher than the 9-year USGS ETo values for most of the locations, except Tampa, which had much lower values. However, when selecting the same period of our calculated ETo values, we found that the differences decreased and approached the USGS data (Table 4). Solar radiation for the 30-year period at each location was analyzed to see any inconsistencies in the data to explain the difference in ETo. The values were constant and showed the same trend year by year. However, when temperature data were reviewed, a decrease in the cumulative maximum temperatures was observed from 1991 through 1998, compared to the rest of the years. Data are shown in Table 5, where annual cumulative degrees were compared for the study period. This cool period justified the decrease in annual ETo values from 1996 through 2004 and coincided with part of the USGS available ETo data.
The highest ETo values calculated for both Miami and Key West may be overestimated due to the insensitivity of the Hargreaves-Samani equation for areas where differences in maximum and minimum temperature are small, as reported previously (5.8°C and 8.1°C for Key West and Miami, respectively). ETo values for locations near north Florida were close to some data previously published. Jacobs and Satti (2001) estimated annual ETo at 55.3 in y-1, 53.5 in y-1, and 58.3 in y-1 for Jacksonville, Gainesville, and Daytona, respectively, using the reference ET equation for the period 1985–1990. Our results were 54.5 in y-1, 52.8 in y-1, and 56.6 in y-1 for the same period of time. In another study in central Florida, Jia et al. (2009) estimated ETo for Gainesville using the same equation, finding a value of 47.6 in y-1 (in this case, 5.4 in less than what we calculated).
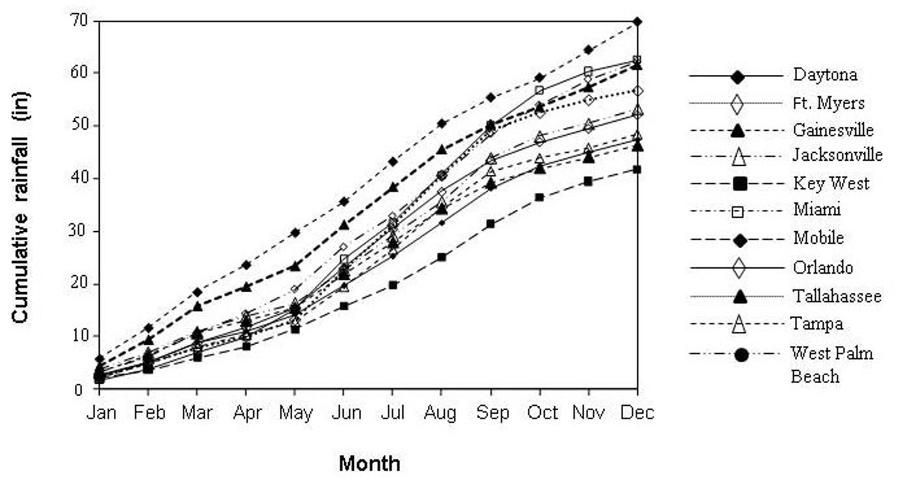
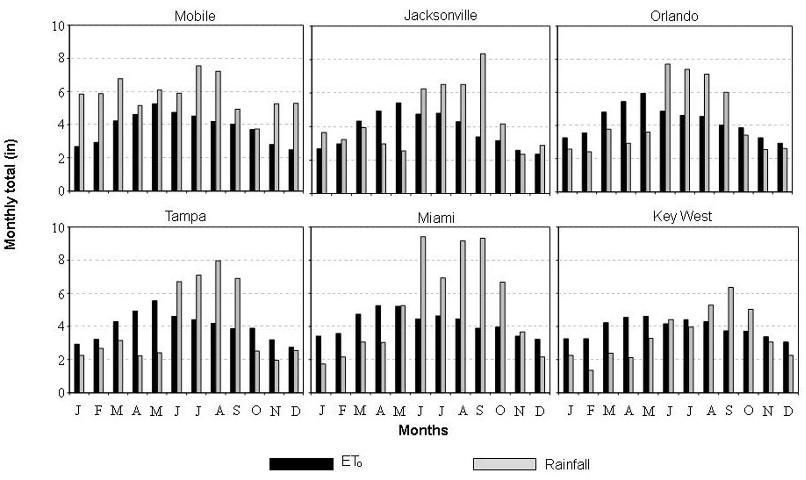
The average, minimum, and maximum rainfall values for each location are shown in Table 6. Mean yearly rainfall for the 30-year period ranged from 69.7 in y-1 in Mobile, Alabama, to 41.7 in y-1 in Key West. Central locations like Orlando and Daytona showed mean annual rainfall values of 52.1 in y-1 and 47.4 in y-1, respectively. The long-term cumulative mean monthly rainfall for all locations is shown in Figure 3. Figure 4 shows bar graphs comparing both the 30-year mean monthly rainfall and ETo amounts.

Credit: C. C. Romero, UF/IFAS

Credit: C. C. Romero, UF/IFAS
Summary
In the previous Ask IFAS publication in this series (“Net Irrigation Requirements for Florida Turfgrass Lawns: Part 1 — Report of Gathered Weather Data and Quality Check” [https://edis.ifas.ufl.edu/publication/AE480]), we used the Hargreaves-Samani equation to estimate solar radiation, although this method led to an overestimation of the value under Florida conditions. In this publication, the Hargreaves-Samani coefficients (Kr) were adjusted for 10 sites in Florida and one in Alabama, and new solar radiation values were estimated. The equation has been demonstrated as insensitive for areas where temperature difference becomes negligible, such as south Florida, overestimating its coefficients. This overestimation in solar radiation leads to overestimated ETo. Overestimation was within 10%–15% of other weather datasets and within the range of variation observed in weather datasets in Florida.
In the final publication in this series (“Net Irrigation Requirements for Florida Turfgrass Lawns: Part 3 — Theoretical Irrigation Requirements” [https://edis.ifas.ufl.edu/publication/AE482]), the daily ETo values are used as inputs to run a daily soil water balance to determine net irrigation requirements for turfgrass in Florida.
Acknowledgments
The authors want to thank the Southwest Florida Water Management District (SWFWMD) for funding this research. We are also grateful to our four reviewers (K. Migliaccio, C. Martinez, M. McCready, and J. Tichenor) for their valuable comments to the manuscript.
References
Allen, R. G. 1995. Evaluation of Procedures for Estimating Mean Monthly Solar Radiation from Air Temperature. Rome, Italy: United Nations Food and Agriculture Organization (FAO).
Allen, R. G., L. S. Pereira, D. Raes, and M. Smith. 1998. Crop Evapotranspiration: Guidelines for Computing Crop Water Requirements. Irrigation and Drainage paper no. 56 ed. Rome, Italy: United Nations Food and Agriculture Organization. https://www.fao.org/3/X0490E/X0490E00.htm
Allen, R. G., I. A. Walter, R. L. Elliot, and T. A. Howell. 2005. The ASCE Standardized Reference Evapotranspiration Equation. Reston, VA: American Society of Civil Engineers. https://doi.org/10.1061/9780784408056
Beard, J. B., and M. P. Kenna (eds.). 2006. Water Quality and Quantity Issues for Turfgrasses in Urban Landscapes. CAST Special Publication 27. Ames, Iowa: Council for Agricultural Science and Technology.
Borisova, T., C. Rawls, and D. Adams. 2009. Balancing Urban Water Demand and Supply in Florida: Overview of Tools Available to Water Managers. University of Florida. https://pinellas.wateratlas.usf.edu/upload/documents/Balancing-Urban-Water-Demand-2009-UFIFAS.pdf
DeOreo, W. B., P. W. Mayer, B. Dziegielewski, and J. Kiefer. 2016. Residential End Uses of Water, version 2. Water Research Foundation. ISBN 978-1-60573-235-0.
Hargreaves, G. H., and Z. A. Samani. 1982. "Estimating Potential Evapotranspiration." Journal of Irrigation and Drainage Engineering 108 (3): 223–230. https://doi.org/10.1061/JRCEA4.0001390
Huang, B. 2006. "Turfgrass Water Requirements and Factors Affecting Water Usage." In Water Quality and Quantity Issues for Turfgrasses in Urban Landscapes, CAST Special Publication 27, edited by J. B. Beard and M.P. Kenna. Ames, Iowa: Council for Agricultural Science and Technology.
Jacobs, J., J. Mecikalski, and S. Paech. 2008. Satellite-Based Solar Radiation, Net Radiation, and Potential and Reference Evapotranspiration Estimates over Florida. Technical Report.
Jacobs, J. M., M. C. Anderson, L. C. Friess, and G. Diak. 2004. "Solar Radiation, Longwave Radiation and Emergent Wetland Evapotranspiration Estimates from Satellite Data in Florida, USA." Hydrolog. Sci. 49 (3): 461–476. https://www.tandfonline.com/doi/abs/10.1623/hysj.49.3.461.54352
Jacobs, J. M., and S. R. Satti. 2001. Evaluation of Reference Evapotranspiration Methodologies and AFSIRS Crop Water Use Simulation Model. Final Report for John M. Fitzgerald, Water Use Data Manager, Division of Water Supply Management. St. Johns River Water Management District. Gainesville, FL: Department of Civil and Coastal Engineering, University of Florida.
Jagtap, S. S. 1991. Spatial Pattern of Reference Evapotranspiration in Africa. ASAE paper No. 91-2644, ASAE National Meeting. Chicago, IL: ASAE.
Jensen, M. E., R. D. Burman, and R. G. Allen. 1990. Evapotranspiration and Irrigation Water Requirements. ASCE Manuals and Reports on Engineering Practice No. 70, Am. Soc. Civil Engr., New York, NY, 332.
Jia, X., M. D. Dukes, and J. M. Jacobs. 2009. "Bahiagrass Crop Coefficients from Eddy Correlation Measurements in Florida." Irrigation Science 28 (1): 5–15. https://doi.org/10.1007/s00271-009-0176-x
Samani, Z. 2000. "Estimating Solar Radiation and Evapotranspiration Using Minimum Climatological Data." J. Irrig. Drain. Eng. 126 (4): 265–267. https://doi.org/10.1061/(ASCE)0733-9437(2000)126:4(265)
Samani, Z. A., and M. Pessarakli. 1986. "Estimating Potential Crop Evapotranspiration with Minimum Data in Arizona." Trans. ASAE 29 (2): 522–524. http://elibrary.asabe.org/azdez.asp?JID=3&AID=30184&CID=t1986&v=29&i=2&T=1&redirType=
Shearman, R. C., and J. B. Beard. 1973. "Environmental and Cultural Preconditioning Effects on the Water Use Rate of Agrostis palustris Huds., Cultivar Penncross." Crop Science 13:424–427. https://doi.org/10.2135/cropsci1973.0011183X001300040010x
Tarpley, J. D. 1979. "Estimating Incident Solar Radiation at the Surface from Geostationary Satellite Data." K. Appl. Meteor. 18:1172–1181.
Table 1. New calibrated adjustment coefficients (Kr) of the Hargreaves-Samani equation. Adjustment coefficients were determined for each location on a monthly basis.
Table 2. Difference in percentage between Hargreaves-Samani solar radiation estimation to USGS solar radiation data.
Table 3. Average, minimum, and maximum yearly calculated reference evapotranspiration (ETo) for the 30-year period (1980–2009) of weather station data records.
Table 4. Difference between maximum and minimum cumulative degrees on an annual basis for two locations in Florida and one in Alabama.
Table 5. Comparison of ETo values for all locations, according to period of time and source.
Table 6. Average, minimum, and maximum yearly rainfall for the 30-year period (1980–2009) of weather station data records.