Introduction
The impacts of sea level rise on ecosystems and natural resources are a major concern in Florida, especially in low-lying coastal areas such as south Florida. Sea level rise can impact many aspects of Florida's economy, including urban development, agriculture, infrastructure, and natural areas. Florida is flat, and much of Florida's elevation is close to the sea level. The geography of Florida makes the state especially prone to the impacts of sea level rise and subsequent issues such as seawater intrusion, storm surges, and flooding. More frequent and severe cases of sunny-day flooding (or nuisance flooding) provide a prime example of the impacts on Florida's coastal areas. UF/IFAS Extension agents can use many online sources to communicate critical information on sea level rise and ways it can affect livelihoods. However, it is often difficult to find online sources that contain data, information, and tools specifically tailored for certain target audiences, with the appropriate technical level of contents and scientific credibility. This document introduces, evaluates, and summarizes selected available online sources and tools (Table 1) to educate diverse stakeholders and concerned local residents on important aspects of sea level rise. It will also aid UF/IFAS Extension agents in the development of relevant education and programs. Examples illustrate the use of selected online sources and the types of information that can be obtained from them. To show how these tools can be used, we provide an overview, suggest a technical level and target audience, and identify the main goal of each online resource.
In this article, descriptions and information quoted directly from the online sources listed in Table 1 are included within quotations.
International/National Level
NOAA: Sea Level Trends
https://tidesandcurrents.noaa.gov/sltrends/sltrends.html
Objectives/Goals
As stated on the website, "NOAA's Center for Operational Oceanographic Products and Services (CO-OPS) is the authoritative source for accurate, reliable, and timely tides, water levels, currents and other oceanographic information. Our data, products and services support safe and efficient navigation, sound ecosystem stewardship, coastal hazards preparedness and response, and the understanding of climate change" (NOAA 2020a).
Description
According to NOAA, "the sea level trends measured by tide gauges that are presented here are local relative sea level (RSL) trends as opposed to the global sea level trend. Tide gauge measurements are made with respect to a local fixed reference on land. RSL is a combination of the sea level rise and the local vertical land motion. The global sea level trend has been recorded by satellite altimeters since 1992 and the latest global trend can be obtained from NOAA's Laboratory for Satellite Altimetry, with maps of the regional variation in the trend. The University of Colorado's Sea Level Research Group compares global sea level rates calculated by different research organizations and discusses some of the issues involved" (NOAA 2020b).
Source of Information
NOAA Technical Report NOS CO-OPS 36, 53, 83, and 86 (Data and Resources at https://tidesandcurrents.noaa.gov/sltrends/sltrends.html).
Target Audience
General public.
Technical Level of Contents
Medium. The online source contains some technical terms such as "satellite altimeters," "confidence interval," and "linear relative trend" as well as time-series and box-plots showing long-term variations of sea level.
Note
The website shows historical sea level trends observed and/or reported in a NOAA report (NOAA Technical Report NOS CO-OPS 36). The length of observations varies by tide stations.
Application Example and Screen Capture
The time-series plot shows that relative sea level rise for the Key West tide station (Station ID: 8724580) has increased since 1913 at the rate of 2.42 mm/year with a 95% confidence interval of ± 0.14 mm/year. The data and plots can be downloaded as text, comma-separated value, and image files (Figure 1).
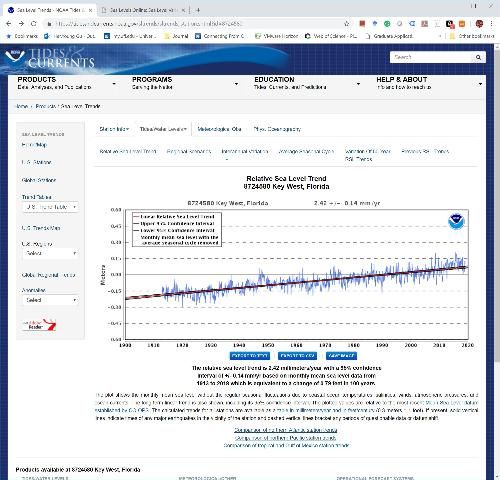
Credit: NOAA
NOAA: Sea Level Rise Viewer
Objectives/Goals
This website provides modeling tools to analyze the effects of sea level rise for user-defined scenarios.
Description
Users can modify water level scenarios and analyze effects on vulnerability, flood frequency, and marsh migration. The user is guided by five levels of local scenarios of sea level rise (intermediate low–extreme) for the years 2020 to 2100 in 20-year increments. Each module (e.g., marsh migration, vulnerability, flood frequency) has explanations and instructive videos. The user can select any of the U.S. states and territories and zoom in on a region of interest. The map can be displayed in "Satellite," "Streets," or "Dark" mode. Data can be downloaded and/or shared on social media.
Source of Information
The sources and links to the databases include NOAA intermediate sea level rise projection, census data, raw population data, local elevation data, and Zillow data.
Target Audience
Researchers, planners, educators in related fields.
Technical Level of Contents
Medium-hard (a complex set of tools that will need time to learn).
Note
The website states that it does not show the "low" scenario because it is a continuation of the current global trend since the early 1990s and has been determined to have a low probability of occurrence by 2100. Furthermore, this scenario would be associated with low levels of risk, even if it did occur. The website offers links to other NOAA databases and tools.
Application Example and Screen Capture
A screenshot shows risks of high-tide flooding in Florida in a scenario of an increase in water level by 6 ft (Figure 2).
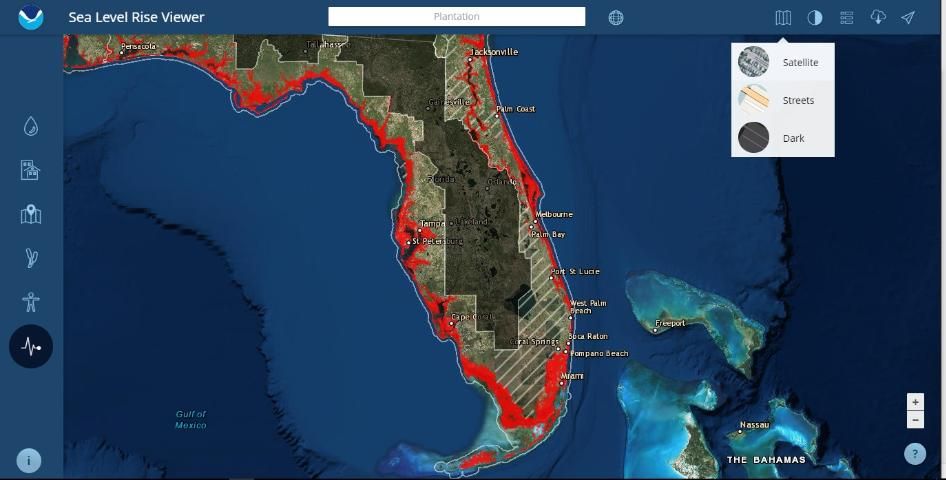
Credit: NOAA
Climate Central: Surging Seas—Risk Finder
https://riskfinder.climatecentral.org/
Objectives/Goals
As stated on the website, the goal is to "provide the ability to explore inundation risk up to 30 meters across the global coastline as well as local sea level rise projects at >1000 tide gauges on 6 continents... Climate Central's Program on Sea Level Rise strives to provide accurate, clear and granular information about sea level rise and coastal flood hazards both locally and globally, today and tomorrow. Anchored in rigorous primary research, our work distinguishes itself by its user-friendly maps and tools, extensive datasets, and high-quality visual presentation. The program dedicates its efforts to helping citizens, communities, businesses, organizations, and governments at every level to understand the consequences of different carbon pathways and to navigate the shifting waters of our warming world" (Climate Central 2020).
Description
The website describes this as an online tool that "maps areas below the selected water level and displays as satellite imagery shaded in blue indicating vulnerability to flooding from combined sea level rise, storm surge, and tides, or to permanent submergence by long-term sea level rise. Map areas above the selected water level are shown in map style using white and pale grays. The map is searchable by city, state, postal code, and other location names" (Climate Central 2020).
Users can select a region within the U.S. and analyze the consequences associated with the different levels of sea level rise on flooding above 3 ft, days of coastal floods, and specific statistics on the composition of: contamination risks, population, buildings, infrastructure, and lands that are at risk of inundation. The data are listed in graphs and can also be displayed on a map. Data can be downloaded and shared on social media.
Source of Information
For the mapping areas in the U.S., the Risk Zone map incorporates the latest, high-resolution, high-accuracy LiDAR elevation data supplied by NOAA. For map areas outside the U.S., the map utilizes elevation data from NASA's Shuttle Radar Topography Mission (SRTM). "The research behind the Risk Zone Map is based on peer-reviewed science. That 2012 analysis used the best available U.S. national coverage elevation dataset at the time... Risk Zone Map now uses far more accurate laser-based (LiDAR) elevation data in the U.S." (Climate Central 2020). However, outside of the U.S., very limited LiDAR data are available. Instead, the developers used radar satellite-based data collected from NASA's Shuttle Radar Topography Mission (SRTM) with less precision. Therefore, outside the U.S., the flood maps should be seen as the likely lower bounds of potential inundation for each water level.
Target Audience
The target audience includes coastal resource managers, homeowners, regional planners, non-profits, and members of the general public who want to enhance coastal resilience in the face of changing climate. This source contains detailed datasets that can be used for research and planning purposes, with straightforward menus.
Technical Level of Contents
The tools are highly technical and based on the existing best science. It is easy to adjust settings and retrieve detailed information.
Application Example and Screen Capture
The tool shows the areas that will be flooded if the water level increases to 8 ft in south Florida. Users can select associated risks at the lower panel.
NOAA: U.S. Climate Resilience Toolkit
https://toolkit.climate.gov/#explore
Objectives/Goals
This site assists members of the general public in finding information and tools to help them understand and address climate risks.
Description
"The U.S. Climate Resilience Toolkit is a website designed to help people find and use tools, information, and subject matter expertise to build climate resilience. The Toolkit offers information from all across the U.S. federal government in one easy-to-use location. The goal is to improve people's ability to understand and manage their climate-related risks and opportunities, and to help them make their communities and businesses more resilient to extreme events" (U.S. Climate Resilience Toolkit 2020). This is a large website that acts as a portal to many different tools. Some of those tools are within NOAA, and some are outside of NOAA. There are regional pages, but Florida is not included in any of the regions.
Source of Information
There are many tools here using many different data sources.
Target Audience
The target audience is diverse. Anyone can benefit from this information on the significance of climate change and ways to build resilience in the face of it. Certain sections are more relevant to businesses or governments developing plans for climate resilience.
Technical Level of Contents
The information on the website is very technical; however, the site describes technical material in easy-to-digest terms.
Application Example and Screen Capture
The climate explorer tool lets the user visualize changes related to climate change for different communities (Figure 3).
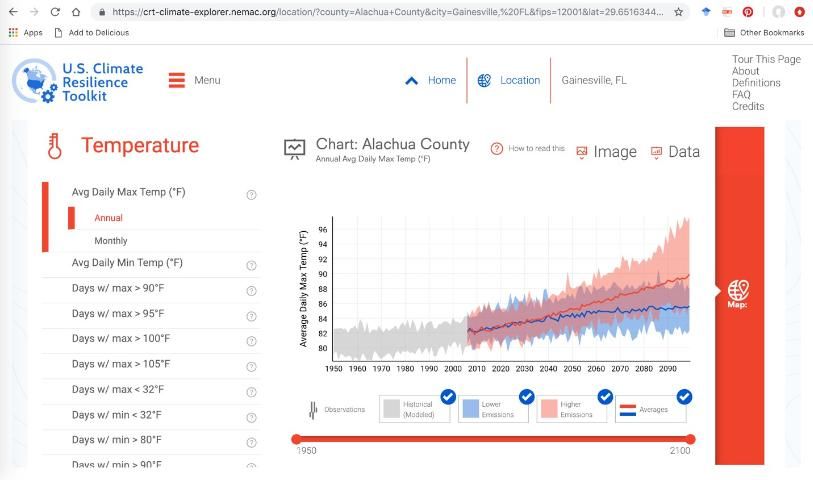
Credit: NOAA
USACE: Sea-Level Change Curve Calculator
https://cwbi-app.sec.usace.army.mil/rccslc/slcc_calc.html
Objectives/Goals
This is an online calculator used to estimate changes in sea level rise at specific locations based on existing gauges, historical data, and projections created by the U.S. Army Corps of Engineers (USACE).
Description
The online calculator is maintained by the USACE as part of their Climate Preparedness and Resilience Community of Practice Program. The program seeks to develop and implement "practical, nationally consistent, and cost-effective approaches and policies to reduce potential vulnerabilities to the Nation's water infrastructure resulting from climate change and variability" (USACE 2020) and works with diverse federal agencies, public and private sectors, and other stakeholders to achieve its mission.
Source of Information
USACE, NOAA, Center for Homeland Defense and Security, Federal Emergency Management Agency (FEMA), additional regional sources for specific gauges.
Target Audience
This source is suitable for technical experts who can understand the input parameters of the calculator. The output, however, is fairly straightforward and can be understood by nonexperts.
Technical Level of Contents
Although the output is fairly easy to understand, some of the technical details and parameters that need to be entered into the calculator require specific technical knowledge and vocabulary.
Note
Additional links in this site connect users to an abundance of climate change information.
Application Example and Screen Capture
Users begin with a map indicating locations of gauges, which can be selected by double-clicking on the map. Dozens of gauges along the coastal U.S. and selected territories in the Caribbean are available. One can zoom in and out, and scroll through the map to find locations of interest. Users are given an option to select a particular dataset to formulate the projections. Users can select start and end dates for the scenario they are developing. The output is a plot of relative sea level change projections over time in years. Several traces indicating high and low estimates are plotted. The same data are presented as a table that can be copied for further analyses by the user.
First Street Foundation (NOAA, USGS, NWS, USACE, and Columbia University): Flood iQ
Objectives/Goals
According to the website, "Flood iQ visualizes your risk of sea level rise flooding today and up to 15 years in the future. It is a web based application created by the tech non-profit First Street Foundation. First Street Foundation's mission is to educate citizens and elected officials on the risks, causes, and solutions to sea level rise and flooding. We do this by leveraging expertise in digital marketing and communications to create tools that break down this complex subject into easy to understand topics and visualizations. With the horrific flooding events of Hurricane Harvey and Irma matched with the ever-worsening high tide flooding experienced throughout coastal cities, it's clear solutions are needed. First Street's goal is to unlock national solutions to sea level rise and flooding that can ensure all of our coastal communities will not only survive as our sea levels rise but thrive" (FloodiQ 2019).
Description
The Flood iQ website provides information on flooding risk from scenarios of hurricane storm surge (frequent tidal, highest annual tidal floods, and hurricane Categories 1 to 3), flood risks increased by projected sea level rise scenarios in the next 15 years, flood depth and cover projections, FEMA flood zone, and local officials in charge of flooding issues. It covers U.S. coastal areas along the Atlantic Ocean and the Gulf of Mexico.
Source of Information
The website obtains information from:
Church, J. A., and N. J. White. 2011. "Sea-level rise from the late 19th to the early 21st century." Surveys in Geophysics 32(4–5): 585–602.
McAlpine, S. A., and J. R. Porter. 2018. "Estimating recent local impacts of sea-level rise on current real-estate losses: a housing market case study in Miami-Dade, Florida." Population Research and Policy Review 37(6): 871–895.
NOAA, Center for Operational Oceanographic Products and Services. n.d. "Tides & Currents." Accessed on February 13, 2020. https://www.tidesandcurrents.noaa.gov/
Ocean Studies Board and National Research Council. 2012. Sea-Level Rise for the Coasts of California, Oregon, and Washington: Past, Present, and Future. Washington, D.C.: National Academies Press.
Target Audience
General public.
Technical Level of Contents
Low. "Simply plug your address in the search bar at the top of the screen and select your address when it appears. You'll immediately see your flood risk level and detailed summary for whichever flood type you're most at risk for: repeated tidal flooding, hurricane Category 1, or hurricane Category 3" (FloodiQ 2019).
Note
The website notes that "Flood iQ is based on current sea levels and applies the projected sea level rise forecast from the Army Corps of Engineers to predict future flooding while FEMA flood maps are based on historical flooding events and do not include sea level rise. We are showing where the water is likely to be in the future and include sea level rise projections while FEMA maps show where the likelihood of flooding will occur again based on past trends" (FloodiQ 2019). In addition, "Flood iQ is using current data while 15% of the federal FEMA flood maps we rely on have not been updated since the 1970s or 1980s, and none of the maps include future sea level rise... Flood iQ is deterministic while FEMA is probabilistic. What does that mean? For tidal flooding we show the regions where flooding is most likely to repeatedly occur, and for hurricanes we show the predicted maximum extent of the storm surge if one were to make a direct landfall. FEMA uses past historical flooding frequency to estimate areas that in any given year have a 1% chance (1 in 100 years) of flooding from any cause" (FloodiQ 2019).
Application Example and Screen Capture
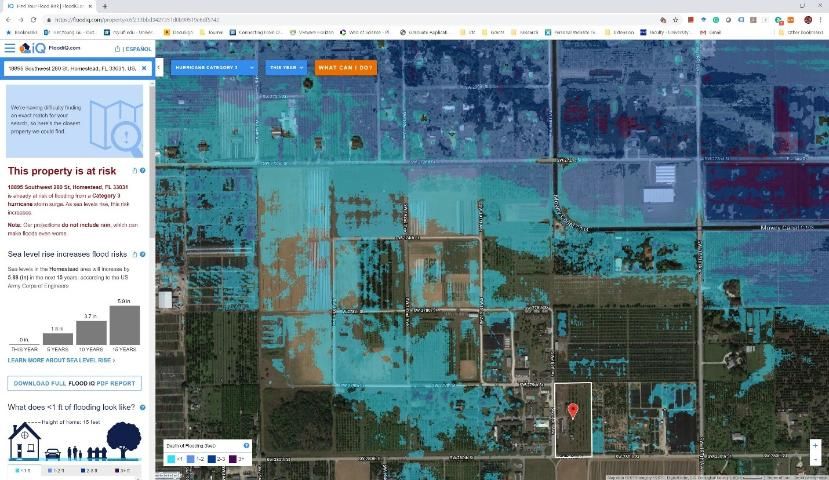
Credit: First Street Foundation
The Nature Conservancy: Coastal Resilience Mapping Portal
https://maps.coastalresilience.org/
Objectives/Goals
According to the website, "Coastal Resilience is a program led by The Nature Conservancy to examine nature's role in reducing coastal flood risk. The program consists of an approach, a web mapping tool, and a network of practitioners around the world supporting hazard mitigation and climate adaptation planning. Coastal Resilience supports a community of practitioners around the world who are applying spatial planning innovations to coastal hazard risk, resilience and adaptation issues. This is a global network providing access to peer practitioners, tools, information and training focused on nature-based solutions" (Coastal Resilience 2018).
Description
According to the website, "Coastal Resilience is a program led by The Nature Conservancy to examine nature's role in reducing coastal flood risk. The program consists of an approach, a web mapping tool, and a network of practitioners around the world supporting hazard mitigation and climate adaptation planning... Coastal Resilience is a decision support tool that incorporates the best available science and local data to enable communities to visualize the risks imposed by sea level rise and storm surge on the people, economy, and coastal habitats... Maps are broken down into categories: (1) Future Habitat: Shows how the size and distribution of tidal marshes and other coastal habitats may change in response to future projected sea level rise scenarios; (2) Regional Planning: Explore regional datasets across the state; (3) Community Planning: Examine local city-scale data for climate adaptation planning" (Coastal Resilience 2018).
Source of Information
2007–08 Florida Division of Emergency Management (FDEM) LiDAR data and USGS High Accuracy Elevation Dataset (HAED).
Target Audience
Varies from general public to local governments.
Technical Level of Contents
The data are simple to visualize, and they have detailed technical descriptions. For the community planning section, the site shows results (e.g., suitability of shorelines for protection) nicely. However, it is difficult to find information on how that suitability was determined.
Application Example and Screen Capture
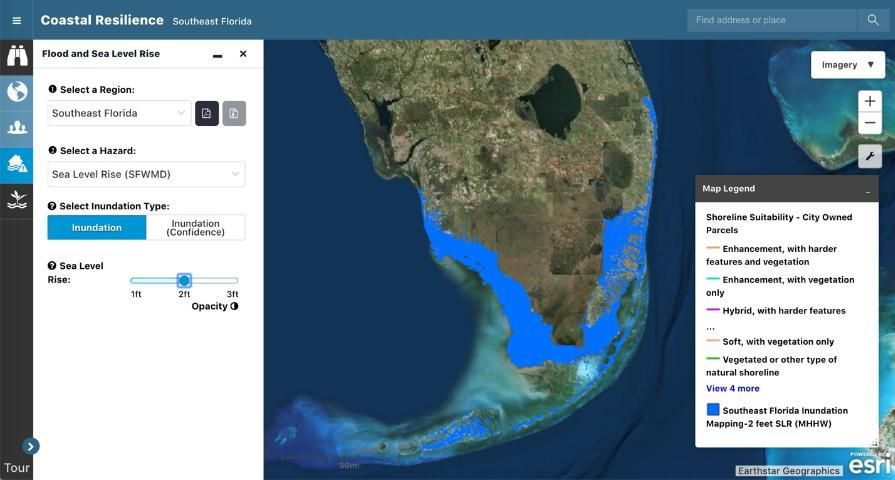
Credit: The Nature Conservancy (coastalresilience.org)
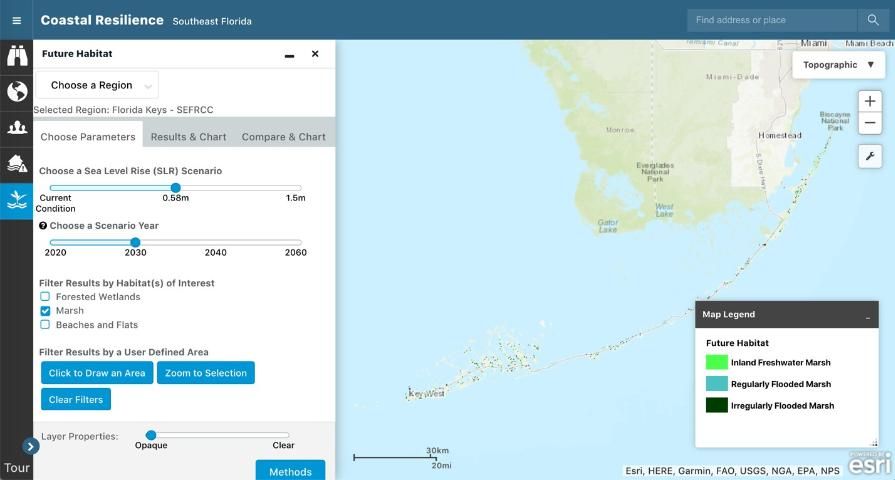
Credit: The Nature Conservancy (coastalresilience.org)
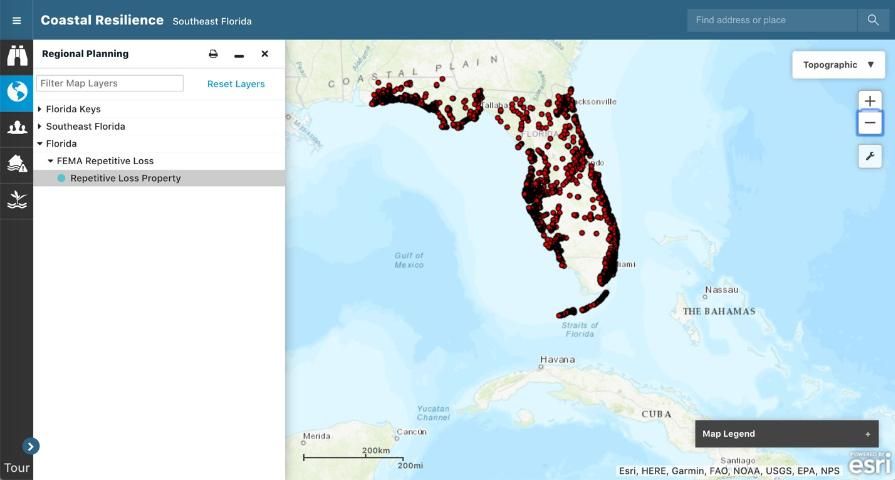
Credit: The Nature Conservancy (coastalresilience.org)
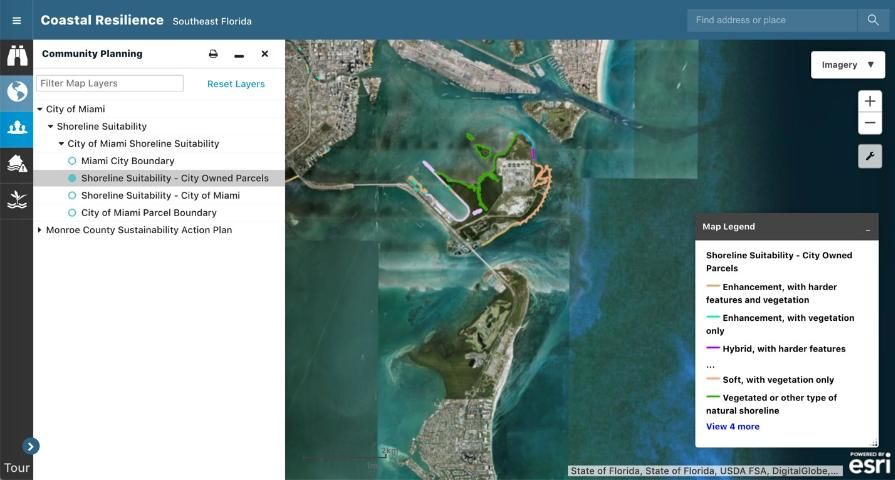
Credit: The Nature Conservancy (coastalresilience.org)
Naturally Resilient Communities: Explore Solutions & Case Studies
Objectives/Goals
This site provides a guide of nature-based solutions and case studies from existing projects from across the U.S. to help communities consider natural systems as a means to reduce flooding and erosion impacts.
Description
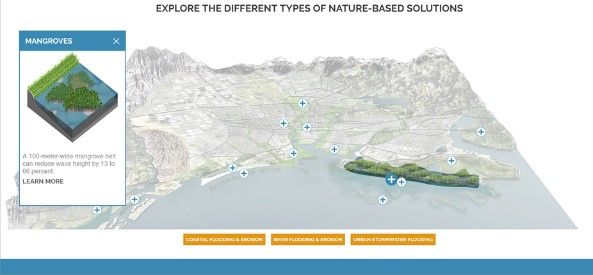
Naturally Resilient Communities is a partnership among several agencies and organizations, including the American Planning Association, American Society of Civil Engineers, Association of State Floodplain Managers, National Association of Counties, The Nature Conservancy, and Sasaki Associates. The main focus of the site is a conceptualized 3D-view model representing a coastal community. The model has agricultural, urban, and natural terrestrial areas, coastal zones, rivers, lakes, and other water bodies. It encompasses a diverse array of scenarios that could be present in any given community. In select locations in the model, plus signs can be clicked to open an example of a management project that offers a nature-based solution to mitigate flooding and erosion problems (see Figure 9 and description below).
Source of Information
Various case studies.
Target Audience
General audience, especially local community management personnel.
Technical Level of Contents
The material presented in this site is for the general public and can be understood and used by nonexperts.
Note
Excerpt from the website: "Nature offers a powerful set of tools for addressing hazards like flooding and erosion. Nature-based solutions use natural systems, mimic natural processes, or work in tandem with traditional approaches to address these specific hazards. Communities across the country—along rivers or coasts, large or small, rural or urban—can incorporate nature-based solutions in local planning, zoning, regulations, and built projects to help reduce their exposure to flood and erosion impacts" (NRC 2020).
Application Example and Screen Capture
Figure 9 shows the conceptualized 3D model and its different land/water use areas. One potential nature-based solution is the use of mangroves. Users can expand the view by clicking "+" at a particular location in the model. In the example below, a section of the mangrove area (i.e., a mangrove forest on the coast) is shown along with a popup box with a brief description and link that can take the user to additional information.
Credit: SCAPE (https://www.scapestudio.com/)
State Level
UF: Florida Sea Level Scenario Sketch Planning Tool
Objectives/Goals
The purpose of this tool is to help visualize the extent of current and future flood risks on transportation infrastructure in Florida. The interactive mapping tool is designed to provide a preliminary assessment of facilities and infrastructure at risk of sea level rise impacts, including when, where, and how much inundation could occur in various scenarios.
Description
The user can toggle through sea level rise scenarios using projections and adjust the projection curve for the rate of sea level rise over different periods of time. The user can select different scenarios to view in the Scenario Selector at the top left of the screen. Each scenario differs in the rate of sea level rise. Each scenario that the user clicks through will load as a layer on the map. The user can hide other layers to compare scenarios by unchecking the checkbox next to each layer under the layer's tab. When roads are highlighted in certain scenarios, the user can select the road and toggle through the information provided in the window, including Google Street View. The tool can also identify which roadways would be affected, given different categories of storms. The tool was created by the University of Florida GeoPlan Center with funding from the Florida Department of Transportation.
Source of Information
The tool assesses future flood risk using sea level rise scenarios from the U.S. Army Corps of Engineers (USACE) and the National Oceanic and Atmospheric Administration (NOAA)/National Climate Assessment.
Target Audience
This tool is likely for individuals working in transportation; however, residents may also find it informative. The tool is intended for informational purposes only. It does not include exact locations of flooding, nor does it consider other factors that affect future flooding.
Technical Level of Contents
Medium-Low. The tool is not difficult to use, but the user may need some time to become familiar with all the layers and options. The terminology is general enough for a non-technical user.
Note
The website identifies transportation infrastructure that may be at risk for inundation given future climate projections. The tool is beneficial for city planners interested in identifying the most at-risk infrastructure.
Application Example and Screen Capture
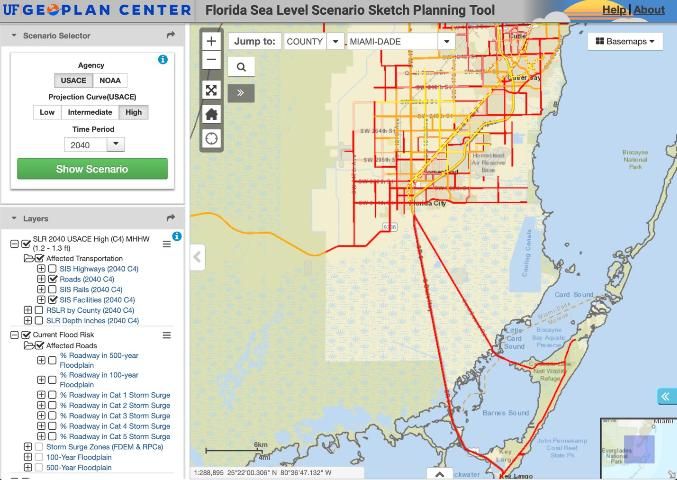
Using the high end of the 2040 projects from the U.S. Army Corps of Engineers, the user can identify how likely it is for the road to be underwater. In this image capture, red means 50%–100% of the road will be at risk for flooding. Orange is 25%–49%, and yellow is 10%–24%.
Credit: University of Florida GeoPlan Center
Local Level
Miami-Dade County: 3D Sea Level Rise Viewer
https://mdc.maps.arcgis.com/apps/webappviewer3d/index.html?id=b92a9fa4ff8847bf97f3e628a195a398
Objectives/Goals
This 3D tool focuses on impacts associated with sea level rise to buildings in Miami-Dade County. This part of south Florida is one of the most vulnerable to future rising sea levels.
Description
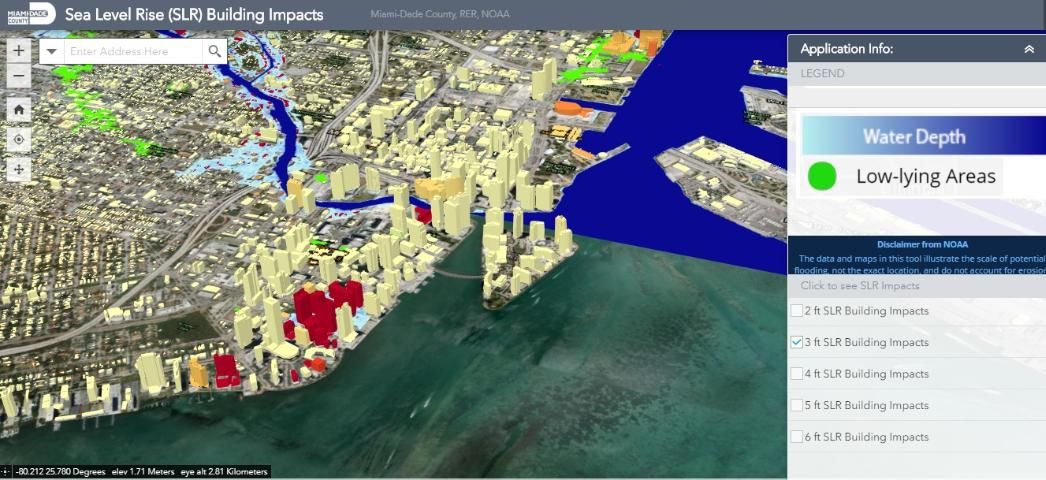
This tool uses 3D visuals to demonstrate the risks of building in different scenarios of sea level rise. The tool categorizes the risks and impacts into high, medium, and low risks and also uses sea level rise scenarios (i.e., 1-, 2-, 3-, 4-, 5-, and 6-ft increases in sea level) based on current climate projections. The tool can help users understand how Miami-Dade County is currently being impacted by sea level rise, how the county can be impacted by sea level rise in the future, and what the county is currently doing to prepare for the sea level rise issue.
Source of Information
It uses combined information such as the building footprint from the Office of Resilience as well as the sea level rise data from the NOAA Office for Coastal Management.
Target Audience
The target audience is diverse, including coastal resource managers, homeowners, building managers, regional planners, nonprofit organizations, and the general public who want to enhance coastal resilience in the face of changing climate.
Technical Level of Contents
The information contained is highly technical, science-based, and very helpful for relevant stakeholder groups such as city planners and architects in the county.
Application Example and Screen Capture
Figure 11 shows sea level rise building impacts in Miami-Dade County in the 3-ft future scenario of sea level rise.
Credit: SFWMD GIS Services, State of Florida, USDA FSA, GeoEye, Maxar, CNES/Airbus DS
Miami-Dade County: Sea Level Rise in Miami-Dade County
https://mdc.maps.arcgis.com/apps/Cascade/index.html?appid=6ff1c86445114dc7b82e13b67b439093
Objectives/Goals
This "story map" explains why sea levels are rising, how sea level rise is impacting areas in Miami-Dade County, and what the county is doing about the issue.
Description
Users are guided through a series of photos, maps, and graphs that explain the causes and consequences of sea level rise. The main topics are: "impacts," "future impacts," "preparation," "reducing risks," and "what you can do." The website focuses on Miami-Dade County but also contains general information.
Source of Information
The sources and links to the underlying databases are stated but rarely linked.
Target Audience
General public in Miami-Dade County.
Technical Level of Contents
Easy to use. A good tool for Miami-Dade County residents to learn more about sea level rise.
Note
The website requires scrolling through material, which might not be as convenient on a phone as on a computer.
Application Example and Screen Capture
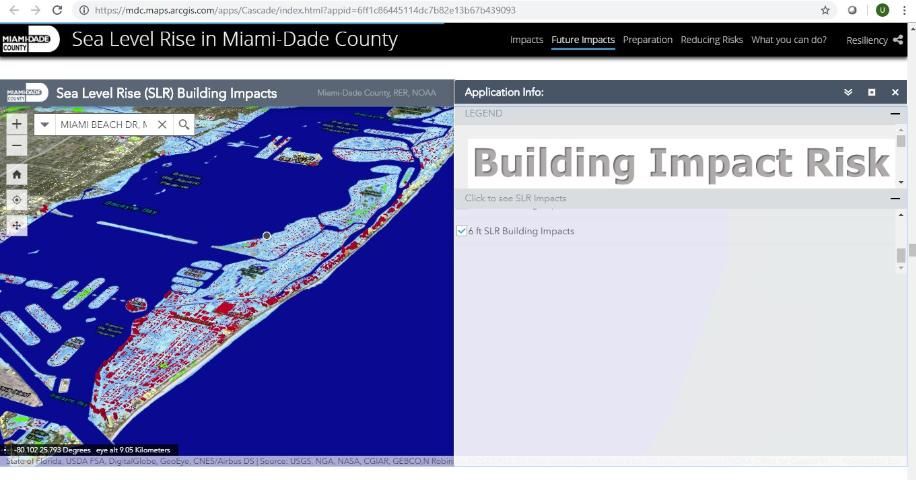
Figure 12 shows the impact of a 6-ft water level increase scenario on buildings in Miami Beach.
Credit: Miami-Dade County, Information Technology Department GIS Solutions
Miami-Dade County: FLIPPER
https://gisweb.miamidade.gov/arcgis/rest/services/Flipper/FLIPPER_StandardLayers/MapServer
Objectives/Goals
FLIPPER is a service directory provided by Miami-Dade County, where the user can access different data layers created by the county.
Description
According to the website, "the Florida Inter-operable Picture Processing for Emergency Response (FLIPPER) is a common operating picture and situational awareness application used by Miami-Dade OEM and first responders. This is an interactive web mapping tool used to display geographic information from a variety of internal and external sources, such as live weather data, storm surge, active hurricane tracks, demographic data, traffic streaming cameras, live traffic and accidents, road closures, and others. FLIPPER also displays map layers that include fire and police stations, schools, hospitals, nursing homes, parks, roadway network, and aerial photography" (Miami-Dade County 2020). The GIS layers and information are for Miami-Dade County and can be used to help plan evacuation routes. The information on the map mostly pertains to identifying different city facilities such as schools, fire/police stations, medical and government facilities, etc. There is one "Hydrology" section of layers that describes canals and another layer that identifies opened box stores and grocery stores, which would be helpful during a hurricane. FLIPPER interfaces directly with ArcGIS Online.
Source of Information
Miami-Dade Office of Emergency Management (OEM), Emergency Operation Center (EOC), and Information Technology Department (ITD).
Target Audience
FLIPPER focuses on city facilities; it is best suited for city planners and emergency management teams.
Technical Level of Contents
High. The tool is difficult to use. Although it is intended as a web-version of ArcGIS, it is not intuitive for the novice GIS user. Some basic skills in ArcGIS are required. FLIPPER is a valuable resource for people interested in layers and information for Miami-Dade County.
Note
FLIPPER is a good resource if you want data on infrastructure from the county, but there is very little metadata or information. This tool shows different map layers but does not directly assess sea level rise vulnerability. Nevertheless, it could be useful when planning a response to a disaster.
Application Example and Screen Capture
FLIPPER has many standard layers that provide the GPS coordinates for schools (Figure 13) or "Critical Locations" (Figure 14).
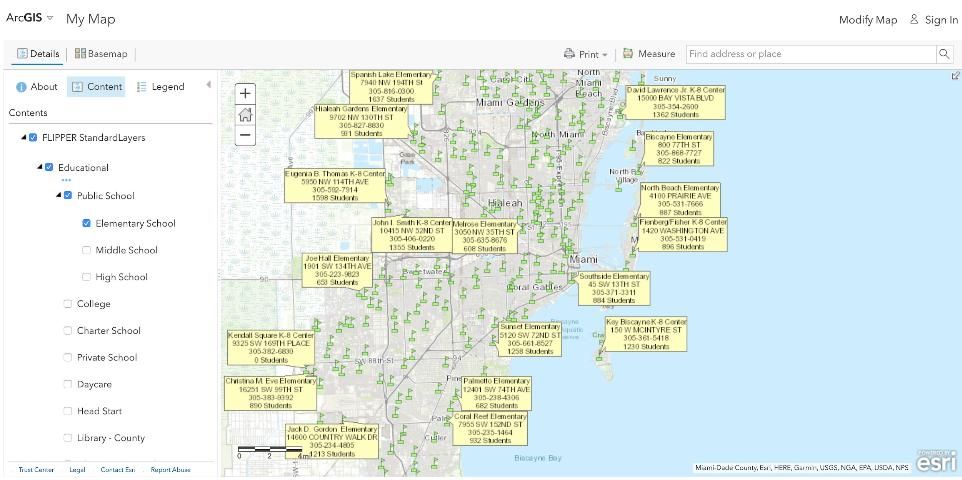
Credit: Miami-Dade County, Esri, HERE, Garmin, USGS, NGA, EPA, USDA, NPS
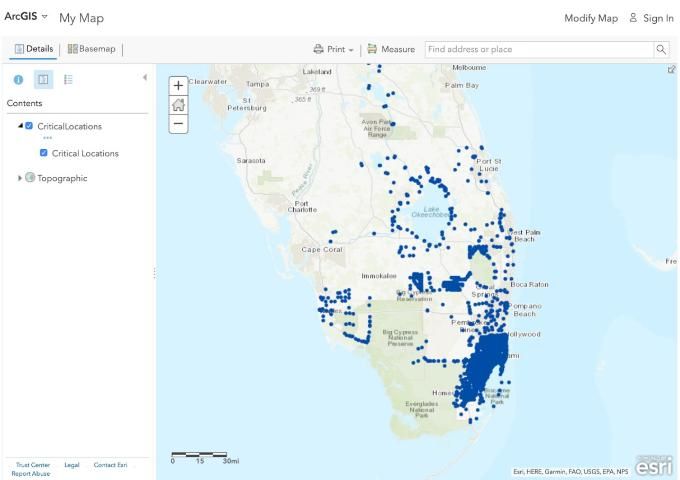
Credit: Esri, HERE, Garmin, FAO, USGS, EPA, NPS
FIU: Eyes on the Rise
Objectives/Goals
According to the website, "the goal of the Sea Level Rise Toolbox is to inform citizens of south Florida about the potential impact of sea level rise in their neighborhoods. We want to help our fellow Floridians adapt to sea level rise and better understand what local governments, including Miami Beach and Miami-Dade County, are doing to adapt to sea level rise. To this end, FIU Journalism students have produced a video series on Sea Level Rise Impact for WPBT2, and we have partnered with journalists from Fusion, whose reporting on the Miami Beach Centennial and sea-level rise adaptation efforts help provide this context to the app" (FIU 2020).
Description
The Sea Level Rise Toolbox is described as being "part of Eyes on the Rise, a project of Florida International University School of Journalism and Mass Communication professors Susan Jacobson, Robert 'Ted' Gutsche, Kate MacMillin and Juliet Pinto, and their students... Using elevation data from the Google Elevation Service, and based on sea level rise calculations created by Peter Harlem, a scientist at FIU's Geographic Information Systems (GIS) Center, the app visualizes the possible impact of rising seas on south Florida. The app's main feature is an interactive sea level rise viewer where users can enter an address to visualize how up to a 6 ft increase in sea level may affect their neighborhoods. Currently, the app focuses on locations within Miami-Dade County. As development on the Sea Level Rise Toolbox continues, it will also include a database of flood reports from both government and citizen sources in south Florida. Miami-Dade County recently launched an open data portal that includes flood reports, which will be included in the flood database. The flood report database will help residents identify the incidence of what the National Oceanic and Atmospheric Administration calls 'nuisance flooding,' a phenomenon that is increasingly common as coastal sea levels rise" (FIU 2020).
Source of Information
From the website: "Elevation Data: This application uses elevation data from the Google Elevation Service. The elevation value is interpolated from actual elevation measurements at the four nearest available locations. The horizontal resolution is the distance between these points" (Eyes on the Rise 2016).
From the website: "Sea Level Rise Visualization: This application uses a model for sea level rise based on calculations created by Peter Harlem, a scientist at FIU's Geographic Information Systems (GIS) Center. The data and maps in this tool illustrate the scale of potential flooding, not the exact location, and do not account for erosion, subsidence, or future construction. Water levels are shown as they would appear during the highest high tides (excludes wind-driven tides), also known as MHHW (mean higher high water—see http://co-ops.nos.noaa.gov/datum_options.html for a definition)" (Eyes on the Rise 2016).
Target Audience
Concerned residents of south Florida, including Miami-Dade, Broward, and Palm Beach Counties.
Technical Level of Contents
Easy. The only information required is the address of an area of interest. The tool provides the elevation of the point of interest and areas affected by a sea level rise scenario. The output is also easy to understand and straightforward. However, the Flood Reports functions are not intuitive to use.
Note
According to the website, "the data and maps in this tool illustrate the scale of potential flooding, not the exact location, and do not account for erosion, subsidence, or future construction. Water levels are shown as they would appear during the highest high tides (excludes wind-driven tides), also known as MHHW (mean higher high water—see https://tidesandcurrents.noaa.gov/datum_options.html for a definition). The data and maps in this tool are provided 'as is,' without warranty to their performance, merchantable state, or fitness for any particular purpose. The entire risk associated with the results and performance of these data is assumed by the user. This tool should be used strictly as a reference tool and not for navigation, permitting, or other legal purposes" (Eyes on the Rise 2016).
Application Example and Screen Capture
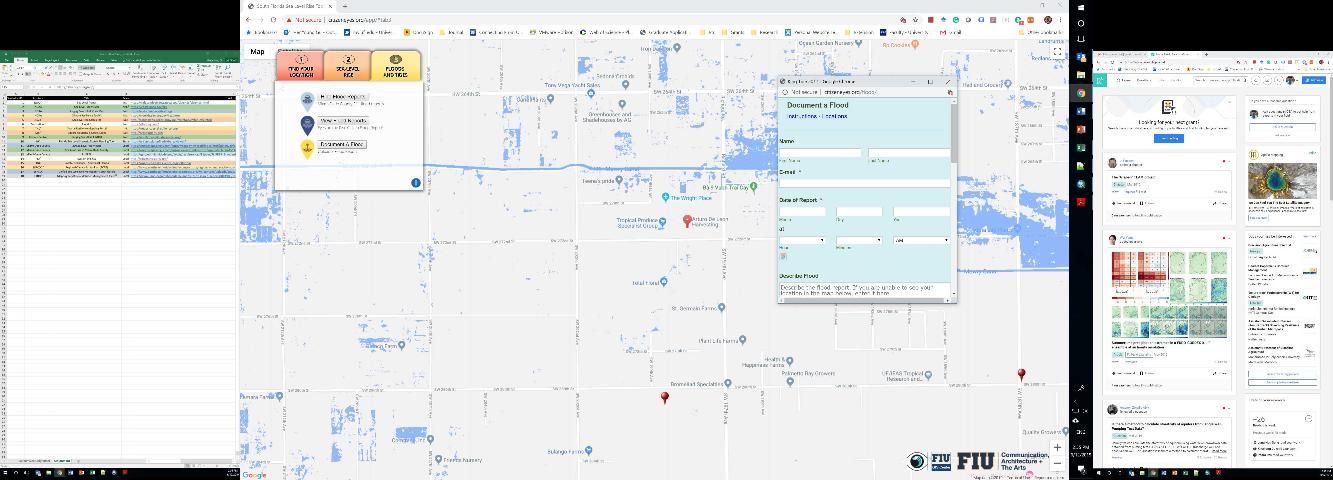
Credit: FIU
The Nature Conservancy
https://maps.coastalresilience.org/seflorida/
Objectives/Goals
The site, which is part of The Nature Conservancy's set of tools described above (national/international), offers a regional set of decision support tools to help communities visualize risks imposed by sea level rise.
Description
The Coastal Resilience of Southeast Florida website offers a variety of tools to help users visualize how sea level rise projections and scenarios can affect select habitats, regions, and communities. The modules are organized in these three categories. Users are given options for sea level rise scenarios that are based on different models. Options are also given for how long the projection will run into the future (up to the year 2060). The resulting output indicates how the areas (in acres) of terrestrial and coastal habitats would change under the given projection scenario. Habitats include mangroves, ocean beaches, marshes, and tidal areas. The map provides colored delineations of specific habitat categories and ways they would change with a sea level rise scenario. Another module allows users to see areas that would flood under a particular sea level rise projection on a map. It also includes municipal boundaries, critical municipal infrastructure, land parcels, and zoning information. The whole site works as layers such that outcomes from different modules can be overlain simultaneously. This is a particularly useful tool for users interested in seeing how different areas, habitats, and land uses could change under different scenarios.
Source of Information
NOAA, municipal and regional data.
Target Audience
General public and non-specialist users.
Technical Level of Contents
Low. Basic knowledge of map reading and intuitive reasoning are needed.
Application Example and Screen Capture
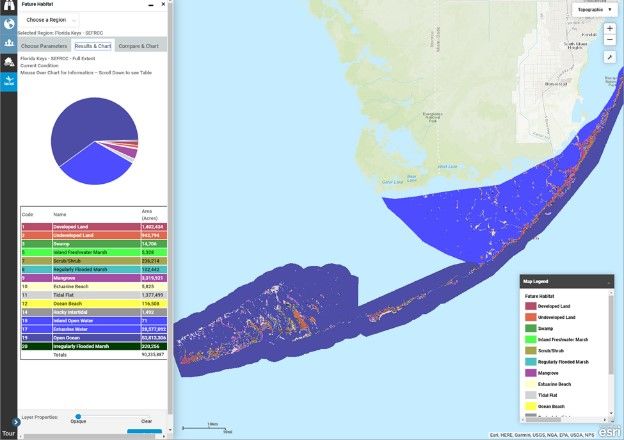
Credit: The Nature Conservancy (coastalresilience.org)
Southeast Florida Regional Compact: Unified Sea Level Rise Projection
Objectives/Goals
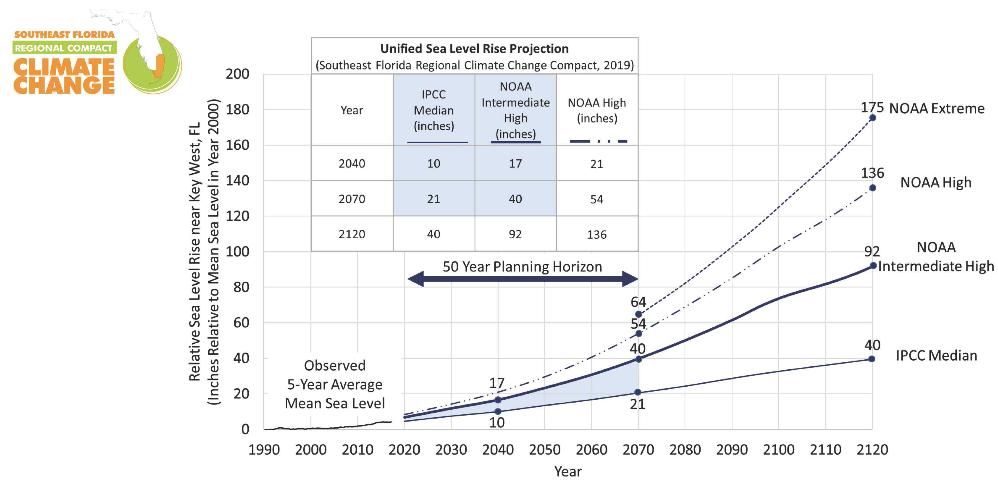
This website links to a PDF (rather than an online tool) compiled by the Sea Level Rise Work Group. The report summarizes the unified and consistent sea level rise projection for southeast Florida to assist in planning, aid in the understanding of potential vulnerabilities, and provide a basis for developing risk-informed adaptation strategies for the region.
Description
In the report, it shows that "in the short term, sea level rise is projected to be 6 to 10 inches by 2030 and 14 to 26 inches by 2060 (above the 1992 mean sea level). In the long term, sea level rise is projected to be 31 to 61 inches by 2100. Sea level rise in south Florida has been of similar magnitude over the same period (NOAA 2015) but is anticipated to outpace the global average due to ongoing variations in the Florida Currents and Gulf Stream. Projected sea level rise, especially by 2060 and beyond, has a significant range of variation as a result of uncertainty in future greenhouse gas emissions and their geophysical effects, the incomplete quantitative understanding of all geophysical processes that might affect the rate of sea level rise in climate models, and the limitations of current climate models to predict the future. This guidance document describes the recommended application of the projection as it relates to both high- and low-risk projects and short- and long-term planning efforts. Also, the Work Group recommends that this guidance be updated every five to seven years because of the ongoing advances in scientific knowledge related to global climate change and potential impacts" (Southeast Florida Regional Climate Change Sea Level Rise Work Group (Compact) 2020).
Source of Information
The Sea Level Rise Work Group of the Southeast Florida Regional Climate Change Compact "reviewed existing projections and scientific literature and developed a unified regional projection for the period from 2010 to 2060" (Southeast Florida Regional Climate Change Sea Level Rise Work Group (Compact) 2020). "In anticipation of the release of the United Nations Intergovernmental Panel on Climate Change Fifth Assessment Report (IPCC 2013), the Sea Level Rise Work Group recommended a review of the projection four years after its release in 2011" (Southeast Florida Regional Climate Change Sea Level Rise Work Group (Compact) 2020). "In September 2014, the Sea Level Rise Work Group was reconvened for the purpose of updating the unified regional projection based on projections and scientific literature released since 2011. This report contains a summary of the projections and publications reviewed and discussed, the methodology for deriving the projection, the recommended unified regional projection, and additional recommendations from the Sea Level Rise Work Group" (Southeast Florida Regional Climate Change Sea Level Rise Work Group (Compact) 2020).
Target Audience
This report is primarily for planning purposes. Therefore, the target audience consists of planners for systems that are vulnerable to rising sea levels.
Technical Level of Contents
The information is highly technical. It is based on current literature and global climate change reports.
Application Example and Screen Capture
Below is an example showing a unified sea level rise for three future periods: 2030, 2060, and 2100.
Credit: Sea Level Rise Work Group. Unified Sea Level Rise Projection, Southeast Florida: https://southeastfloridaclimatecompact.org/wp-content/uploads/2015/10/2015-Compact-Unified-Sea-Level-Rise-Projection.pdf
Southeast Florida Regional Compact: Regional Climate Action Plan (RCAP)
http://www.southeastfloridaclimatecompact.org/regional-climate-action-plan/
Objectives/Goals
The website describes the Regional Climate Action Plan (RCAP) 2.0 as "an easy-to-use online tool that allows various stakeholders to build customizable implementation plans based on who they are—a local government staffer, the director of a utility, or a community member—and their priorities" (Southeast Florida Regional Compact 2020).
Description
"The Regional Climate Action Plan (RCAP) is the Compact's guiding tool for coordinated climate action in southeast Florida to reduce greenhouse gas emissions and build climate resilience. The RCAP provides a set of recommendations, guidelines for implementation, and shares best practices for local entities to act according to the regional agenda. The Southeast Florida Regional Climate Change Compact was executed by Broward, Miami-Dade, Monroe, and Palm Beach Counties in January 2010 to coordinate climate mitigation and adaptation activities across county lines" (Southeast Florida Regional Compact 2020).
Source of Information
2015 Compact Unified Sea Level Rise Projection: https://southeastfloridaclimatecompact.org/wp-content/uploads/2015/10/2015-Compact-Unified-Sea-Level-Rise-Projection.pdf
2011: A Unified Sea Level Rise Projection for Southeast Florida: https://southeastfloridaclimatecompact.org//wp-content/uploads/2014/09/sea-level-rise.pdf
Integrating the Unified Sea Level Rise Projection into Local Plans: https://southeastfloridaclimatecompact.org/wp-content/uploads/2017/01/SLRGuidance-Doc.pdf
2019 State Principles: https://southeastfloridaclimatecompact.org/wp-content/uploads/2018/11/2019-Compact-state-principles-APPROVED.pdf
2019 State Legislative Priorities: https://southeastfloridaclimatecompact.org/wp-content/uploads/2019/01/2019-Compact-state-legislative-priorities-APPROVED-and-prioritized.pdf
2019 Federal Principles: https://southeastfloridaclimatecompact.org/wp-content/uploads/2018/11/2019-Compact-federal-principles-APPROVED.pdf
2019 Federal Legislative Priorities: https://southeastfloridaclimatecompact.org/wp-content/uploads/2018/11/2019-Compact-federal-legislative-priorities-APPROVED.pdf
Target Audience
The tool has sections for federal agencies, higher education institutions, local businesses, municipalities, nonprofit organizations, regional agencies, regional climate compacts, and state agencies.
Technical Level of Contents
This website lists technical documents related to climate adaptation and mitigation. The case studies are digestible to a general audience.
RAND Corporation
https://www.rand.org/content/dam/rand/pubs/research_reports/RR1900/RR1932/RAND_RR1932.pdf
Objectives/Goals
This resource is a report produced by the RAND Corporation. The goal of the report is to summarize research in the south Florida region in order to help improve the region's capacity to adapt to both a changing climate and changes in land use and to better understand the trade-offs and costs associated with actions and no action, given future climate projections.
Description
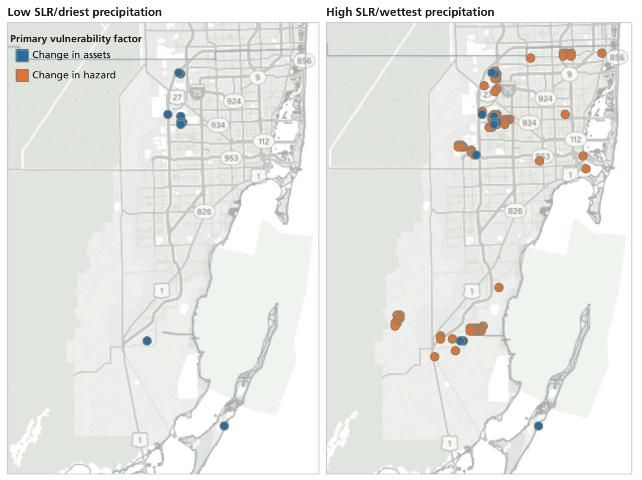
The website links to a 112-page research report. The report combines existing land use and economic development plans in the region with climate projections to identify vulnerabilities and produce a decision support tool. The research was conducted by the RAND Infrastructure Resilience and Environmental Policy Program, which performs analyses on urbanization and other environmental stresses. The report includes information on their analytic approach; the scope of the analysis; integrated modeling system, data, and methods used to develop futures for evaluating southeast Florida's vulnerabilities to climate and population growth; development of plausible future sea level rise and precipitation conditions for use in a vulnerability analysis; vulnerabilities of the area to flooding from rising groundwater levels; and impacts of both sea level rise and intense precipitation events on saltwater intrusion and vulnerability of drinking water wells to higher levels of salinity.
Source of Information
The report utilizes hydrology data from the South Florida Water Management District, USGS, and Sea Level Scenarios from the U.S. National Climate Assessment. Census data, tax data, and land use data were also considered. The decision support tool, described within the report, was developed through a co-production process with various stakeholder groups.
Target Audience
The primary audience for this work is local and regional officials, planners, engineers, and residents of southeast Florida. The report is also relevant to other coastal regions in the U.S. and elsewhere that are seeking to better understand their vulnerabilities to a changing climate while promoting economic development and ecosystem sustainability.
Technical Level of Contents
High. The report contains a lot of technical information but is a good resource for those familiar with the terminology.
Note
This report focuses on how flooding and saltwater intrusion affect the urban and built environment. The report also quantifies the "assets" that will be impacted by future climate change scenarios. It identifies key metrics to consider when determining areas at risk in the future. It would be beneficial if the decision support tool was available online.
Application Example and Screen Capture
The report provides many figures and tables that show the results of the analyses. For example, the reader can see areas that are threatened from ground flooding in two different scenarios.
Credit: Reprinted with permission from original source and copyright holder, RAND Corporation, Santa Monica, CA. 2018. Adapting Land Use and Water Management Plans to a Changing Climate in Miami-Dade and Broward Counties, Florida. https://www.rand.org/pubs/research_reports/RR1932.html
Summary
In this article, we reviewed 17 different online sources, including interactive mapping and data visualization tools as well as detailed reports that can help users understand sea level rise and its impacts on daily life. These tools translate scientific findings and research results into information and data that users can explore, making them useful to coastal homeowners, concerned residents, researchers, and engineers. These online sources can help UF/IFAS Extension agents find content and tools that can be incorporated into established or developing programs related to sea level rise.
References
Climate Central. 2020. "Surging Seas: Risk Zone Map – Global." Accessed March 28, 2020. https://sealevel.climatecentral.org/maps/risk-zone
Coastal Resilience. 2018. "Coastal Resilience." Accessed March 28, 2020. https://coastalresilience.org/
Eyes on the Rise. 2016. "Eyes on the Rise." Accessed March 28, 2020. http://www.eyesontherise.org/
FloodiQ. 2019. "FloodiQ.com." Accessed March 28, 2020. https://floodiq.com/#
Florida International University (FIU). 2020. "Institute of Environment: Eyes on the Rise Toolbox." Accessed March 28, 2020. https://environment.fiu.edu/coastlines-and-oceans/resources/eyes-on-the-rise-toolbox/index.html
IPCC. 2013. "Climate Change 2013. The Physical Science Basis. Contribution of Working Group I to the Fifth Assessment." In Report of the Intergovernmental Panel on Climate Change, edited by S. Solomon, D. Qin, M. Manning, Z. Chen, M. Marquis, K. B. Averyt, M. Tignor, and H. L. Miller. Cambridge, United Kingdom: Cambridge University Press.
Miami-Dade County. 2020. "Miami-Dade Emergency Management, FLIPPER 2.0." Accessed March 28, 2020. https://www.arcgis.com/apps/webappviewer/index.html?id=86144da3fdd1487a82d53cbc196d0280
National Oceanic and Atmospheric Administration. 2020a. "New 5 Year Strategy and Vision for CO-OPS." Accessed September 25, 2023. https://tidesandcurrents.noaa.gov/news/strategic-plan-2019-2023.html
National Oceanic and Atmospheric Administration. 2020b. "Tides & Currents: Sea Level Trends." Accessed March 28, 2020. https://tidesandcurrents.noaa.gov/sltrends/sltrends.html
Naturally Resilient Communities. n.d. "Using Nature to Address Flooding." Accessed March 28, 2020. http://nrcsolutions.org/
NOAA. n.d. "Relative Sea Level Trend: 8724580 Key West, Florida." Accessed on September 25, 2023. https://tidesandcurrents.noaa.gov/sltrends/sltrends_station.shtml?id=8724580
Southeast Florida Regional Climate Change Sea Level Rise Work Group (Compact). February 2020. A document prepared for the Southeast Florida Regional Climate Change Compact Climate Leadership Committee. 36 pp. https://southeastfloridaclimatecompact.org/wp-content/uploads/2015/10/2015-Compact-Unified-Sea-Level-Rise-Projection.pdf
Southeast Florida Regional Compact. 2020. "What is the RCAP?" Accessed March 28, 2020. https://southeastfloridaclimatecompact.org/about-us/what-is-the-rcap/
U.S. Army Corps of Engineers. n.d. "Climate Preparedness and Resilience." Accessed March 28, 2020. https://www.usace.army.mil/corpsclimate/
U.S. Climate Resilience Toolkit. 2015. "U.S. Climate Resilience Toolkit: About." Accessed March 28, 2020. https://toolkit.climate.gov/content/about