Credit: Esri, HERE, Garmin, FAO, NOAA, OpenStreetMap contributors, and the GIS User Community
Florida’s water use has been steadily increasing during the last 50 years (United States Geological Survey n.d.). Water use is expected to continue increasing during the next 50 years as well. With the current trend, development-related water demand is expected to more than double in central Florida by 2070, compared to 2010 (UF Geoplan Center 2016). Water conservation efforts will have significant social, economic, and environmental impacts (Borisova 2017). To best support these conservation efforts, it is important to have a deeper understanding of residential water use.
While homes have meters that measure their individual water use, H2OSAV goes a step further by providing analysis tools and context for the data. H2OSAV is a UF/IFAS Extension program that archives multiyear datasets developed for individual water utility territories, and merges the following:
- Metered household water use data
- Conservation program data
- Property appraiser data
H2OSAV pairs these datasets with analytical tools. This provides two valuable functions. First, H2OSAV helps find important patterns in water use. Second, we can evaluate the success of ongoing water conservation programs. These patterns can help support policies designed to reduce excessive water use. They also give us the ability to provide key insights that assist in targeting homes with high water use.
As a UF/IFAS Extension program, H2OSAV is sharing these insights through a series of EDIS publications. The goal of this fact sheet is to provide current, basic information about residential water use in specific water utility territories.
In this fact sheet, you will learn:
- Basics about water consumption for single-family, detached homes in Orange County, Florida (see Figure 1)
- Information about the highest water users and the need to target them
- The impact of irrigation on water consumption
The information in this series should be helpful for everyone, including water utility conservation staff, UF/IFAS Extension agents, and Florida homeowners, in their efforts to reduce water consumption.
This fact sheet focuses only on single-family, detached (SFD) homes located in Orange County, Florida. The number of SFD homes included in this study is 222,129.
For an overview of the information in this fact sheet, see the infographic at the end of this publication.

Credit: UF/IFAS H2OSAV
Methods
This case study is based on metered household water consumption for homes in Orange County, Florida. Data comes from calendar years 2012 through 2019.
To ensure accurate estimates, consumption data were screened to remove outliers. This analysis includes occupied, single-family, detached homes that meet the following criteria:
- Located in Orange County, Florida
- Designated as a single dwelling unit (“single-family”) on its own lot, without physical attachment to other homes (“detached”)
- “Typical size”
- No more than 6,000 square feet of conditioned living space
- No more than 6 bedrooms
- No more than 6 bathrooms
- Lot size no more than 2 acres
- Occupied during the analysis year
- 9 months or more of non-zero indoor water use
- Monthly records with water use equal to zero were removed
Homes that did not meet these criteria were not used in the analysis. After screening, this study included 222,129 SFD homes. This represents 68.4% of the SFD homes in Orange County.
Average Total Daily Water Use
Average daily water use was calculated for each household, each calendar year. It was calculated by taking the total monthly water use and dividing it by the total number of days in each monthly billing cycle.
Consumption Groups
SFD homes were divided into four equal quartile groups based on their average daily water use in 2019.
Irrigation vs. Non-Irrigation
For this study in Orange County, there were 172,843 single-family, detached homes with only one water meter (single-meter) and 66,126 homes with two separate water meters (dual-meter). For dual-meter homes, one meter is used solely for “irrigation,” specifically servicing an in-ground irrigation system, and one meter is used for all other “non-irrigation” uses for water. While “non-irrigation” primarily includes indoor uses such as plumbing (shower, laundry, etc.), it may also include pools, car washing, and other outdoor purposes.
Monthly consumption values for single-meter properties were disaggregated to evaluate “irrigation” and “non-irrigation” water use. Single-meter properties do not differentiate between potable water used for irrigation and potable water used for indoor use. Therefore, the average amount of water used indoors by dual-meter properties was used as an estimate of indoor use for single-meter homes. Because water use varies by month and year, the average indoor water use for dual-meter properties was calculated for each utility territory in each month of each year. Irrigation use was then calculated for each single-meter home as the difference between its monthly total water use and the estimated indoor use, for each month of each year.
Other
“Living Space” and “Size of Home” refer to the enclosed portion of the house that can be air-conditioned or heated. This excludes porches, carports, etc.
What is the average home like in Orange County?

Credit: Maxar Technologies, U.S. Geological Survey, Google
Based on 2019 data, the average SFD home in Orange County:
- Was built in 1988,
- Has 3.4 bedrooms,
- Has 2.3 baths,
- Has 1,971 square feet of living space,
- Has a 7,114-square-foot yard, and
- Is on a 0.22-acre lot.
What is the average daily water use?
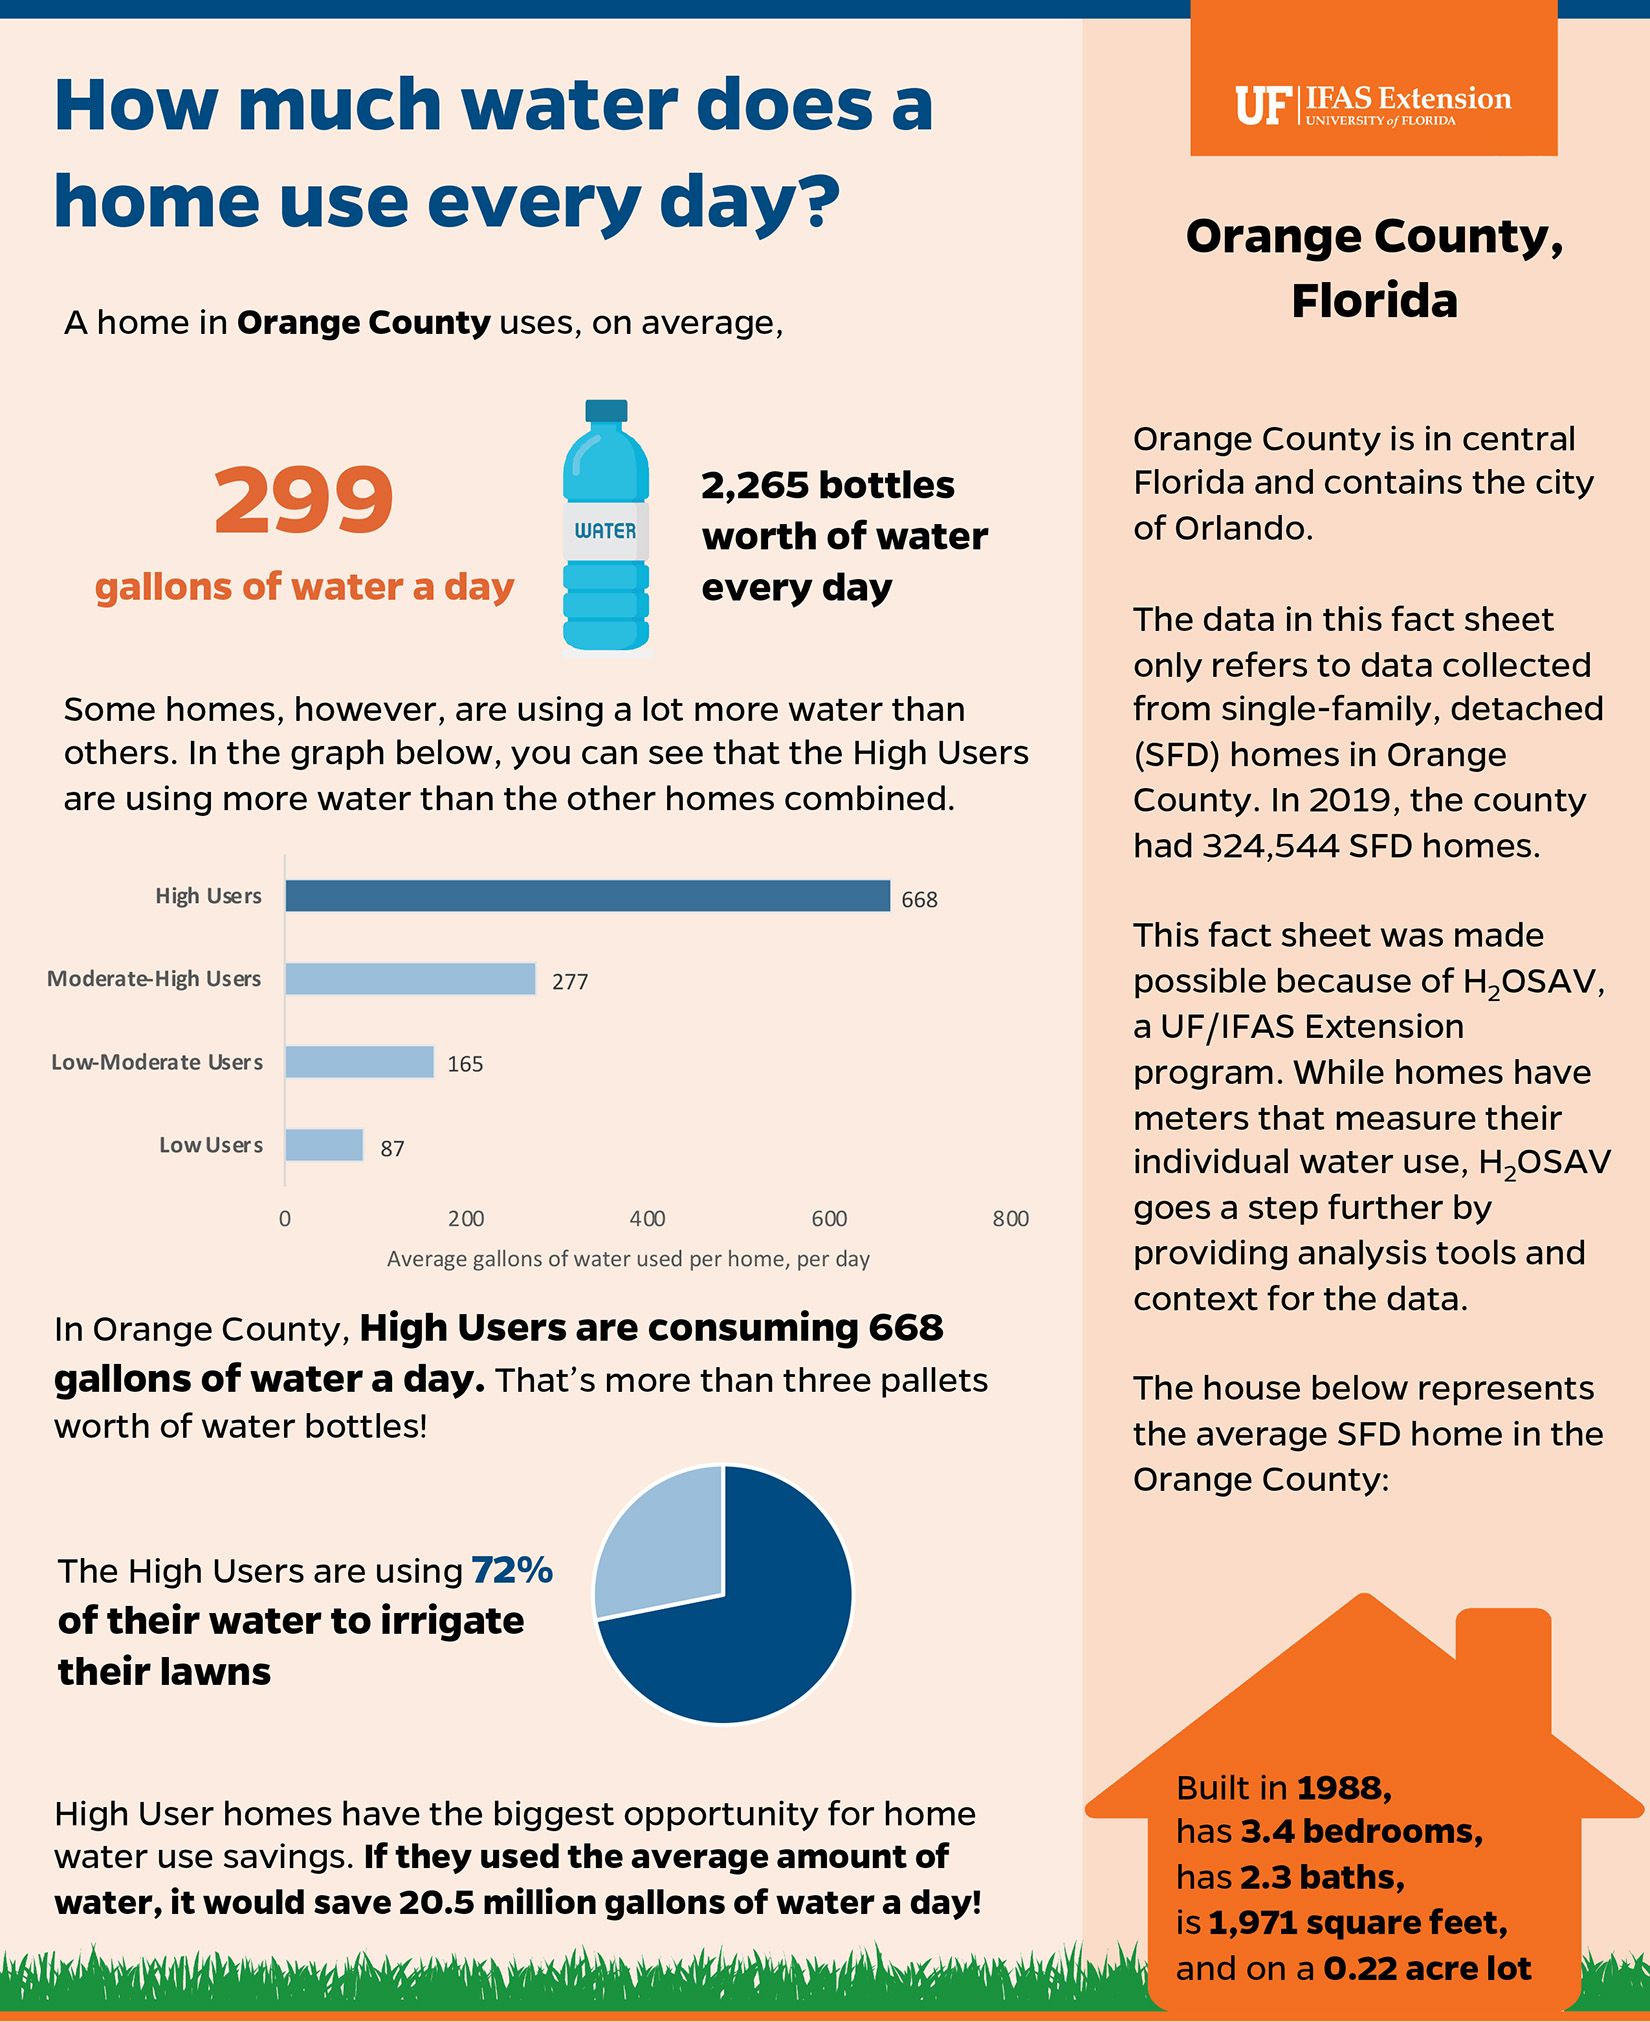
In 2019, SFD homes in Orange County used an average of 299 gallons of water per day. That is equal to 2,265 standard (16.9 fl oz) bottles of water used every day. This would be more than a pallet and a half of water bottles daily.

Credit: UF/IFAS
As shown in Figure 5, SFD household water consumption has been fairly steady over the last eight years, ranging from 284 to 310 gallons per day.

Credit: UF/IFAS H2OSAV
How much water do the highest-consuming homes use?
Some homes use a lot more water than others. We wanted to look at the differences between these homes to understand why. We divided homes into four groups (quartiles) based on the amount of water used in 2019. They were grouped as follows:
- The top 25% of homes were labeled as “High Users.”
- The next 25% were labeled “High–Moderate Users.”
- The next 25% were labeled “Low–Moderate Users.”
- The bottom 25% were labeled “Low Users.”
The graph below (Figure 6) compares the average daily water use in these four user groups. We can see that High Users in Orange County use 668 gallons of water per day. That is more water than the other three groups combined and over twice the average for all homes in the county.

Credit: UF/IFAS H2OSAV
As mentioned before, the average daily water use for the entire study group is 2,265 bottles worth of water. In comparison, the highest users consume 5,059 bottles worth of water every day. Figure 7 shows that this is more than 3.5 full pallets worth of water daily.

Credit: UF/IFAS H2OSAV
What are highest-consuming homes using their water for?
Most newer homes have in-ground irrigation systems. A home with an in-ground irrigation system, on a typical ¼-acre lot, uses over 2,000 gallons of water each time the lawn is watered.
Figure 8 highlights the impact of irrigation on overall water use. The graph shows water use divided between irrigation and non-irrigation. Irrigation means watering lawns using an in-ground irrigation system. Non-irrigation refers to water used for all other purposes (shower, laundry, pool, garden hose, etc.).
As Figure 8 shows, the dramatically higher water use of the High Users group is mainly due to irrigation. The High Users are using more than 70% of their water irrigating their yards.
Factors such as pools and larger homes, as seen in Table 1, could only contribute to the comparatively small increase in non-irrigation water use.

Credit: UF/IFAS H2OSAV
Discussion: How does this affect our future?
Florida has the third largest population in the United States (United States Census Bureau n.d.). That population is expected to grow an average of 1.5% each year between 2018 and 2022. This is double the national population growth rate (Office of Economic and Demographic Research 2018). In Orange County, an additional 37,292 SFD homes were built between 2012 and 2019. This means that 11.5% of SFD homes currently in the county were built during the course of seven years. We need to prepare for this increase in homes and population, because they will continue to have an impact on our water resources.
It is understandable that subdivisions and individual homes use different amounts of water. It is critical, however, to recognize that some homes in this area (“High Users”) are using over twice the average amount of water. Understanding the highest water users makes it possible to target water conservation efforts. This is practical, because it is most effective to target those with the highest water use (Taylor, Jones, and Kipp 2014). Specifically, given that irrigation is a large portion of the High Users’ overall water use, targeting irrigation in high-use homes provides the best opportunity for water conservation.
This fact sheet has provided basic information about water consumption in Orange County (FL), stated the importance of knowing the High Users, and raised awareness of the impact of irrigation. This is beneficial to help target existing high-use homes, but it also assists with informing future development practices. In addition, homeowners can follow best management practices to reduce their water consumption. EDIS publication AE472, Frequency of Residential Irrigation Maintenance Problems, investigates common issues with residential irrigation in Florida (Olmstead and Dukes 2017). Olmstead and Dukes found that the five most common issues with residential irrigation are:
- Irrigation of turf and landscape area in the same zone
- Mixed sprinkler/emitter sizes and unmatched application rates in the same zone
- Blockage of water stream by vegetation
- Excessively frequent operation
- Excessively long operating time
References
Borisova, T., L. A. Warner, J. Searcy, A. K. Chaudhary, and M. Dukes. 2017. Estimating Benefits of Residential Outdoor Water Conservation: A Step-by-Step Guide. FE1009. Gainesville: University of Florida Institute of Food and Agricultural Sciences. https://edis.ifas.ufl.edu/fe1009
Office of Economic and Demographic Research. 2018. “Florida: An Economic Overview.” Accessed August 9, 2019. http://edr.state.fl.us/Content/presentations/economic/FlEconomicOverview_12-26-18.pdf
Olmstead, T. R., and M. Dukes. 2017. Frequency of Residential Irrigation Maintenance Problems. AE472. Gainesville: University of Florida Institute of Food and Agricultural Sciences. https://edis.ifas.ufl.edu/ae472
Taylor, N. W., P. H. Jones, and M. Jennison Kipp.2014. “Targeting Utility Customers to Improve Energy Savings from Conservation and Efficiency Programs.” Applied Energy 115:25–36. https://doi.org/10.1016/j.apenergy.2013.10.012
United States Census Bureau. n.d. “U.S. and World Population Clock.” Accessed August 4, 2021. https://www.census.gov/popclock/
United States Geological Survey. n.d. Historical Water-Use In Florida. Accessed April 26, 2021. https://www.usgs.gov/centers/car-fl-water/science/historical-water-use-florida?qt-science_center_objects=0#qt-science_center_objects
University of Florida GeoPlan Center (UF GeoPlan Center). 2016. Water 2070 Mapping Florida's Future – Alternative Patterns of Water Use in 2070. http://1000friendsofflorida.org/water2070/wp-content/uploads/2016/11/water2070technicalreportfinal-text-TOC.pdf
Table 1: Home characteristics by consumption group.