Introduction
The agriculture, forestry, fishing, and hunting sector relies on a subsector known as “support activities for agriculture and forestry” to provide essential services and key inputs for various production practices. Three industry groups make up this subsector: crop production, animal production, and forestry (BLS 2021a). Workers from within a producer’s organization or hired through external sources perform support services, which provide necessary inputs in the production process for a given crop, animal, or forestry industry (US Census 2021). As our population continues to grow, so will the demand for food. Thus, it is vital to prioritize research, training, and educational efforts in order to protect the health and safety of farmworkers who work to meet this demand.
The Bureau of Labor Statistics (BLS) investigates annual totals for injuries and fatalities but does not provide details on these events. This information could be helpful for prevention efforts. Additionally, nonfatal occupational injury data from the BLS are not available for the state of Florida. The purpose of this publication is to examine nonfatal injuries and illnesses resulting from support activities for crop production and animal production workers in Florida. This article is targeted to stakeholders, workers, and Extension educators.
Support Activities for Crop and Animal Production
Support activities for crop production provide specific labor needs for agricultural production, including (IBISWorld 2022):
- Cotton ginning
- Soil preparation, planting, and cultivating
- Crop harvesting, primarily by machine
- Postharvest crop activities (except cotton ginning)
- Farm labor contractors and crew leaders
- Farm management services
Support activities for animal production provide support for one or more of the following: breeding services for animals, boarding horses, dairy livestock spraying with parasiticides, and sheep dipping and shearing (GovTribe 2022).
According to data from BLS’s Survey of Occupational Injuries and Illnesses (SOII), the nationwide support activities for crop production had an injury and illness rate of 177.8 per 10,000 workers for nonfatal cases involving days away from work in 2019. The injury and illness rate for the support activities for animal production was 163.6 per 10,000 workers (BLS 2021b). Gathering data about on-the-job injuries and illnesses is important because the data can be used by farm owners, managers, and employees to identify, mitigate, or eliminate hazards. This report describes the incidences of injury/illness claims for the support activities for the crop and animal production subsector in Florida. Findings from this examination of data from Workers’ Compensation claims can help to build awareness and support the development of safety interventions to prevent work-related health hazards in these sectors in the future. This article is targeted to interested individuals, Extension faculty, and researchers.
Methods
Workers’ Compensation data from 2010 to 2019 were compiled from the Florida Department of Financial Services Division of Workers’ Compensation. Industries were classified by the North American Industry Classification System (NAICS). The industry groups and their respective NAICS codes reported in this publication are Support Activities for Crop Production (NAICS 1151) and Support Activities for Animal Production (NAICS 1152). Florida Workers’ Compensation claims data included variables for the date of the incident, injuries resulting in death, injury location (city, county, state, zip code), nature of the injury, injured body part, and cause of injuries. Data analyses were conducted using Microsoft Excel; results are presented as counts and percentages. Maps were developed using Tableau Desktop.
Results
From 2010 to 2019, there was a total of 2,424 nonfatal injuries and 12 fatal injuries for support activities for crop production and 306 nonfatal injuries and 1 fatal injury in support activities for animal production in Florida. Therefore, while nonfatal injuries are not as severe as fatal injury cases, they remain important to examine because they make up the vast majority of Workers’ Compensation claims made over the decade. The following tables and figures present findings solely from nonfatal cases.
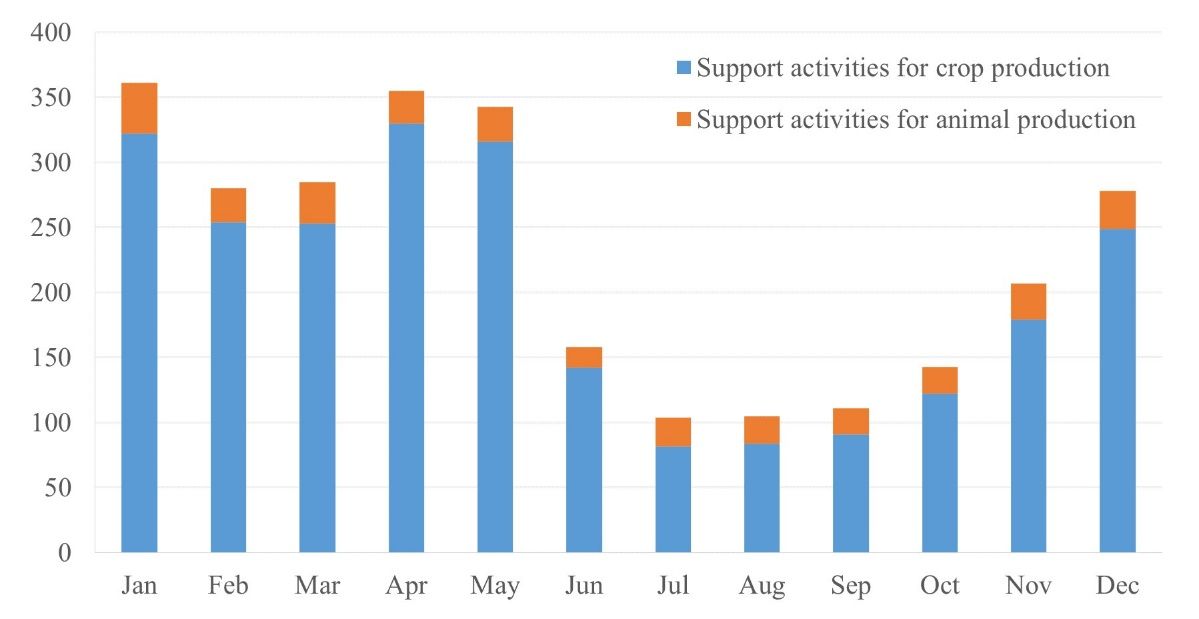
Figure 1 shows the monthly distribution of the total number of injury/illness claims. Injuries and illnesses associated with crop production support activities heavily occurred in the winter and spring. The lowest number of injuries was reported in July (n=82) and the greatest number was in April (n=330). The monthly distribution of the number of injuries and illnesses in support activities for animal production was consistent, with most claims occurring in January (n=39), March (n=32), and December (n=29).

Credit: Serap Gorucu, UF/IFAS
Over the study period, the patterns for annual injury/illness rates observed were different for each sector of the industry. Animal production claims peaked in 2012 and 2015, producing a bi-modular pattern, while crop production had a more irregular trend, with highs in 2013, 2018, and 2019 (Table 1). Among the subcategories within support activities for crop production, 45% of claims were made by a single industry, farm labor contractors (NAICS 115115). Establishments in this industry primarily engage in supplying labor (workers) to support agricultural production or harvesting of fruit or vegetable farms, because these commodities have a greater need for seasonal workers. Other support activities for crop production claims were related to: postharvest crop activities (23%); farm management services (19%); crop harvesting (primarily by machine); soil preparation, planting, and cultivating; and cotton ginning (12%).
Table 1. Trends in employment and Workers’ Compensation injury/illness claims.
Claims by County
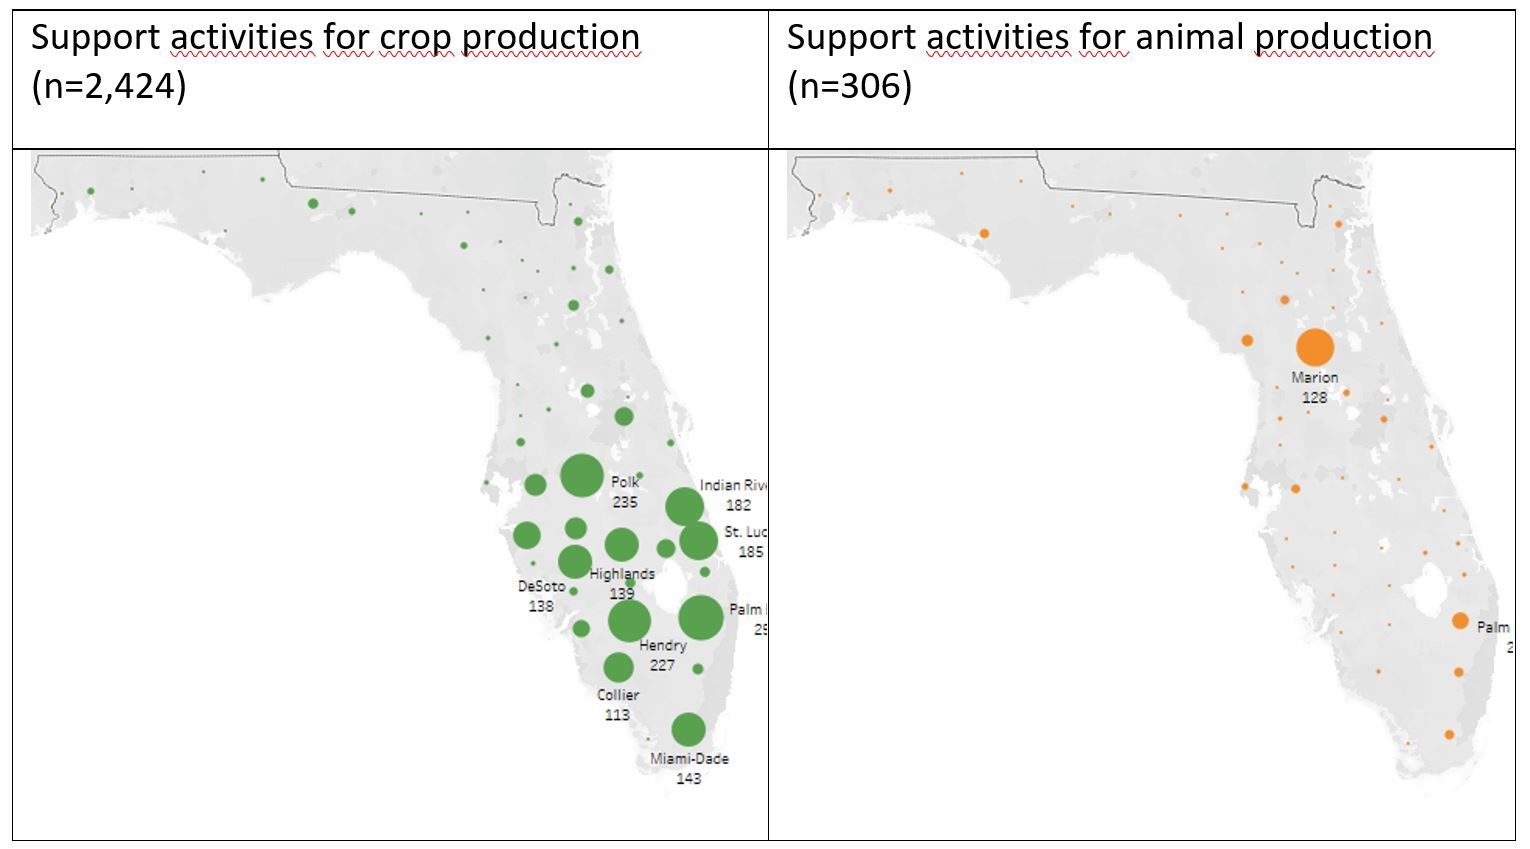
Figure 2 shows the distribution of injury/illness claims by industry groups among Florida counties. Most claims related to the support activities for crop production were distributed heavily in the central and southern regions. Animal production support activities-related claims were mostly concentrated in Marion County, followed by Palm Beach County, with other incidents scattered across Florida.

Credit: Serap Gorucu, UF/IFAS
Body Part Injured
Table 2 shows the injured body part categories for each industry group. For both industries, the most common body parts injured were the upper extremities (i.e., mostly shoulders, fingers, and hands). This was followed by injuries to lower extremities (i.e., mostly knees, ankles, lower legs, and feet). Trunk injuries involved mostly lower back, abdomen, and chest injuries. Head injuries mostly involved the eyes among crop production support activities workers.
Table 2. Region of body injured, categorized by industry group (2010–2019).
Major Cause of Injuries/Illnesses
“Fall, slip, and trip” was the most common cause of injury, comprising 31% of the crop production support activities claims. A particular area of concern in this category is falling from ladders, which accounted for 300 injuries. Strains were the second most common injury cause for the crop production support workers. Strain injuries were mostly from lifting, twisting, and pushing or pulling. Animal production support workers were mainly injured from being struck or injured by animals. Fall, slip, or trip injuries were the second most common cause, followed by strain injuries by lifting, pushing, or pulling and twisting.
Table 3. Causes of injury/illness by industry groups (2010–2019).
Summary
This study was an initial step in examining the prevalence of nonfatal injuries and illnesses endured by workers within the support activities for the crop and animal production subsector in Florida over a decade (2010 to 2019). Support activities such as harvesting crops, farm labor contracting, and animal breeding services provide key inputs for agricultural production. The data set used for analysis was compiled from Workers’ Compensation claims in Florida and provided data on 2,730 nonfatal injuries/illnesses. The majority of cases were related to support activities for crop production; the farm labor contractor industry made up nearly half of all of these claims.
Crop production support workers were mostly injured in the winter and spring when labor requirements were higher for fruit and vegetable production. Workers mostly injured their upper and lower extremities. Falls and strain injuries were the two most common causes of injury for crop production support workers. Animal production support workers were mostly injured by “struck by animal” incidents. Similarly, most of the workers sustained injuries to upper and lower extremities. Most animal production support workers’ claims were from Marion County. Crop production support workers’ claims were mostly from the central and southern regions of Florida.
Understanding the occurrence of injuries among the support activity for crop and animal production workers is critical for implementing effective prevention programs. Even though Workers’ Compensation data can help us to understand the specifics of the injuries, the demographics and the narrative description of injury/illness cases were not provided in the data sets, making it harder to build specific intervention programs.
Extension agents can use these results to choose priority safety areas for farm safety education. Findings from this study revealed that most injuries/illnesses reported in Florida occurred during winter and spring. Conducting safety education/training in the fall and early winter months, prior to busier harvesting seasons, may be the most beneficial to the greatest number of workers. However, we recommend conducting these safety trainings whenever they are needed.
Acknowledgments
We express our gratitude to Dr. Glenn Israel for his helpful comments on a previous version of this article, along with the entire SCCAHS Evaluation Team and the UF College of Liberal Arts and Sciences Active Learning Program for their partnership and support in conducting this study.
References
BLS. 2021a. “Industries at a Glance, Support Activities for Agriculture and Forestry.” Accessed October 4, 2021. https://www.bls.gov/iag/tgs/iag115.htm
BLS. 2021b. “Nonfatal Cases Involving Days away from Work: Selected Characteristics (2011 Forward) (Years: 2011–2019).” Washington, D.C.: Survey of Occupational Injuries and Illnesses, U.S. Department of Labor. Accessed July 26, 2021. https://data.bls.gov/PDQWeb/cs
BLS. 2021c. “Quarterly Census of Employment and Wages, U.S. Department of Labor.” Accessed July 28, 2021. https://www.bls.gov/cew/data.htm
GovTribe. 2022. “Support Activities for Animal Production.” Accessed January 31, 2022. https://govtribe.com/category/naics/115210-support-activities-for-animal-production
IBISWorld. 2021. “Crop Services Industry in the US—Market Research Report.” Accessed January 31, 2022. https://www.ibisworld.com/united-states/market-research-reports/crop-services-industry/
US Census. 2021. “North American Industry Classification System: Crop Production 2017 Definition.” Accessed October 4, 2021. https://www.census.gov/naics/?input=115&year=2017&details=115