Introduction
The crop production industry subsector consists of establishments such as farms, groves, and nurseries that are engaged in growing crops, trees, and seeds for food and fibers (US Census 2021). Various activities and tasks create numerous safety hazards and risks for crop production workers. According to the US Bureau of Labor Statistics’ (BLS) Census of Fatal Occupational Injuries (CFOI), 221 crop production workers were killed in the nation in 2019 (BLS 2021a). The BLS investigates annual totals for injuries and fatalities, but does not provide details on these events that could be helpful to prevention efforts. Additionally, nonfatal occupational injury data from the BLS are not available for the state of Florida. The purpose of this publication is to examine nonfatal injuries and illnesses among crop production workers in Florida and to share findings with stakeholders, workers, and Extension educators/faculty in the industry.
Crop Production Subsector
The crop production subsector grows crops for food and fiber and is divided into five industry groups (BLS 2021a):
- Oilseed and grain farming
- Vegetable and melon farming
- Fruit and tree nut farming
- Greenhouse, nursery, and floriculture production
- Other crop farming
National data show steady growth in the crop production industry subsector (USDA 2021). The number of private crop production establishments increased from 43,323 in 2011 to 49,615 in 2021 (BLS 2021a).
According to data from BLS’s Survey of Occupational Injuries and Illnesses (SOII), the nationwide crop production subsector had an injury and illness rate of 141.5 per 10,000 workers for nonfatal cases involving days away from work in 2019 (BLS 2021b). Table 1 breaks down the nonfatal injury rates for specific groups within the crop production industry subsector during that year, with fruit and tree nut farming reporting the highest rates of injury and illness.
Table 1. Nonfatal injuries among crop production workers in the United States, 2019.
Gathering data about on-the-job injuries and illnesses is important because the data can be used by farm owners, managers, and employees to identify, mitigate, or eliminate hazards. Although national data for nonfatal injuries and illnesses are available, BLS has no data for the state of Florida. This report describes the incidences of injury and illness claims for the crop production subsector in Florida and takes a much-needed initial step towards safety interventions to prevent injuries in these sectors in the future.
Methods
Examining Workers’ Compensation claims data is an effective way of evaluating the risks posed to employees in agricultural industries and identifying methods to reduce the risk of injury. This report is based on the Workers’ Compensation data provided by the Florida Department of Financial Services’ Division of Workers’ Compensation. Data included claims reported under the North American Industry Classification System (NAICS) related to crop production (code 111) from 2010 to 2019.
Data from Workers’ Compensation claims in Florida included variables for the date of the incident, injuries resulting in death, injury location (city, county, state, zip code), nature of the injury, injured body part, and cause of injuries. The 6-digit NAICS codes were also included. Agricultural industries in Florida are required to have workers' compensation for six or more regular employees and/or 12 seasonal employees who work more than 30 days (FDFS 2022).
A total of 8,383 injury or illness claims related to crop production were reported. Overall, 32 injuries resulted in fatalities, and 100 injury claims from other states were removed from the final data set. Data analyses were conducted using Microsoft Excel, and maps were developed using Tableau Desktop.
Results
From 2010 to 2019, a total of 8,351 claims were reported among workers in crop production (NAICS 111) in Florida, and approximately 835 claims were filed per year (Table 2). Since 2010, the injury rate per 10,000 workers averaged 174 injuries or illnesses per year. Over the ten-year period, the data revealed that most of the reported claims related to crop production in Florida occurred during the winter and spring seasons. Over the course of the study period, the total number of claims per month ranged from 433 in July to 914 in May.
Table 2. Trends in employment and Workers’ Compensation claims in Florida.
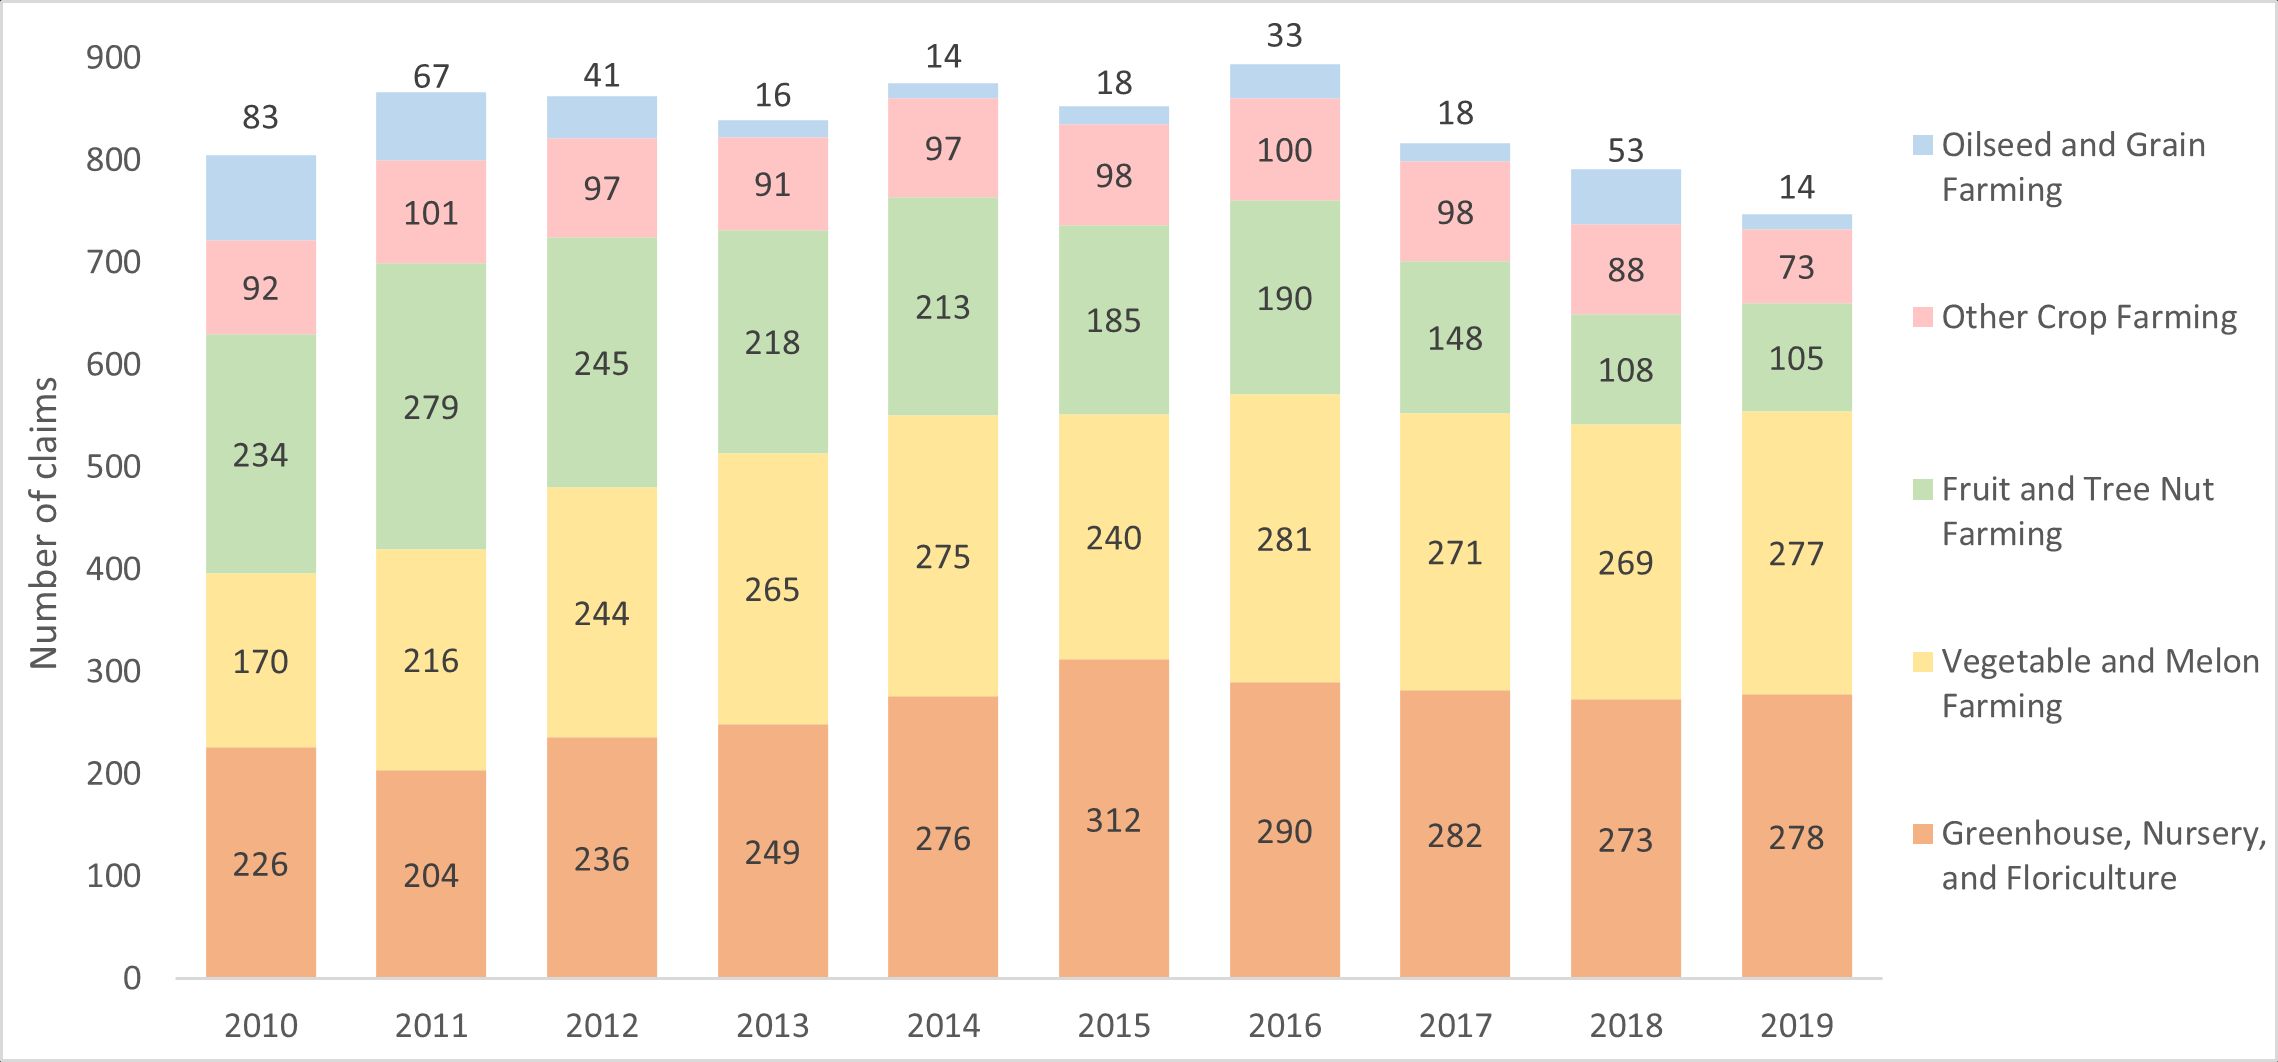
Table 3 and Figure 1 show the distribution of the claims by crop production industry groups. Most injuries occurred in the greenhouse, nursery, and floriculture industry group. Within this group, claims were mostly from floriculture (n=1,112) and nursery and tree production (n=1,056). The vegetable and melon farming industry group had the second-highest number of injury/illness claims. Fruit and tree nut farming-related injuries were mostly related to the orange (n=791) and other citrus (n=354) industries. Sugarcane farming workers accounted for almost half (n=465) of the other crop farming injuries. Workers in the oilseed and grain farming group had the fewest injury/illness claims.
Table 3. Distribution of injury claims per crop production industry in Florida, 2010–2019.
When considering the trends over the study period for each industry group, we observed an increased number of claims in vegetable and melon farming, while the number of claims decreased by more than half in fruit and tree nut farming (Figure 1). Greenhouse, nursery, and floriculture production was consistently the industry group with the highest number of claims.

Credit: Joelle Francois, UF
Claims by County
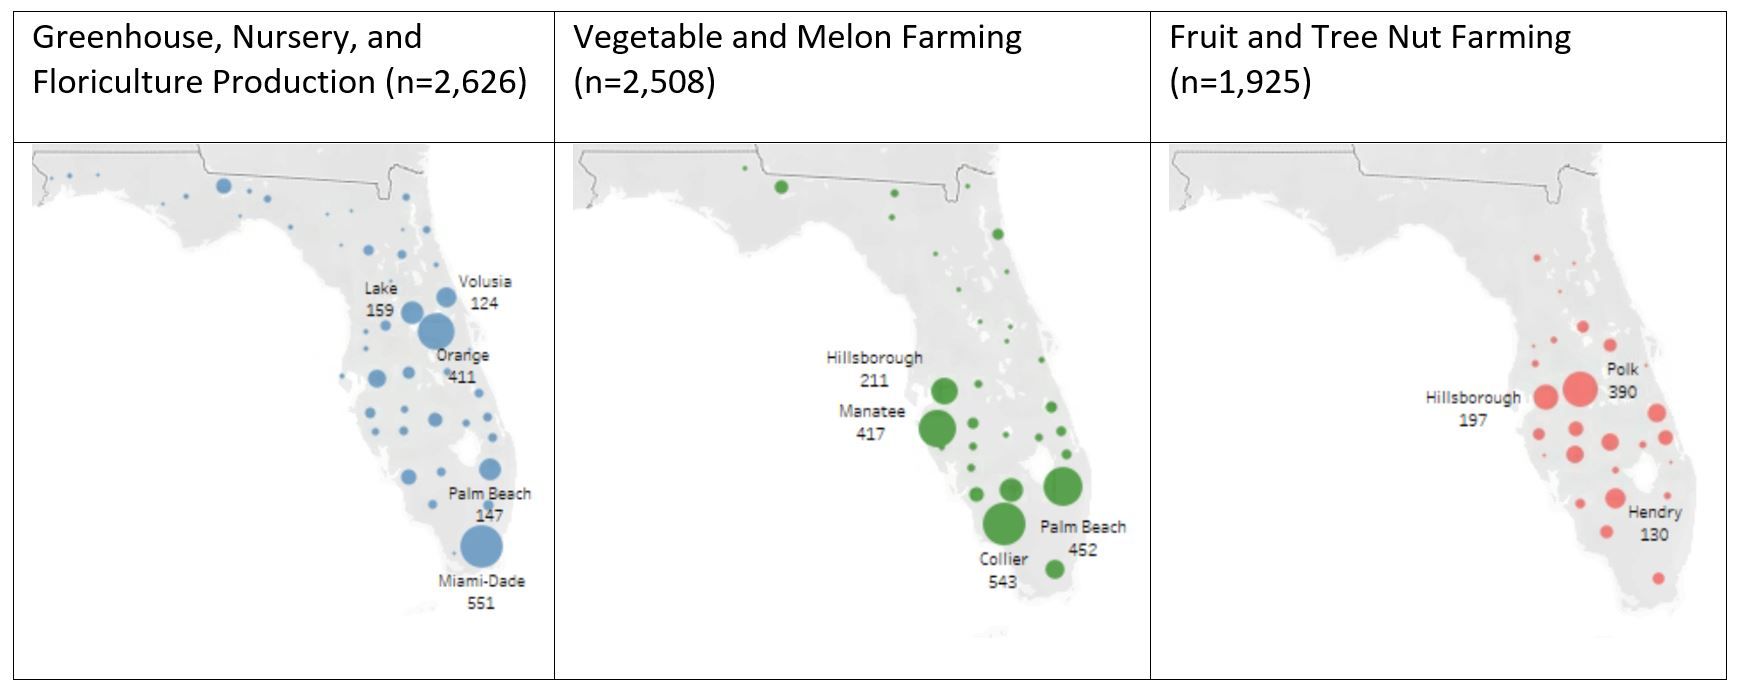
The three maps below illustrate the distribution of claims by crop production industry groups among counties in Florida. Overall, instances of illness and injury captured by Workers’ Compensation data were distributed most heavily in central and south Florida. In Miami-Dade and Orange Counties, greenhouse, nursery, and floriculture workers experienced the highest number of occupational injuries/illnesses (Figure 2b). Claims made by vegetable and melon farmworkers were mostly reported in Collier, Palm Beach, and Manatee counties. Polk, Hillsborough, and Hendry Counties accounted for the most fruit and tree nut farming-related injuries/illnesses.

Credit: Serap Gorucu, UF/IFAS
Body Part Harmed
Table 4 shows the injured body part categories for each industry group. The most common area injured was the upper extremities (27%), which included mostly shoulders, fingers, and hands. Lower extremities (mostly knees, ankles, and feet) were the second most common, comprising 24% of injuries. Trunk injuries (20%) involved mostly lower back, abdomen, and chest injuries. Head injuries mostly involved eyes (44% of head injuries).
Table 4. Bodily injuries among crop production workers by industry in Florida, 2010–2019.
Major Cause of Injuries/Illnesses
Two causal subcategories combined accounted for half of all Workers’ Compensations claims in Florida (Table 5). “Fall, slip, or trip” was the most frequent cause of injury, making up 26% of cases; it was the most common among both fruit/tree nut farming workers and vegetable/melon farming workers. Strains resulting from lifting, pushing, pulling, twisting, and holding or carrying heavy objects were the second most common injury cause (24%).
Table 5. Causes of worker injury or illness per industry group in Florida.
Summary
This study provided an opportunity to investigate nonfatal injury and illness claims for crop production subsector workers in Florida between 2010 and 2019. The data provided a total of 8,351 individual claims. The three industry groups with the highest number of injuries and illnesses claimed through Workers’ Compensation during the study period were: greenhouse, nursery, and floriculture; vegetable and melon farming; and fruit and tree nut farming. Over the 10 years, the nonfatal injury claim rate in crop production remained relatively constant, with the highest rate in 2016. The lowest claim rates were observed in 2010 and 2019.
Injuries occurred mostly in the winter and spring months, when vegetable and citrus harvesting demands are higher. The most common causes were falls, slips, trips, or strains from various work-related tasks. Farmworkers mostly injured their upper and lower extremities. Thus, occupational safety programs should focus on fall prevention measures and proper workplace ergonomics. Geographically, injury and illness claims were mainly made in central and southern Florida.
Although Workers’ Compensation data can clarify the specifics of injuries and illnesses, the demographics and the narrative description of cases were not provided in the data sets, making it harder to build specific intervention programs. Understanding the occurrence of these injuries among crop production workers is critical for implementing effective prevention programs. Extension agents can use these results to choose priority topics and timing for farm safety education.
Findings from this study revealed that most reported claims in Florida occurred during winter and spring months. Thus, conducting safety education/training in the fall and early winter months prior to busier harvesting seasons may be the most beneficial to the greatest number of workers. However, we recommend conducting these safety trainings whenever they are necessary.
Acknowledgments
We express our gratitude to Dr. Glenn Israel for his helpful comments on an earlier draft of this publication, along with the entire SCCAHS Evaluation Team and the UF College of Liberal Arts and Sciences, Active Learning Program for their partnership and support in conducting this study.
References
BLS. 2021a. “Industries at a Glance, Crop Production.” Accessed October 5, 2021. https://www.bls.gov/iag/tgs/iag111.htm
BLS. 2021b. “Nonfatal Cases Involving Days away from Work: Selected Characteristics (2011 forward) (Years: 2011–2019).” Washington, D.C.: Survey of Occupational Injuries and Illnesses, US Department of Labor. Accessed July 26, 2021. https://data.bls.gov/PDQWeb/cs
BLS. 2021c. “Quarterly Census of Employment and Wages, US Department of Labor.” Accessed July 28, 2021. https://www.bls.gov/cew/data.htm
US Census. 2021. “North American Industry Classification System: Crop Production 2017 Definition.” Accessed October 5, 2021. https://www.census.gov/naics/?input=111&year=2017&details=111
USDA. 2021. “A Look at Agricultural Productivity Growth in the United States, 1948–2017.” Accessed January 27, 2022. https://www.usda.gov/media/blog/2020/03/05/look-agricultural-productivity-growth-united-states-1948-2017