Introduction
In agriculture, the downward movement of water-soluble plant nutrients below the crop root zone with percolating water is referred to as leaching (Figure 1). Nitrogen is one of the most prominently leached nutrients in the soil and is considered one of the major contributors to groundwater contamination and degradation of water bodies globally, including in the humid regions of Florida. Nitrogen in the soil is predominantly added as nitrogenous fertilizers which can be grouped as nitrate nitrogen (NO3-N) (e.g., calcium nitrate), a combination of ammonium and nitrate (e.g., ammonium nitrate), and amide (urea). Thus, nitrogen leaching is mostly induced by the addition of organic and/or inorganic N fertilizers beyond the need of plants and facilitated by the availability of excess water and poor soil management practices. The addition of organic/inorganic N fertilizers coupled with the processes of mineralization (conversion of organic nitrogen to mineral forms [nitrate, nitrite, and ammonium ions] of N), nitrification (conversion of ammonium ion to NO3-N), and the hydrolysis of inorganic fertilizers result in the formation of highly mobile NO3-N, which is prone to leaching through the soil profile. Although N leaching could occur in any type of soil, sandy soils are the most prone to N leaching. This is due to the low organic matter content, high infiltration rates, and low ability to retain nutrients caused by low cation exchange capacity in sandy soils compared to soils with a higher percentage of clay and silt particles. Organic matter increases sorption capacity of the soil, thereby increasing water and nutrient holding capacity. Clay soils, on the other hand, have smaller particle size and larger surface area that increases the number of micropores and adhesion area for the water and nutrients.
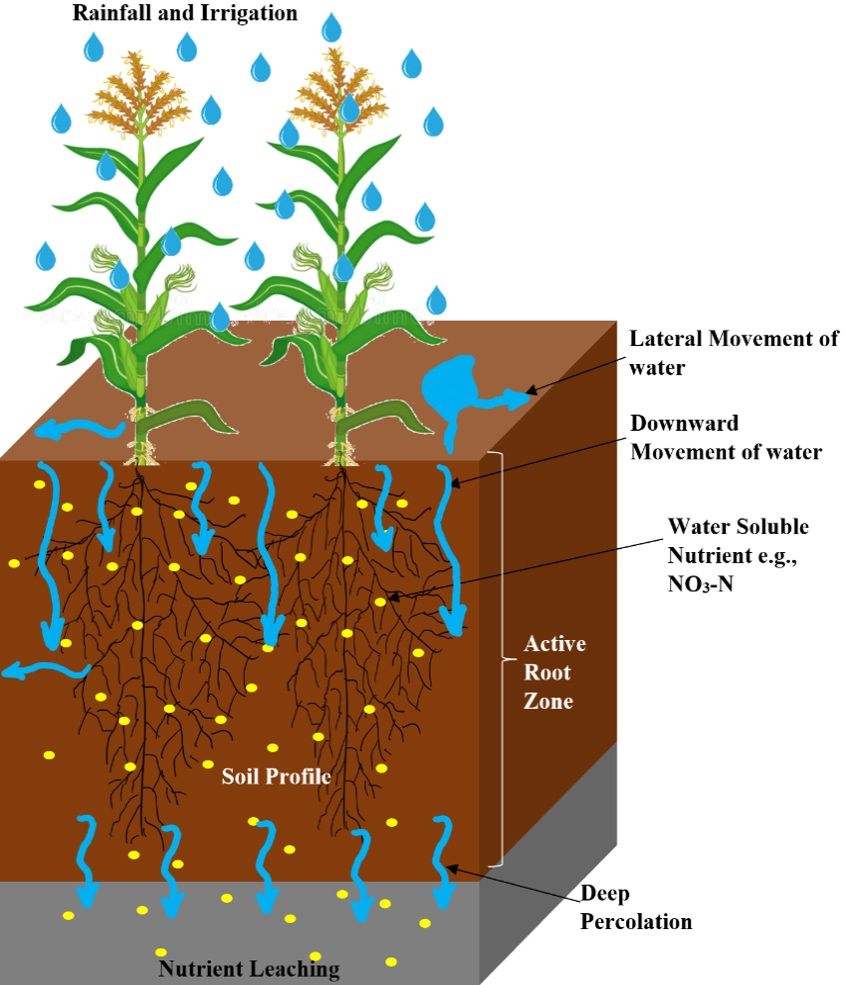
Credit: Dr. Vivek Sharma, UF/IFAS
Globally, nitrogen leaching has resulted in the contamination of surface (springs, rivers, lakes, oceans) as well as underground water bodies (aquifers). A prime example of such NO3-N concerns is the Mississippi River Basin that drains into the Gulf of Mexico. In north Florida, the intense rainfall and intensive agricultural practices over deep sandy soils with the hydraulically connected karstic Upper Floridan Aquifer (UFA) make NO3-N leaching a major source of water quality degradation. Additionally, NO3-N contamination has been detected in springs within the Suwannee River Basin (SRB) (FDEP 2018). Due to this and the interminable need of nitrogen fertilizer application to supply food for the growing human population, it is critical to quantify the NO3-N leaching from agricultural systems and determine its impact on groundwater quality.
This publication summarizes the basic concepts of three most-used NO3-N leaching quantification methods in field conditions. The information in this document could be of interest to students, research scientists, Extension agents, growers, and state agency personnel.
Methods to Quantify Nitrate Leaching
Under field conditions, quantifying NO3-N losses is complex and challenging because it is driven by site-specific parameters such as soil type, rainfall, irrigation, soil water content, soil temperature, root presence, nitrogen source, application rates, and crop nitrogen uptake capacity, among others. Over the years, different direct and indirect methods have been employed to measure NO3-N leaching (Webster et al. 1993; Prasad and Hochmuth 2016). In general, accurate measurement of NO3-N leachate requires the knowledge of soil solution flux (leachate) through soil profile below the root zone and precise quantification of NO3-N concentration. The following section summarizes the basic concepts of the three most commonly used NO3-N leaching quantification methods in field conditions, which include soil sampling, suction cup lysimeter, and drainage lysimeter.
Soil Sampling
One of the widely accepted methods to quantify NO3-N leaching in unsaturated soils is by direct soil sampling below the root zone. This method is simple, relatively inexpensive, and applicable to all soils. However, it is also time-consuming and destructive; it only provides a distribution of NO3-N concentration within the soil solution in the profile, but no information on soil solution flux. In these cases, the measured soil NO3-N values are generally combined with physically-based models that estimate soil water balance components to quantify the NO3-N leaching below the soil surface (Zotarelli et al. 2007).
For the accurate quantification of NO3-N level, it is important to collect representative soil samples from the uniform field at different soil depths (including below the crop root zone) during different crop growing seasons, depending on the fertilizer application plan and the events of precipitation and irrigation. In general, a uniform field should be sampled 5–10 times spatially in a random pattern to accommodate variability. Fields with significant differences in soil type, slopes, management practices, and other soil properties that may influence soil nutrient levels have to be sampled separately. For banded fertilization, a systematic soil sampling (in which samples are collected from both within and between the bands) needs to be employed to minimize the effect of differences in nutrient concentration level. The number of soil samples that need to be collected between bands and within a band depends on the band spacing.
A stainless-steel soil sampling probe, soil auger, post-hole digger, hydraulic soil probe, or Geoprobe can be used to collect the soil samples. The preferred tools may vary based on the depth of the sampling point and the intended level of sampling precision. For example, hand or power augers are especially useful when sampling at different depths or a specific sampling point (Figure 2). However, a Geoprobe soil sampler could be preferable to an auger for continuous deep core samplings up to 25 feet in depth using direct push technology. Geoprobe uses a cased center probe rod for core extraction, thereby restricting cross-contamination of soil (Figure 3). To ensure a quality soil sample and to minimize sample contamination, it is important to use clean sampling equipment, to clean the probe after each sampling depth, and to use different plastic buckets for soil sample collection and sample mixing at different depths (Figure 2). Do not leave the soil samples moist and warm to avoid overestimation of soil nitrate due to mineralization. Moist soil samples must be air-dried at room temperature instead of oven-dried. Additionally, soil samples can also be frozen for shipping (US EPA 2007). Furthermore, it is advisable to start cooling the soil samples in the field itself, using any insulated container to minimize the conversion of soil nitrate. Soils are extracted fresh, or left to dry and then extracted. Avoid sampling extremely wet soil.
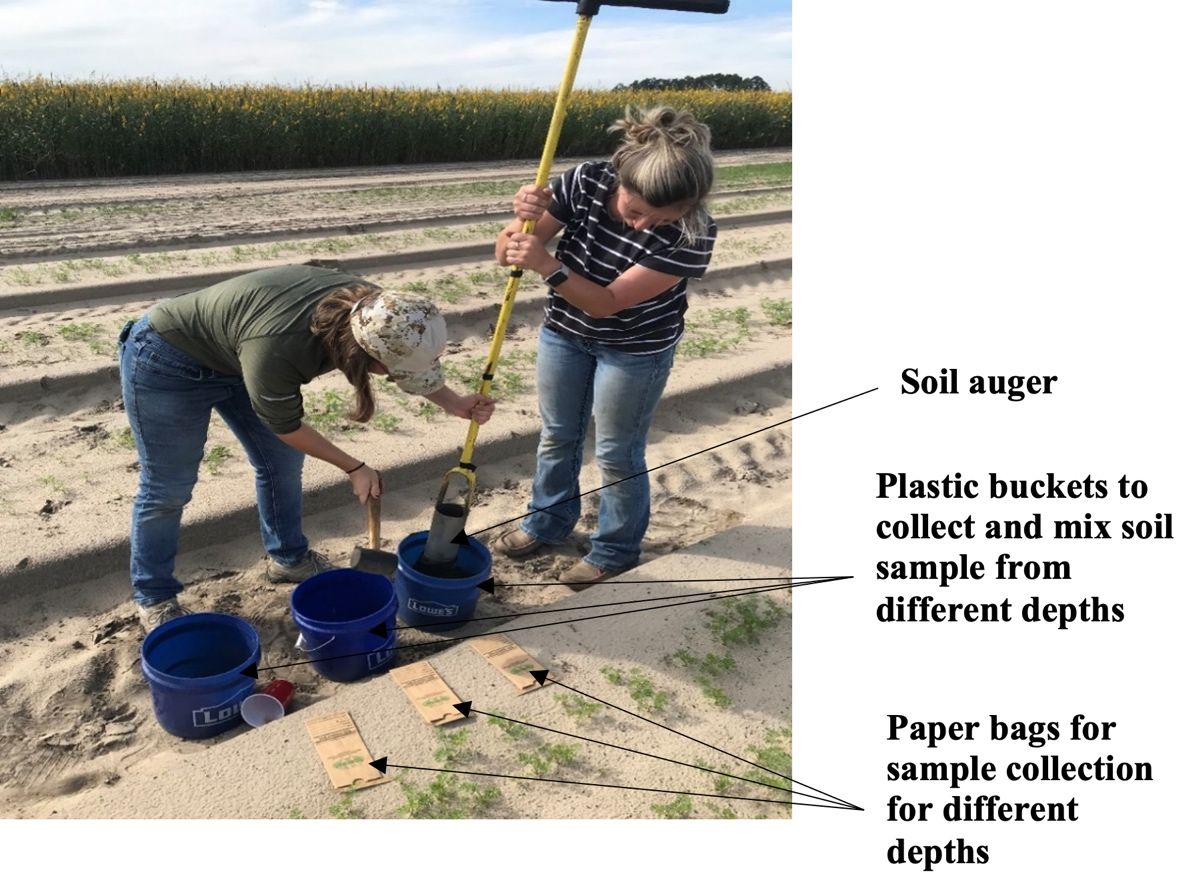
Credit: Dr. Vivek Sharma, UF/IFAS
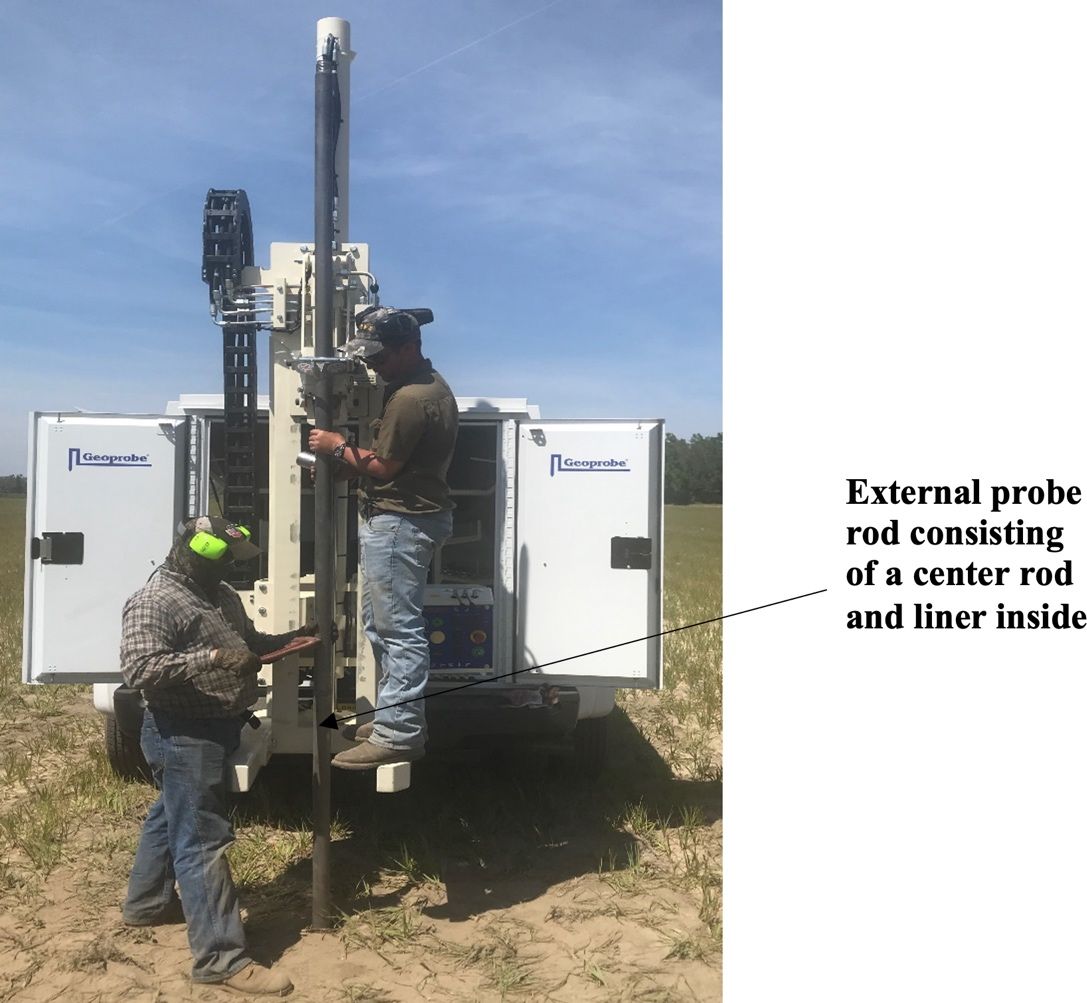
Credit: Dr. Sudeep S. Sidhu, UF/IFAS
Suction Cup Lysimeters
The suction cup lysimeter, also known as the tension lysimeter, is one of the most frequently used tools to collect soil solution beyond the crop rooting depth. It is inexpensive, easy to install at different soil depths without a trench and allows repeated measurements from the same location. A suction cup lysimeter can help estimate NO3-N concentration from a soil solution extracted around the crop root zone but is unable to measure deep drainage and soil solution flux. The soil solution flux here represents continuous in-flow and out-flow of water from the soil profile. In general, suction cup lysimeters work by creating a negative pressure (approximately -0.5 atm) inside the hollow polyvinyl chloride (PVC) pipe as compared to the soil solution tension outside of the pipe. This creates a pressure gradient, resulting in a flow of soil solution through the porous ceramic cup into the PVC pipe.
Components
The suction cup lysimeter consists of a porous ceramic cup connected to an end of a hollow PVC pipe for soil solution extraction (Figure 4). The other end of the PVC pipe is sealed with a rubber cap. The rubber cap has two tubes inserted through it. One of the tubes extends to the ceramic cup and is designed for soil solution discharge. The other tube is relatively short and is installed to create a vacuum for easy extraction of soil solution. Clamps are used on each tube to open or close the tubes as needed. The porous ceramic cup composition is specialized to not react with any soil solutes.
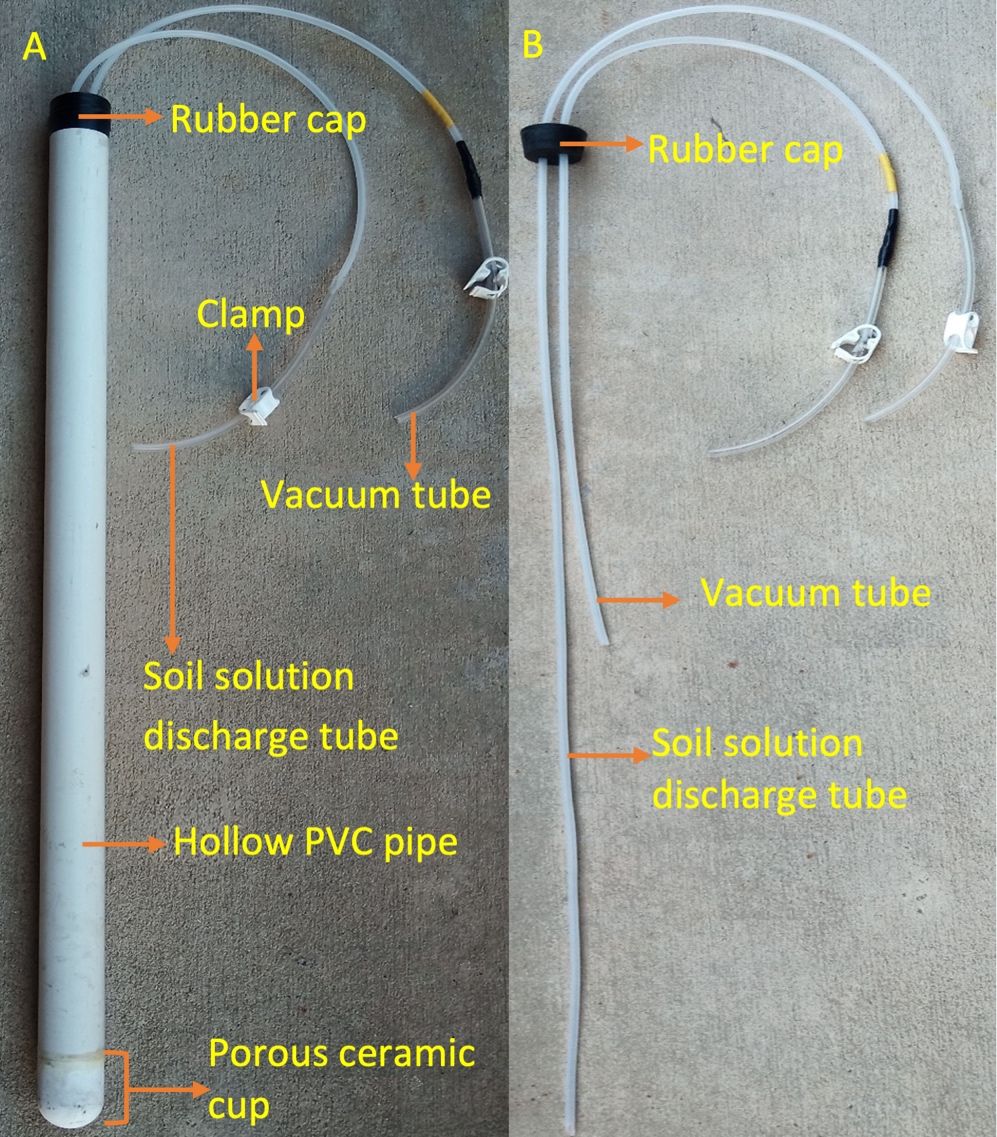
Credit: Bibek Acharya and Dr. Vivek Sharma, UF/IFAS
Installation and Sample Collection
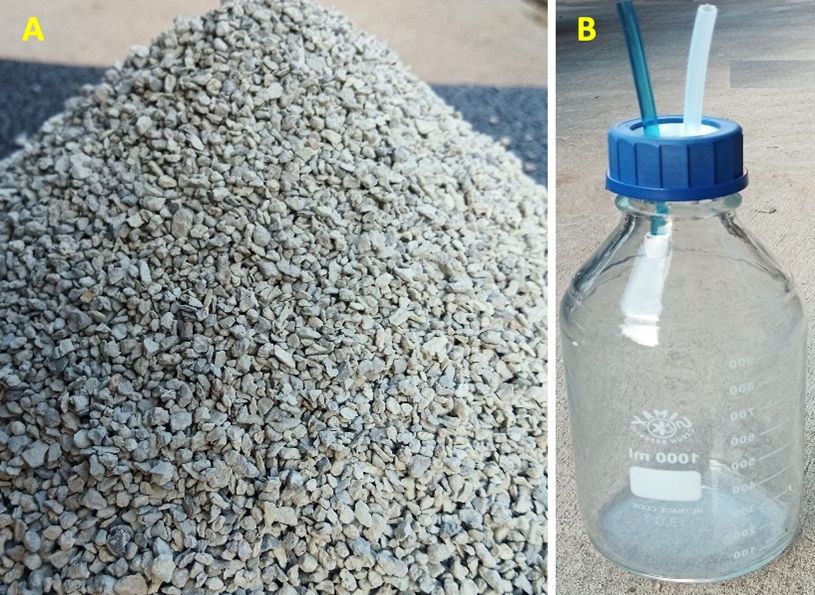
The suction cup lysimeter must be installed below the root zone to sample the soil solution leached. The PVC pipe should be extended a few centimeters above the soil surface at the rubber cap end. A soil auger can be used to dig through the soil profile to reach the desired depth depending on the crop under consideration. The pit dug is then filled with couple of inches of native soil slurry over which the suction lysimeter is placed. The use of soil slurry underneath allows proper installation and hydraulic contact between the porous cup and the soil. Likewise, bentonite (Figure 5) and soil slurry are used to provide a proper sealant around and at the top end (soil surface) of the lysimeter. The use of sealant prevents the downward preferential flow of soil solution along the PVC pipe wall into the ceramic cup.
Credit: Bibek Acharya and Dr. Vivek Sharma, UF/IFAS
After installation, a vacuum will be created inside the PVC pipe using the vacuum tube and a vacuum pump. Next, the soil solution discharge tube must be closed with a clamp. After that, the vacuum tube has to be closed to create an airtight seal after creating a negative pressure inside the PVC pipe.
During sample collection, the soil solution must be extracted by opening the discharge tube and applying positive pressure through the vacuum line. This causes the water sample collected in the PVC pipe to rise and discharge into the sampling bottle. Remember to create a vacuum inside the PVC pipe and to close both the discharge tube and vacuum tube once soil-water sampling is done. The total leachate volume collected is measured. Leachate samples are then poured into polyethylene scintillation vials (~20 ml), placed in an insulated container, and shipped to the laboratory for analysis.
Drainage Lysimeter
A drainage lysimeter, also referred to as a passive wick lysimeter, helps in the long-term monitoring of vertical soil water and chemical flux. In contrast to soil sampling and suction cup lysimeters, drainage lysimeters capture the entire leachate volume, which can be further used to quantify NO3-N concentration and calculate nitrogen load passing below a specific soil depth and nutrient balance. Drainage lysimeters can be designed in many different ways and customized as needed. For example, EDIS publication AE554 (Radovanovic et al. 2021) provides a detailed description of the design, construction, and installation of a custom drainage lysimeter for use in well-drained sandy soils for turfgrass. This publication discusses the basic principle, components, and installation procedure of commercially available METER drainage G3 lysimeters (Decagon Devices, Inc. 2018).
Components
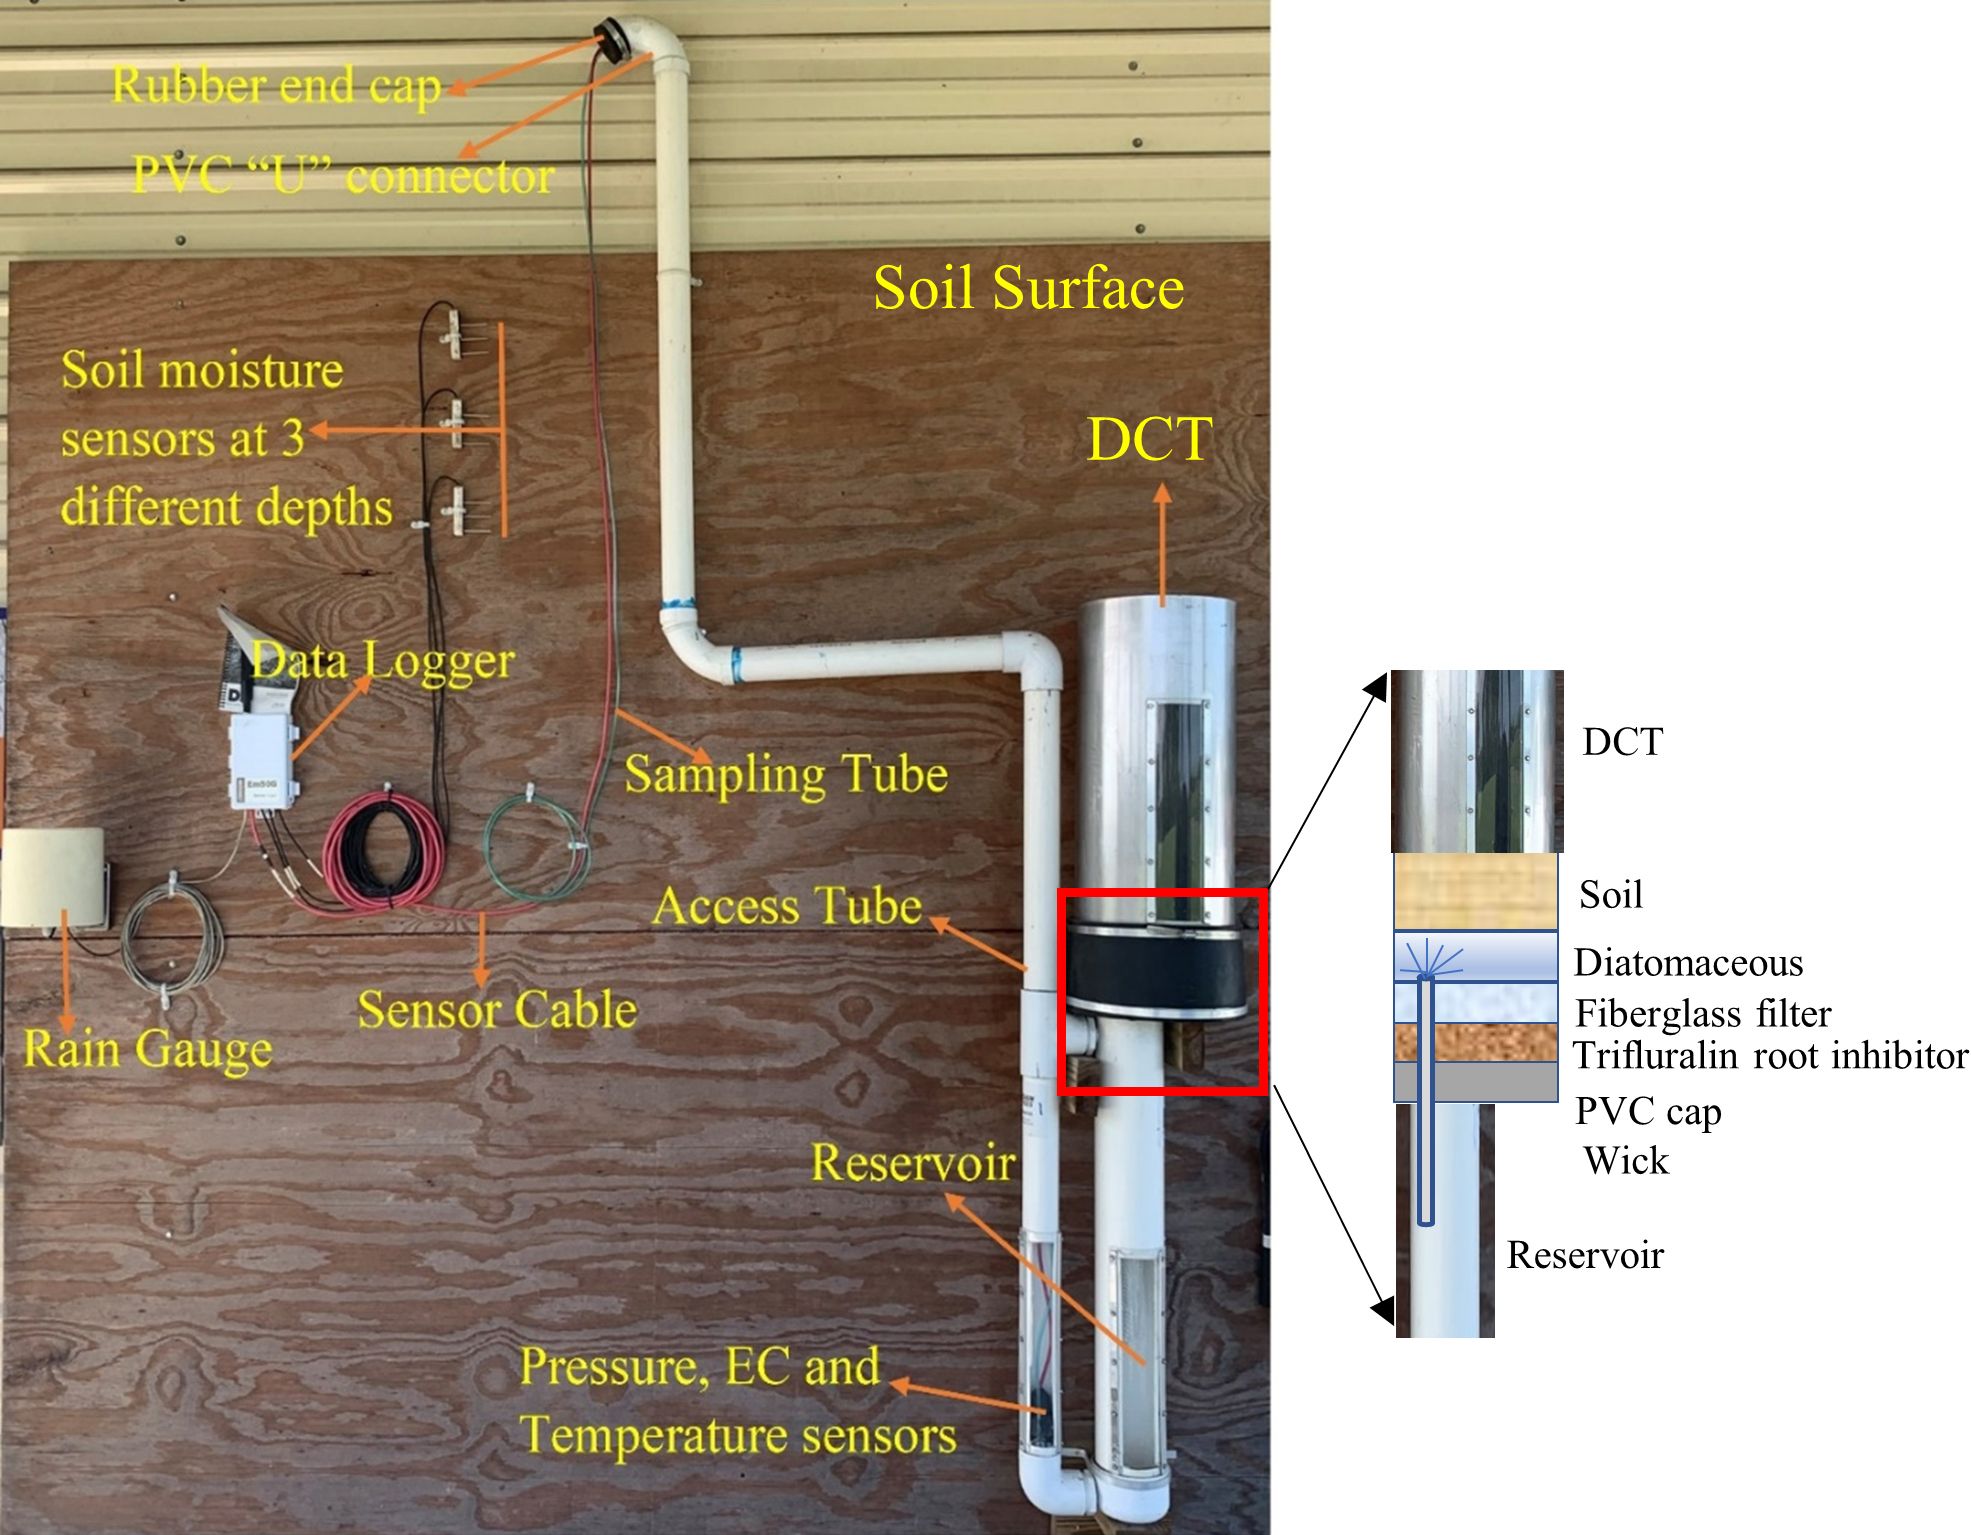
Figure 6 presents the different components of drainage G3 lysimeters, which consist of six main units: Divergence Control Tube (DCT); wick assembly; reservoir; access tube; drainage gauge sensor unit; and sampling tube and sampling cable.
Credit: Bibek Acharya, Dr. Charles Barrett, Dr. Vivek Sharma, and Anthony Crain, UF/IFAS
- Divergence Control Tube (DCT): The DCT is a 25-inch-long tube made up of stainless steel or a PVC material and is located at the top of the drainage lysimeter (Figure 6). It contains an undisturbed soil core and helps maintain a vertical flow above the reservoir. During the assembly of a drainage lysimeter, the DCT is inserted inside a rubber union sleeve that helps to hold the union of the DCT and the wick section firmly. The inner diameter of the DCT is 10 inches, which accounts for 78.5 square-inches of cross-sectional surface area. Along with the fiberglass wick, the DCT helps to minimize the flux divergence and convergence (discussed below in the drainage lysimeter principle section).
- Wick assembly: The union of the DCT and the reservoir contains the fiberglass wick assembly. Figure 6 shows the cut-out section of the fiberglass wick assembly. It contains diatomaceous earth, a fiberglass filter, trifluralin root inhibitor, and a wick. Its function is to exert tension on the water at the bottom of the soil profile so that the water flows into the lysimeter and a representative sample is intercepted. A layer of diatomaceous earth is placed at the union of the DCT and the wick to ensure hydraulic conductivity. The diatomaceous earth also prevents silting up of the reservoir by filtering out the fine particles. During assembly of the drainage lysimeter, the soil column in the bottom of the DCT should sit firmly on the diatomaceous earth. In addition, a patch of bio-barrier root inhibitor is placed in the wick assembly to prevent roots from penetrating the drainage gauge wick section.
- Reservoir: The reservoir is 32 inches long and 4.5 inches in diameter (outside). It is a tube which accumulates the drained water. The collection capacity of the reservoir is approximately 2.2 gallons. Empty the reservoir periodically before the water level in the reservoir rises to the wick. If the water level comes in contact with the wick, water might get drawn out of the reservoir by capillary forces, resulting in underestimation of drainage. A dead volume of 135 ml is created in the reservoir as the sampling tube is placed slightly above the bottom of the reservoir. The dead volume should be filled before any reading is taken.
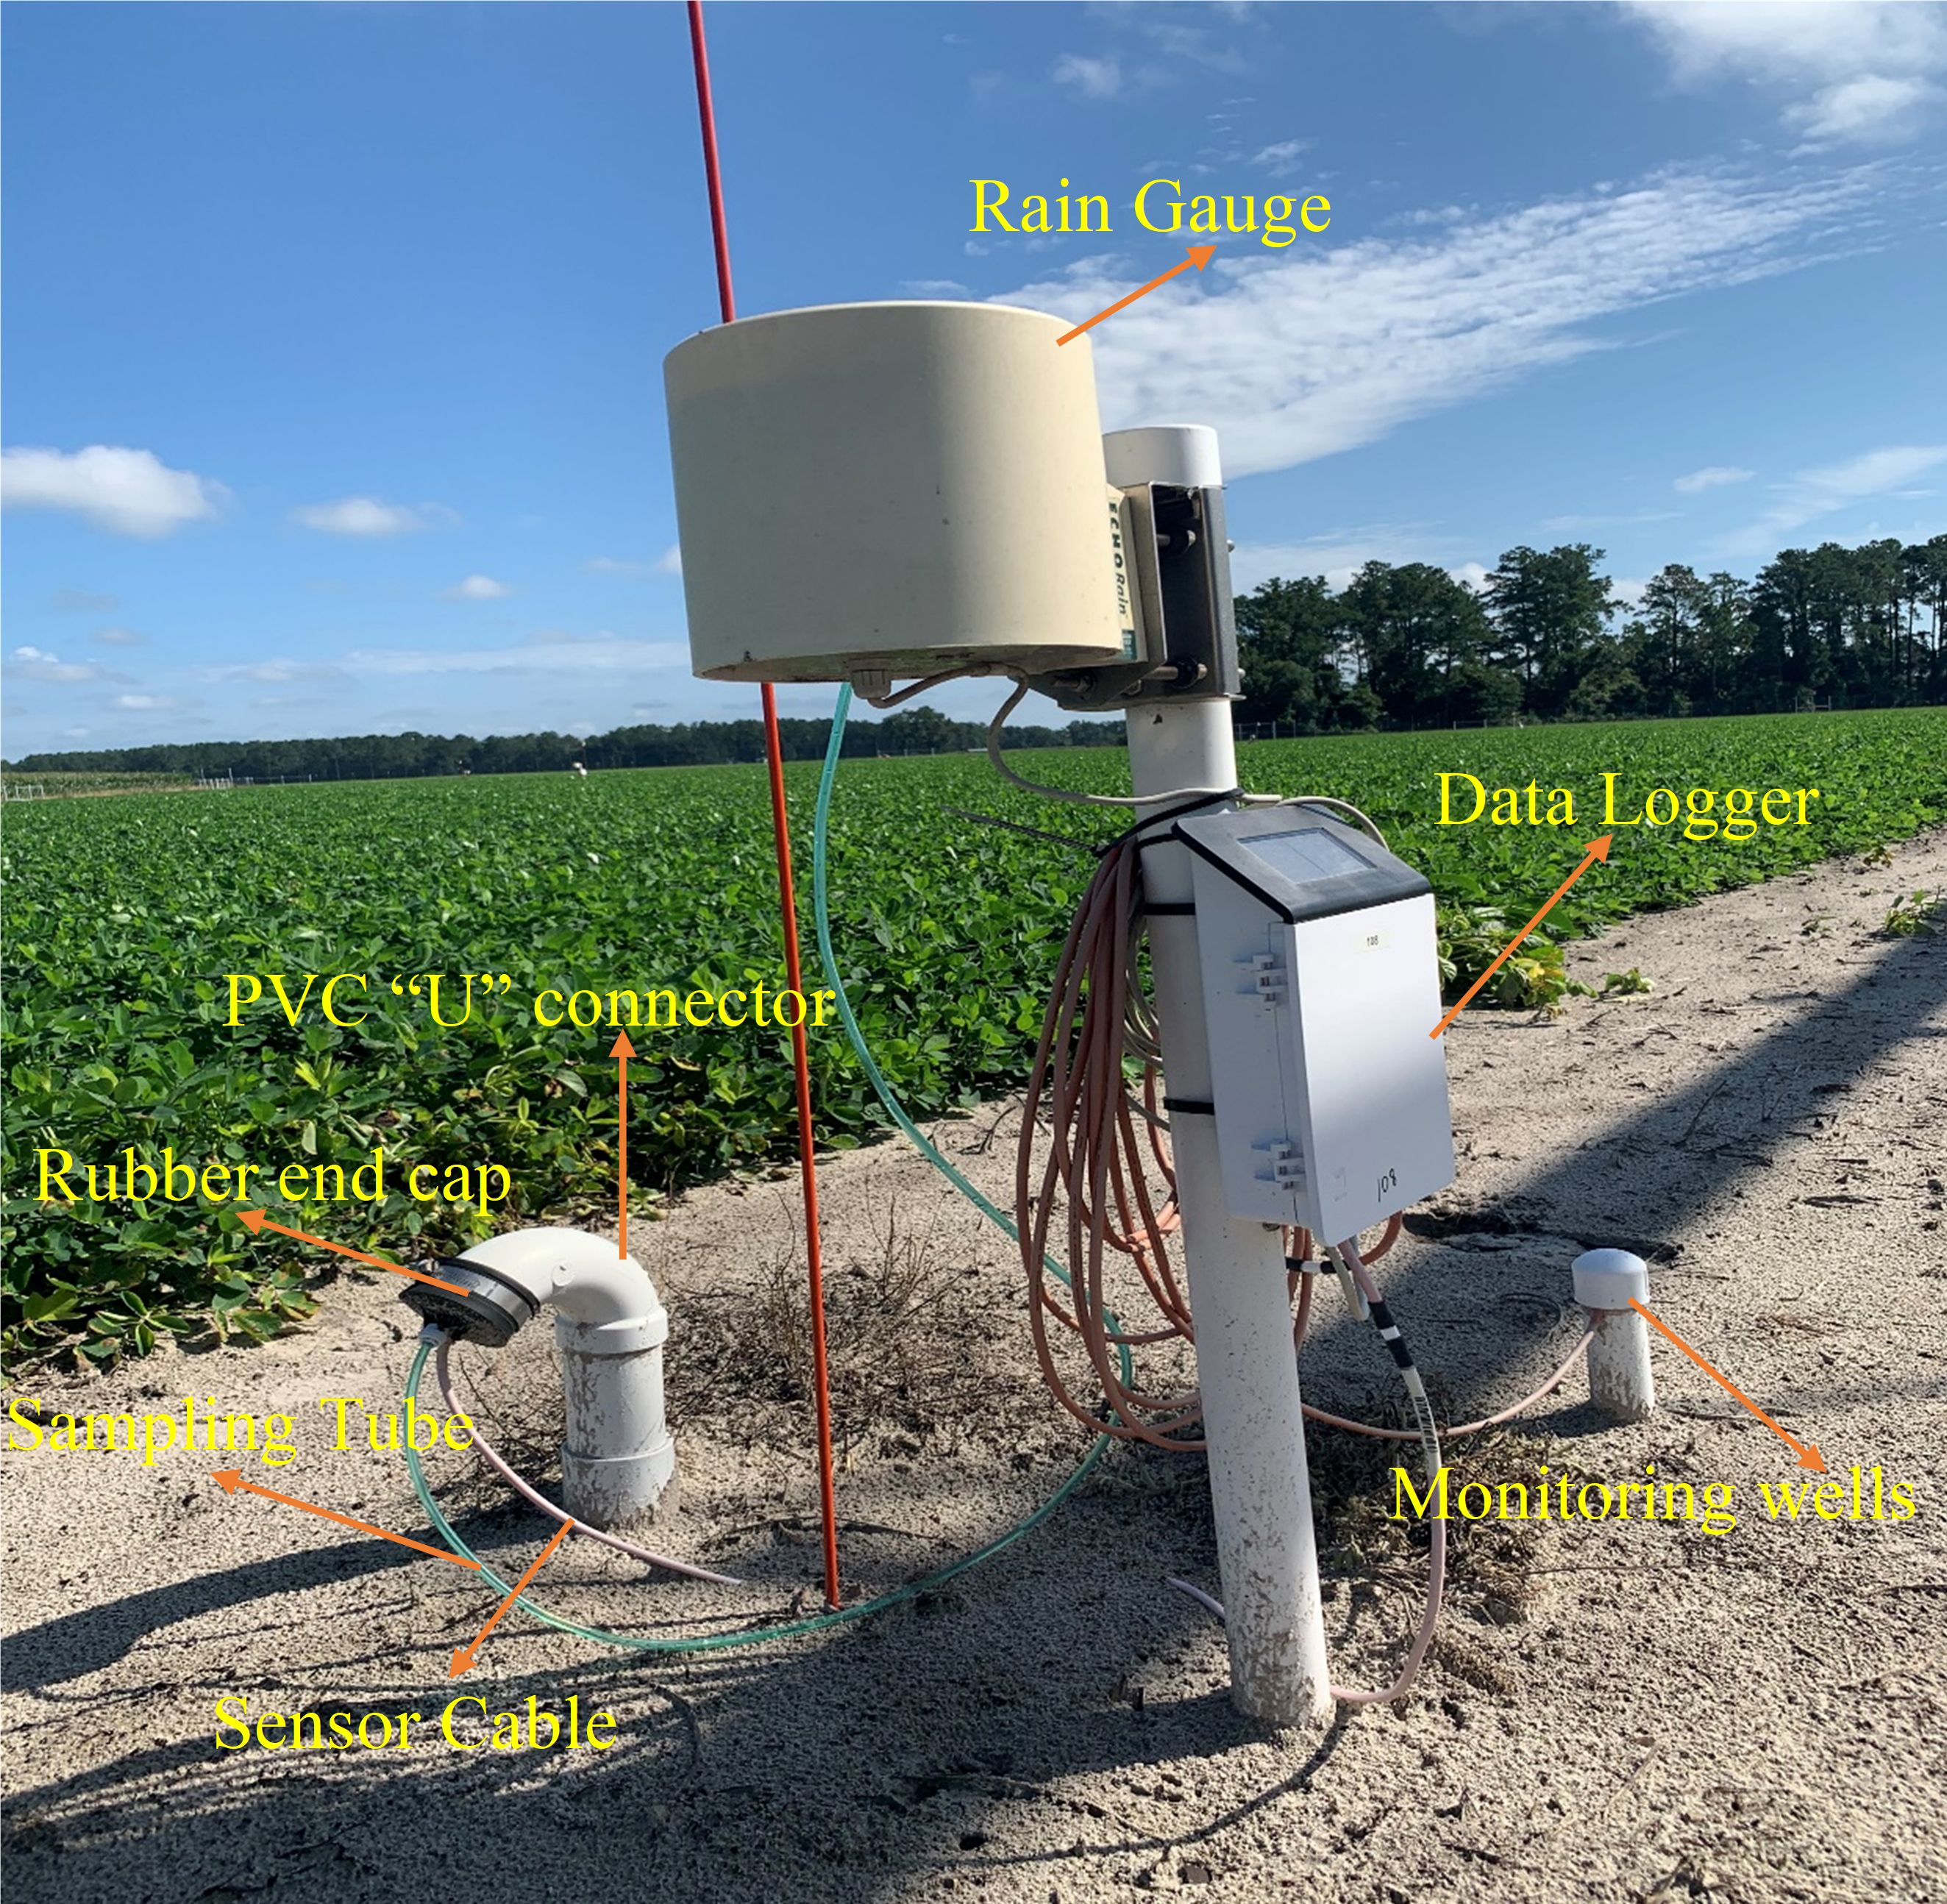
- Access tube: The reservoir is connected to the standard long access tube (outside diameter of 2.4 inches), which is customized depending on the depth of drainage lysimeter installation. The top of the access tube (2–3 feet) protrudes above the ground surface, where a PVC “U” connector is attached to it. The other end of the “U” connector is sealed with a rubber end cap and a hose clamp. The access tubes can be elongated as desired and brought into the alleyway of the field for water sampling simplicity.
- Drainage gauge sensor unit: Drainage lysimeters are equipped with a differential pressure transducer that measures the pressure applied by the water column above it. The sensor is located at the bottom of the access tube and uses the cross-sectional surface area of the reservoir and the relationship between pressure and water depth to compute the accumulated drainage. The sensor is vented to atmospheric pressure at its reference port through a cable. Porous Teflon (which allows air to pass) at the end of the cable prevents water from entering the sensor. In addition, the electrical conductivity (EC) and temperature sensor unit are also added to the bottom of the access tube.
- Sampling tube and sampling cable: The sampling tube is polyethylene with a standard (can be customizable) dimension of 0.5 inch (outside diameter) × 0.3 inch (inner diameter). The sampling tube is connected to the notch situated on the side of the pressure transducer sensor. The sampling tube should not extend beyond the pressure sensor opening of the pressure transducer sensor; it should be situated slightly above the floor of the access tube and the reservoir. The sampling tube and the sampling cable come out of the access tube and the 'U' connector and finally through the pre-cut slit of the rubber end cap (Figures 6 and 7). The sensor cable and the sampling cable can be zip-tied together to keep them secure. Water is drawn out of the reservoir using the sampling tubes by creating a vacuum inside the sampling bottle.
Credit: Bibek Acharya and Dr. Vivek Sharma, UF/IFAS
Although not required, it is advisable to install soil moisture sensors, and a rain gauge with the drain gauge apparatus to quantify soil moisture dynamics and the amount of rainfall. Usually, rainfall amount triggers the sampling of the drain gauge. In addition, it is recommended to install a monitoring well to monitor groundwater levels and its hydraulic properties and to obtain groundwater samples for nutrient analysis (Figure 6).
Principle
Drainage water through the soil enters the DCT of the drainage lysimeter and then goes to the fiberglass wick and is finally collected in the reservoir. Water enters the lysimeter when the soil suction at the top of the DCT is equal to or greater than the suction of the surrounding soil. The fiberglass wick forms a continuous column of water allowing continuous suction at the intake. The suction at the intake of the drainage lysimeter fluctuates with the surrounding soil to allow water to flow. In general, the suction at the top of the DCT is approximately 11 kPa (20-inch wick plus 24 inches of soil column in the DCT).Water preferentially flows around the lysimeter when suction at the top of the DCT is between 11 kPa and 33 kPa. This is referred to as flux divergence. On the other hand, if the soil suction at the top of the DCT is less than 11 kPa, water preferentially flows into the drainage lysimeter, which is referred to as flux convergence.
Installation
Similar to the suction cup lysimeter, the drainage lysimeter is installed below the root zone to sample the soil solution leached through the crop root zone. For proper installation, it is important to select the appropriate site that is representative of the whole field. It is also advisable to install the drainage lysimeter with minimal disturbance to the soil monolith so that vegetation and natural conditions get reestablished above the lysimeter. The intact soil monolith in the DCT is required for the proper installation of the drainage lysimeter. It is advisable to use two nearby sites with similar soil properties: one for the lysimeter installation and the other for collection of the intact soil monolith in the DCT. To collect the soil monolith in the DCT, evacuate the soil to a level determined for the top of the DCT and insert the DCT using heavy equipment or a sledgehammer. Do not damage the top edge of the DCT. In general, 4-inch × 4-inch wood boards are used on the top edge of the DCT to avoid directly pounding or damaging the DCT.
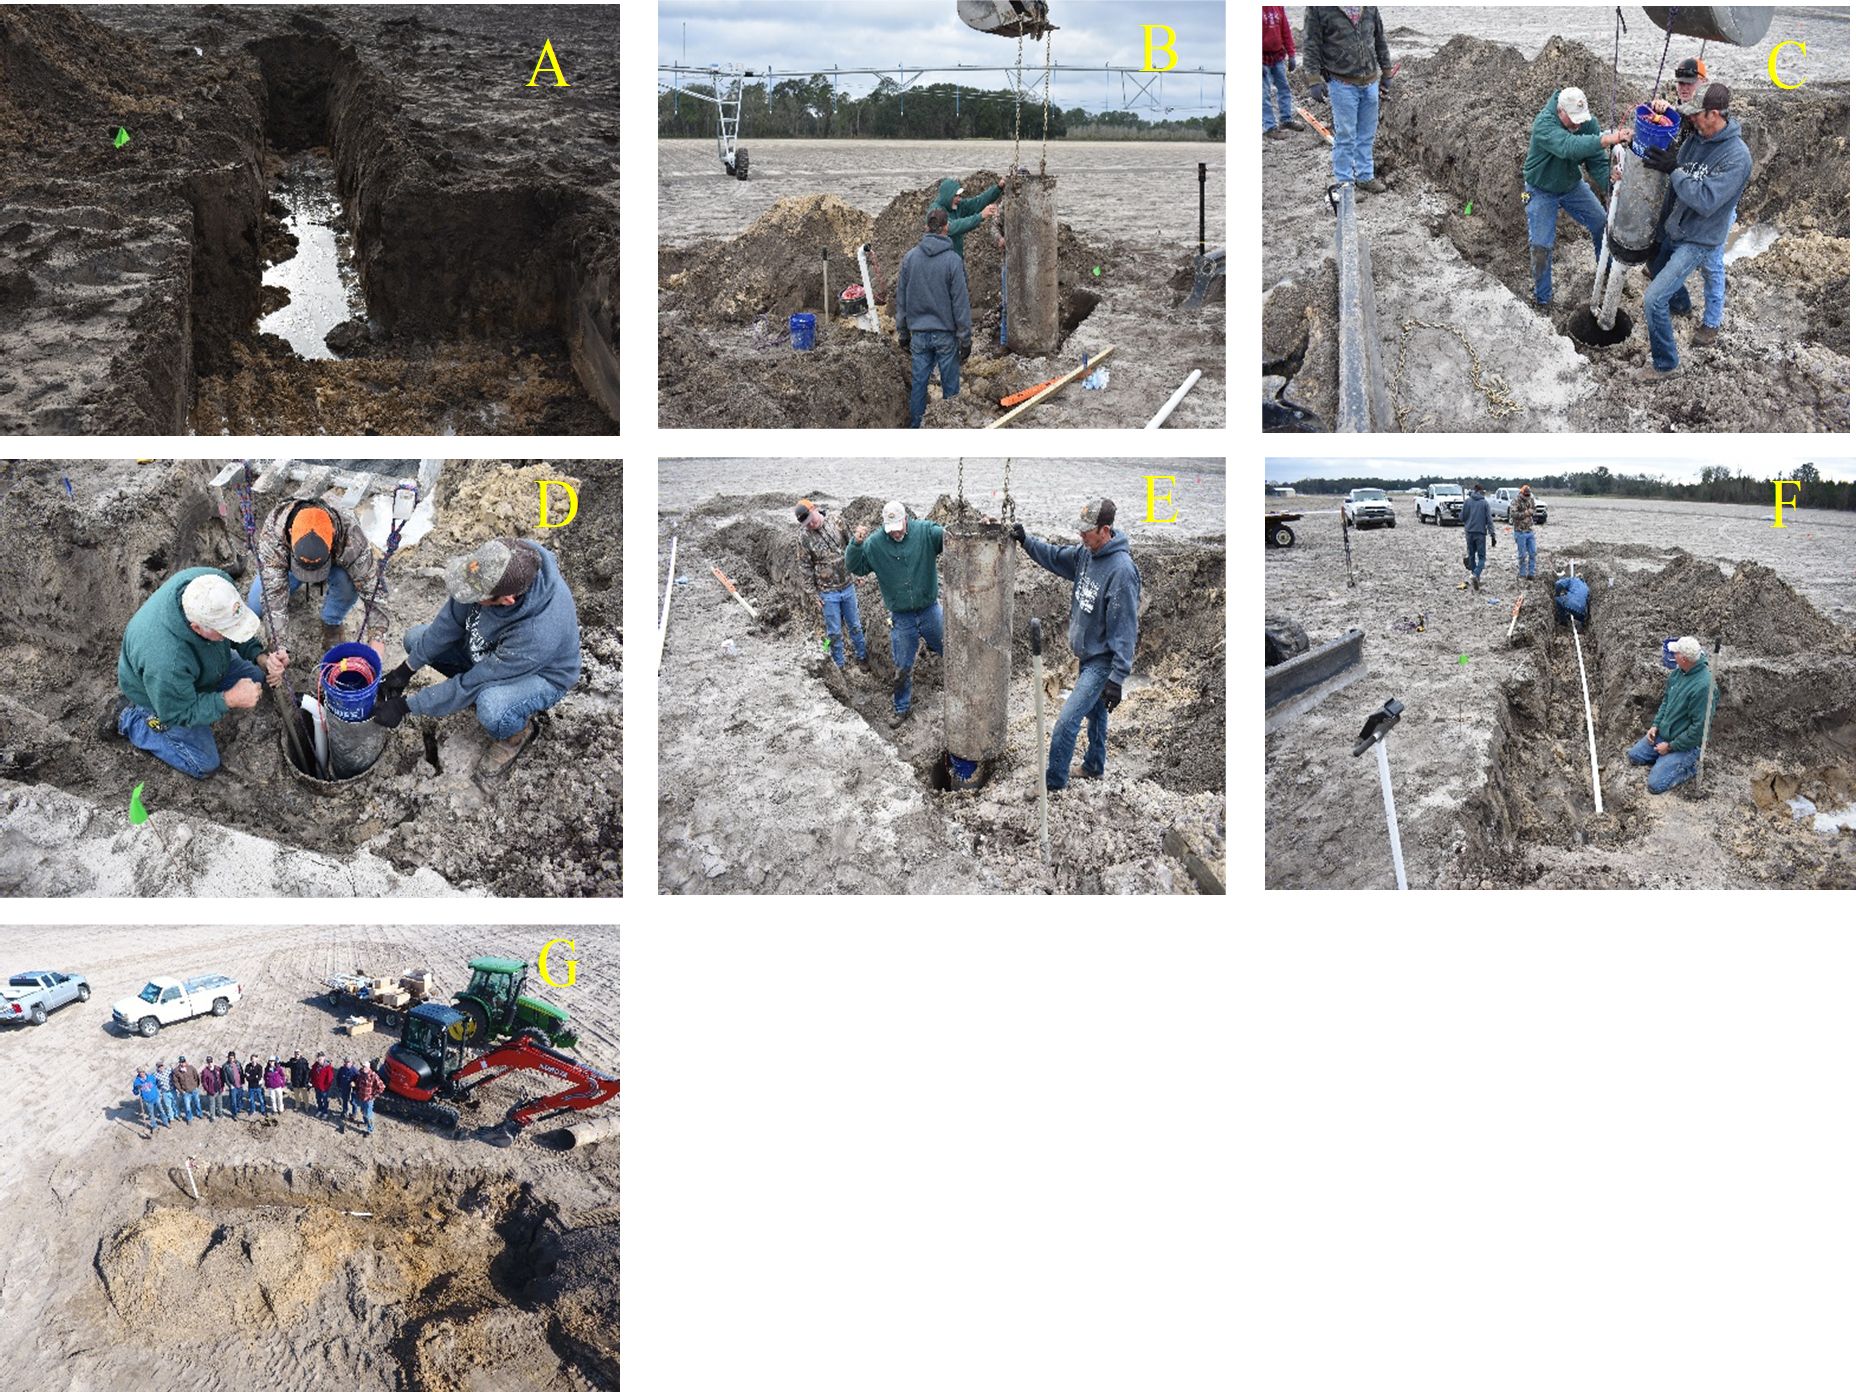
The installation depth of the drainage lysimeter depends on the depth of the crop root zone. The union between the DCT and wick section needs to be placed below the root zone. This is to ensure that the drainage lysimeter only intercepts percolated water and not the water that could be used for transpiration. If captured, the transpiration water can lead to the overestimation of drainage. Moreover, the installation of a drainage lysimeter (union between the DCT and wick) in the root zone can lead to roots growing down to the DCT, wick, and reservoir. Root growth can limit water flow and pull out water samples from the reservoir. This scenario causes an underestimation of drainage. A rooting inhibitor trifluralin fabric is patched in the wick section to prevent the roots from penetrating the drainage lysimeter. This is particularly important if the drainage lysimeter is installed in the root zone of deep-rooted perennial crops. For annual crops, it is practical to estimate a root zone depth (around 3 feet), which helps to install a drainage lysimeter (union of DCT and wick) below the root zone. Figure 8 contains the step-by-step installation procedure for the drainage lysimeter.
Credit: Dr. Charles Barrett, UF/IFAS
Installing the drainage lysimeter might be more cumbersome in sandy soils with a relatively higher water table in Florida. Our experience involved using a steel pipe to keep the soil from caving in due to the high water table. For that, a hole was augured, and a steel pipe was pushed inside it. The hole was augured again to install the drainage lysimeter. Finally, the steel pipe was removed, leaving the installed drainage lysimeter in the hole. The drainage lysimeter should be lowered carefully into the hole with help of multiple people. A sudden drop can lead to permanent damage.
It is also recommended to prime the drain gauge by adding water and removing all possible water through the sampling tube. This helps in filling up the dead volume and makes the lysimeter ready for future measurements.
Summary
The aforementioned methods to quantify nitrate leaching have their advantages and disadvantages depending on their intended use, cost, and the quality of data they produce. Soil sampling provides a spatial distribution of soil NO3-N that is prone to leach. On the other hand, suction cup lysimeters and drainage lysimeters provide leachate concentration in soil solution. Water sampling in lysimeters is generally performed after major infiltration events such as rainfall, irrigation, and snow melt. Regardless of the method employed, determining the sampling events is a critical part of quantification. For example, sampling events too far apart may not provide good information on soil solution flux. Likewise, a leaching event can occur in between and may not be captured in the sampling. Additionally, low data quality can decrease representativeness and reliability of measured soil NO3-N on higher spatial resolution. Table 1 summarizes the advantages and disadvantages of these three commonly used methods to quantify nitrate leaching.
Table 1. Summary of advantages and disadvantages of each method to quantify nitrate leaching.
References
FDEP. 2018. “Final Integrated Water Quality Assessment of Florida: 2018 Sections 303 (d), 305 (b), and 314 Report and Listing Update.” Tallahassee, FL.
Hanson, J. D., L. R. Ahuja, M. D. Shaffer, K. W. Rojas, D. G. DeCoursey, H. Farahani, and K. Johnson. 1998. “RZWQM: Simulating the Effects of Management on Water Quality and Crop Production.” Agricultural Systems 57:161–195. https://doi.org/10.1016/S0308-521X(98)00002-X
Hoogenboom, G., C. H. Porter, K. J. Boote, V. Shelia, P. W. Wilkens, U. Singh, J. W. White, S. Asseng, J. I. Lizaso, L. P. Moreno, W. Pavan, R. Ogoshi, L. A. Hunt, G. Y. Tsuji, and J. W. Jones. 2019. “The DSSAT Crop Modeling Ecosystem.” In Advances in Crop Modeling for a Sustainable Agriculture, edited by K. J. Boote. 173–216. Cambridge, UK: Burleigh Dodds Science Publishing. http://dx.doi.org/10.19103/AS.2019.0061.10
Jones, J. W., G. Hoogenboom, C. H. Porter, K. J. Boote, W. D. Batchelor, L. A. Hunt, P. W. Wilkens, U. Singh, A. J. Gijsman, and J. T. Ritchie. 2003. “The DSSAT Cropping System Model.” Eur. J. Agron. 18:235–265. https://doi.org/10.1016/S1161-0301(02)00107-7
Keating, B. A., P. S. Carberry, G. L. Hammer, M. E. Probert, M. J. Robertson, D. Holzworth, N. I. Huth, J. N. G. Hargreaves, H. Meinke, Z. Hochman, G. McLean, K. Verburg, V. Snow, J. P. Dimes, M. Silburn, E. Wang, S. Brown, K. L. Bristow, S. Asseng, S. Chapman, R. L. McCown, D. M. Freebairn, and C. J. Smith. 2003. “An Overview of APSIM, a Model Designed for Farming Systems Simulation.” Eur. J. Agron. 18:267–288.
Prasad, R., and G. J. Hochmuth. 2016. “Environmental Nitrogen Losses from Commercial Crop Production Systems in the Suwannee River Basin of Florida.” PLoS ONE 11(12): e0167558. https://doi.org/10.1371/journal.pone.0167558
Radovanovic, J., E. Z. Bean, and A. J. Reisinger. 2021. “Design, Construction, and Installation of a Drainage Lysimeter for Use on Sandy, Well-Drained Soils under Turfgrass: AE554/AE554, 02/2021.” EDIS 2021(1). https://doi.org/10.32473/edis-ae554-2021
Šimůnek, J., M. T. van Genuchten, and M. Šejna. 2008. “Development and Applications of the HYDRUS and STANMOD Software Packages and Related Codes.” Vadose Zone J. 7:587–600.
United States Environmental Protection Agency (US EPA). 2007. “Soil Sampling.” https://www.epa.gov/foia/soil-sampling-operating-procedure
Webster, C. P, M. A. Shepherd, K. W. T. Goulding, and E. Lord. 1993. “Comparison between Methods for Measuring the Leaching of Mineral Nitrogen from Arable Land.” J. Soil Sci. 44:49–62.
Zotarelli, L., J. M. Scholberg, M. D. Dukes, and R. M. Carpena. 2007. “Monitoring of Nitrate Leaching in Sandy Soils: Comparison of Three Methods.” J. Environ. Qual. 36:953–962. doi:10.2134/jeq2006.0292.