Introduction
Information about storm frequency can help to better communicate the probabilistic nature of rainfall events, which is used as a basis for design in many engineering fields. Communicating storm event characteristics, such as size and duration, is critical to agriculture, transportation, construction, natural resources management, and other fields affected by significant rainfall events. The probability of a certain size of event occurring within a set duration can be determined from historical rainfall records. Such an estimation process is called rainfall frequency analysis. The analysis can be used to calculate the probability of a storm event of interest occurring during a year or within a number of years (Her et al. 2018). Moreover, estimating the probability of a certain storm (or rainfall) event occurring can help people anticipate and prepare for the impacts. For example, hydraulic structures, such as canals, levees, dikes, dams, stormwater pipes, and ponds, are typically sized and designed for events of a certain historical rainfall or flood frequency. The National Oceanic and Atmospheric Administration’s (NOAA) National Weather Service (NWS) has developed a publicly available tool to quickly and easily estimate the frequency of a storm event: NOAA Atlas 14 Point Precipitation Frequency Estimates (https://www.weather.gov/owp/hdsc). This article introduces NOAA Atlas 14 and explains how to use it to help Extension agents and the general public estimate the frequency of any storm event of interest. The frequency estimate of a storm event using NOAA Atlas 14 helps the user to understand how large a storm is in relation to the historical storm events that occurred at a certain location. In addition, the information on the estimate’s confidence interval provided by NOAA Atlas 14 is expected to help people better understand the probabilistic nature of rainfall events.
NOAA Atlas 14 Point Precipitation Frequency Estimates
NOAA Atlas 14 provides the depth estimates for a rainfall event of a certain duration and probability in a year and is the official estimate of precipitation frequency for most locations within the United States (except for Idaho, Montana, Oregon, Washington, and Wyoming). However, because it is based on historical rainfall records, it does not take into account any effects of climate change. Users should follow appropriate current procedures for using these data for future scenarios (NOAA NWS 2023; NOAA CPO 2023). The resulting probability (or recurrence interval) is determined from the depth and duration of a rainfall event for a location. The web-based system of NOAA Atlas 14, Precipitation Frequency Data Server (PFDS), offers an easy interface for using NOAA Atlas 14. Users can select a location of interest on a map or specify the location by selecting a weather station nearby, or by providing the latitude/longitude or address of the location (https://hdsc.nws.noaa.gov/hdsc/pfds/pfds_map_cont.html). The system will then provide a table and plot showing the depth (or size) of a rainfall event that corresponds to the duration (or intensity) and probability (or frequency) of interest.
Example 1
This example discusses estimating the depth of rainfall that may occur with a certain probability and last a certain duration in Union Park, FL.
- Navigate to NOAA Atlas 14 Point Precipitation Frequency Estimates (https://hdsc.nws.noaa.gov/hdsc/pfds/pfds_map_cont.html).
- Put the location of interest, Union Park, FL, USA, into the text box next to “c) By address” (a box with a dashed line in red in Figure 1).
- Click the magnifier icon right next to the text box.
- Scroll down and find a table, “PF tabular,” showing the depths of rainfall events by their “Average recurrence intervals (years)” (or return periods) and “Duration” (Figure 2). From this table, we can find that the expected depth of a 24-hour rainfall event with a 100-year recurrence interval (return period or 1% probability of occurrence) is 10.7 inches. In addition, the estimate of 10.7 inches has a 90% confidence interval of 8.25 inches to 14.40 inches. This means that, based on historical data, there is a 90% probability that a 24-hour event with a 1% probability of happening each year would have a depth of 8.25 inches to 14.40 inches.
- Click the “PF graphical” tab to see plots showing depth-duration-frequency curves (Figure 3). This plot contains the same information as the previous table but presents the expected rainfall depths graphically. For example, cross boxes in red on the two different depth-duration-frequency (DDF) curves of Figure 3 indicate the same amount of 10.7 inches (on the y-axis) that corresponds to the depth of a 24-hour rainfall (on the x-axis in the top plot and on the dark-blue line in the bottom plot) with a 100-year recurrence interval (on the x-axis in the top plot and on the light-blue line in the bottom plot).
- Click the “PF estimates with confidence intervals” tab to see the ranges of the estimated precipitation depths corresponding to the “Duration” and “Average recurrence interval (years)” (Figure 4). This plot contains the same information as the previous table but presents the expected confidence intervals graphically.
- Click the “Supplementary information” tab for more detailed and technical information. In the tab, we can: 1) read documents that describe the procedures and background theories applied to the frequency analysis; 2) convert the map of estimates to an ASCII file that is compatible with GIS software; 3) create a PDF map showing the spatial variations of rainfall depths expected for a combination of certain return period and duration; and 4) create a table showing the temporal variation of rainfall depth expected to last a certain duration within the event (Figure 5).
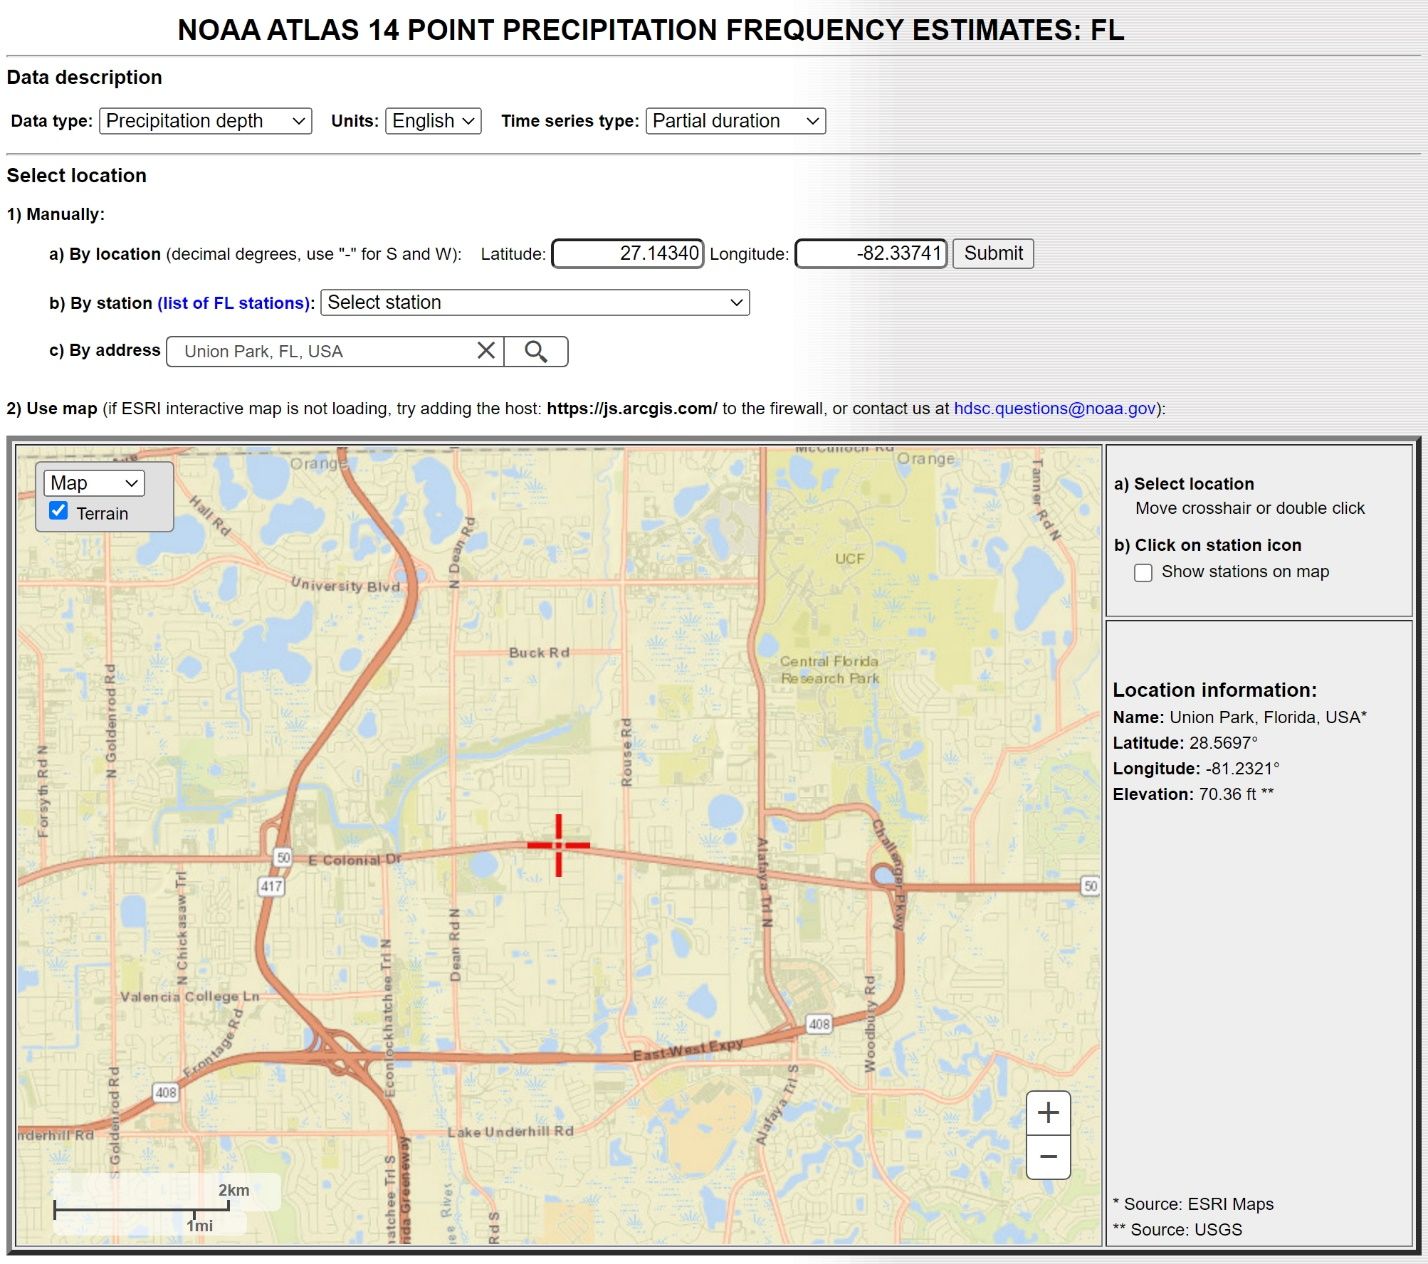
Credit: NOAA (https://hdsc.nws.noaa.gov/hdsc/pfds/pfds_map_cont.html)
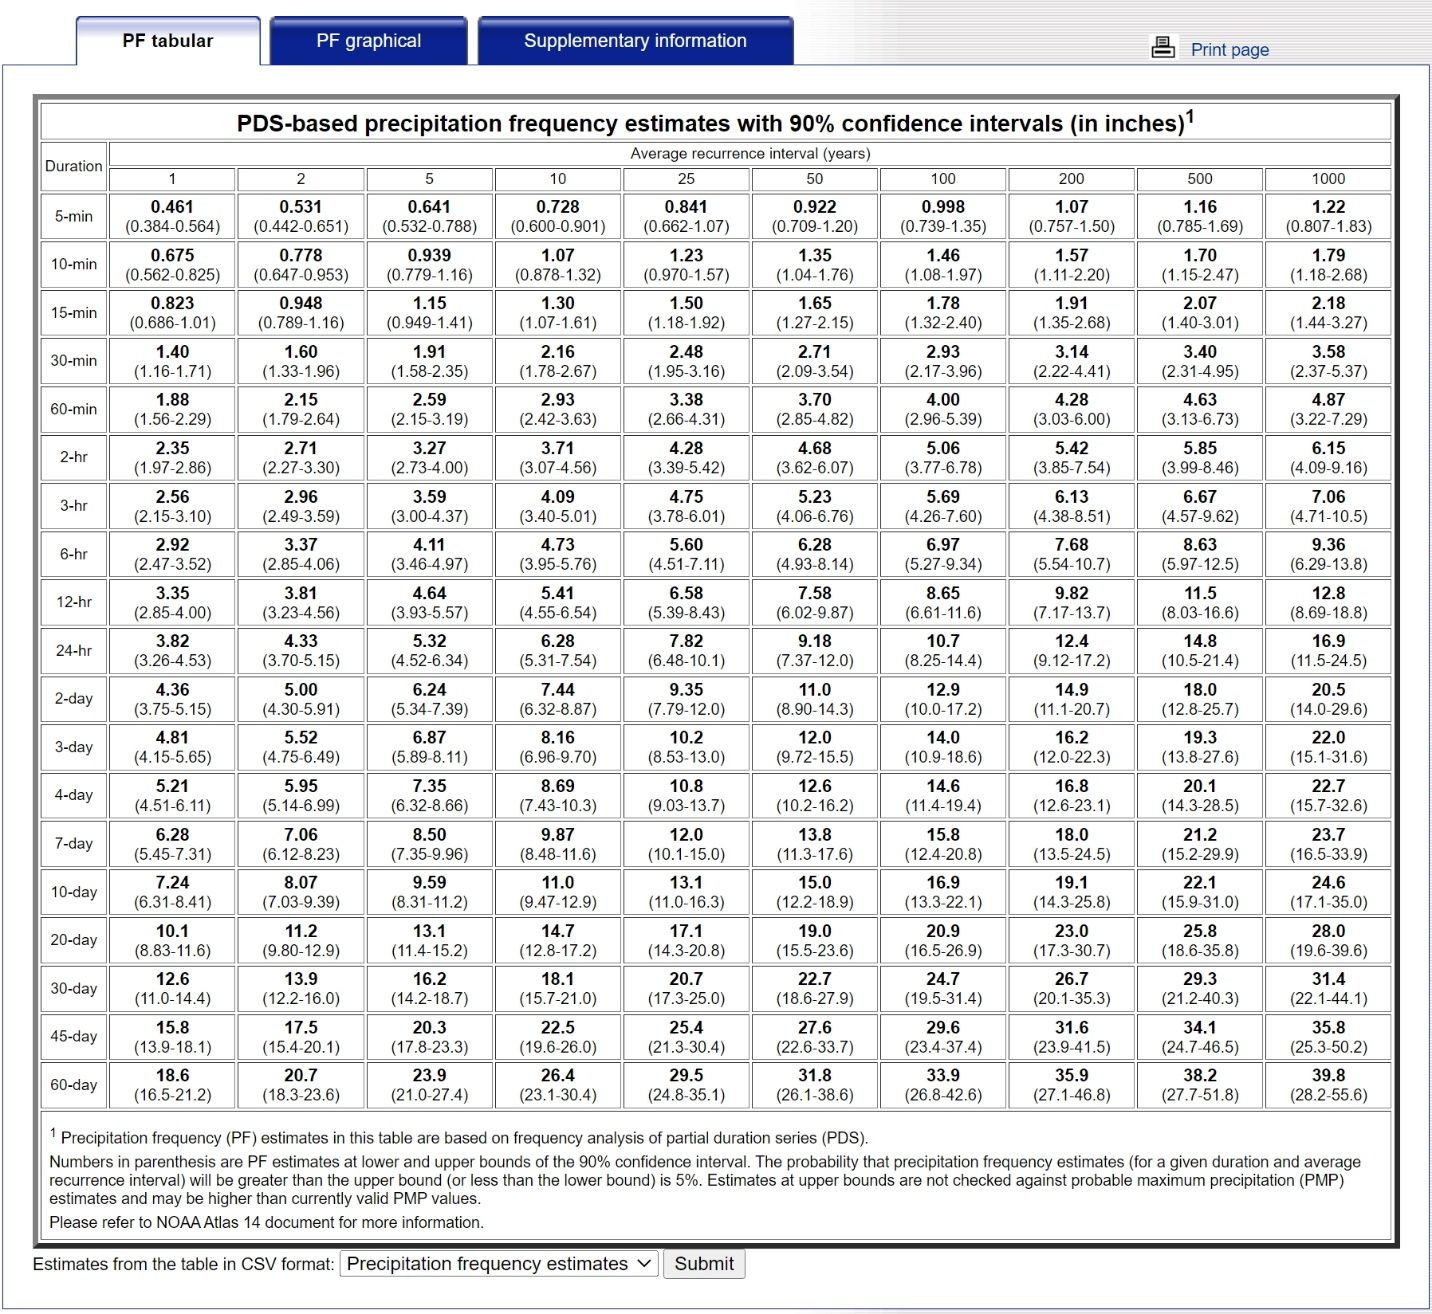
Credit: NOAA (https://hdsc.nws.noaa.gov/hdsc/pfds/pfds_map_cont.html)
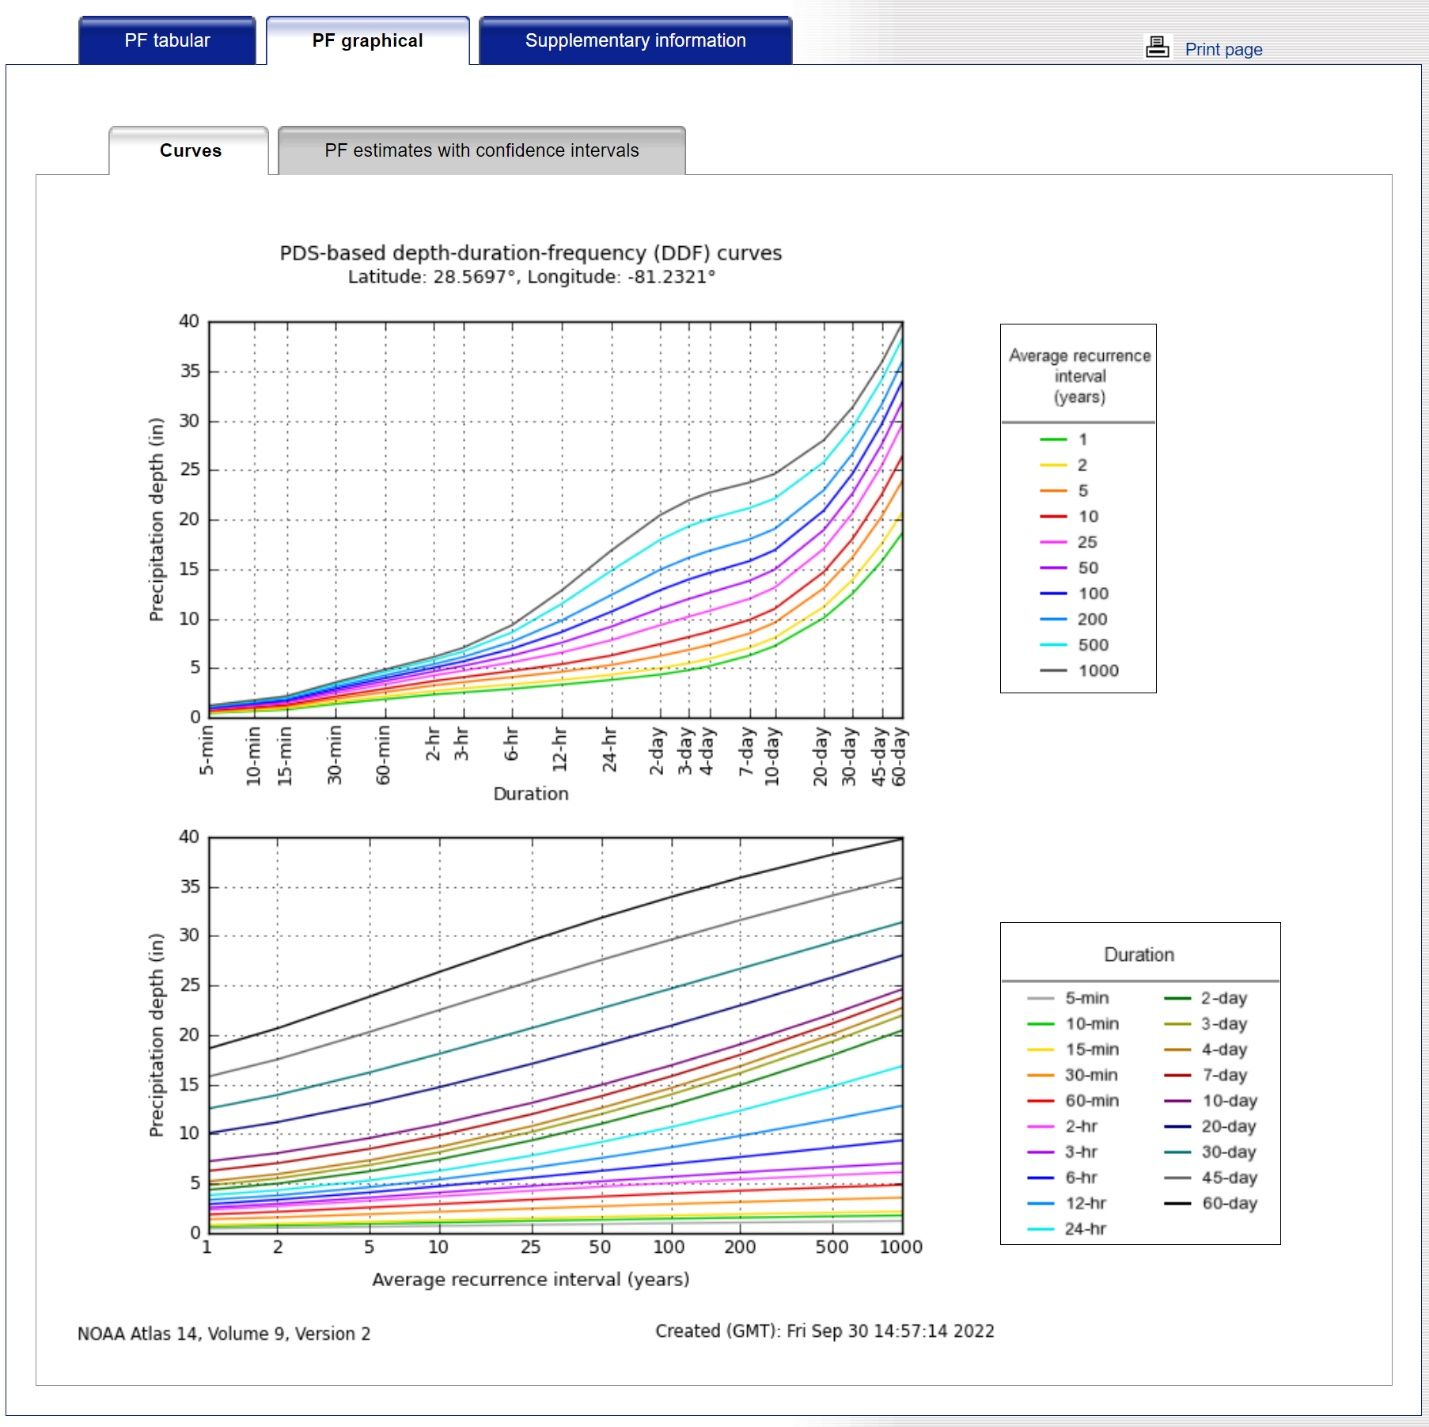
Credit: NOAA (https://hdsc.nws.noaa.gov/hdsc/pfds/pfds_map_cont.html)
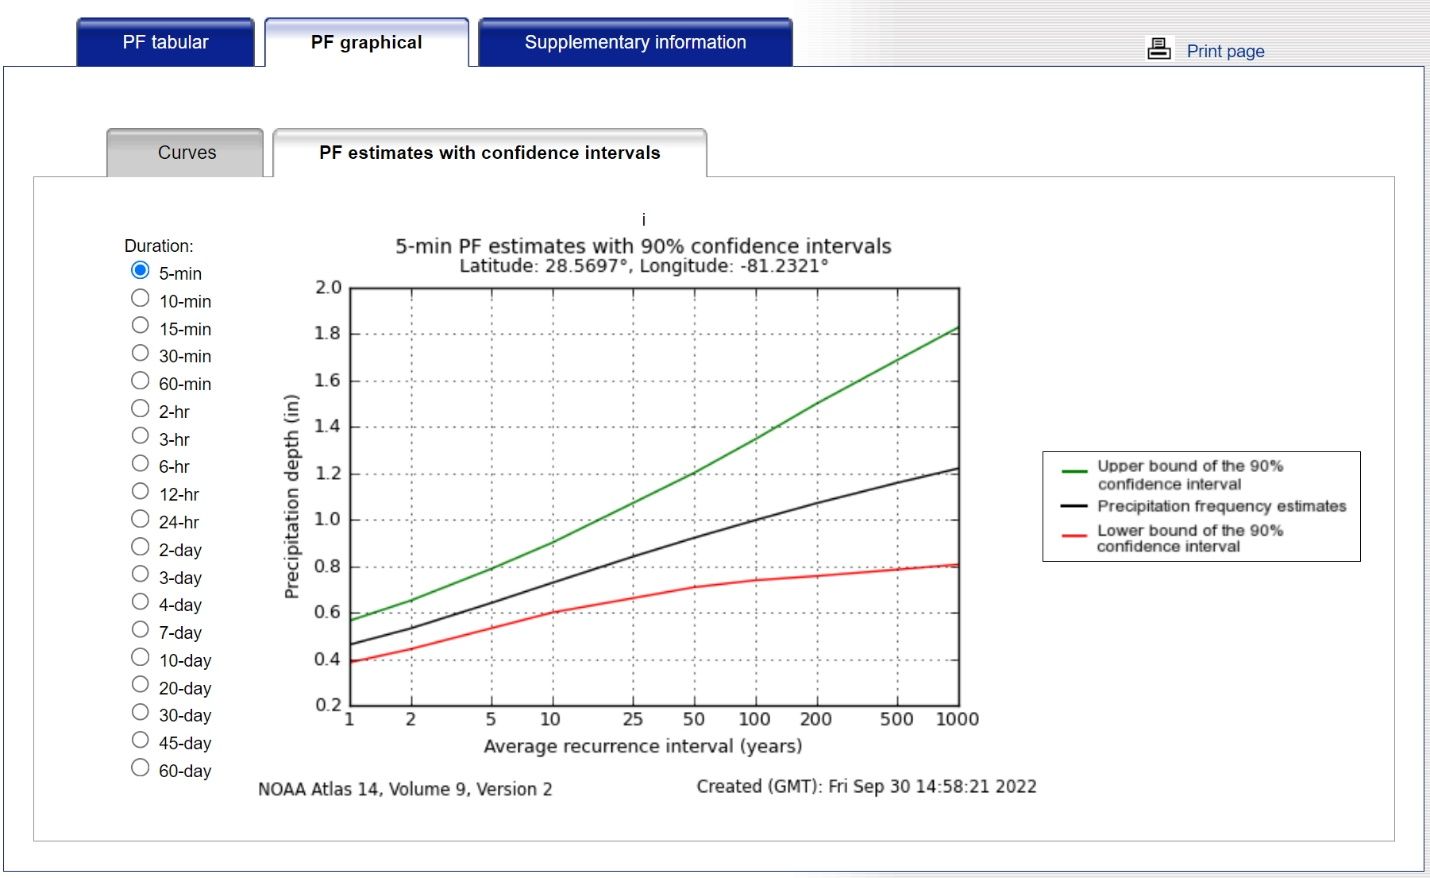
Credit: NOAA (https://hdsc.nws.noaa.gov/hdsc/pfds/pfds_map_cont.html)
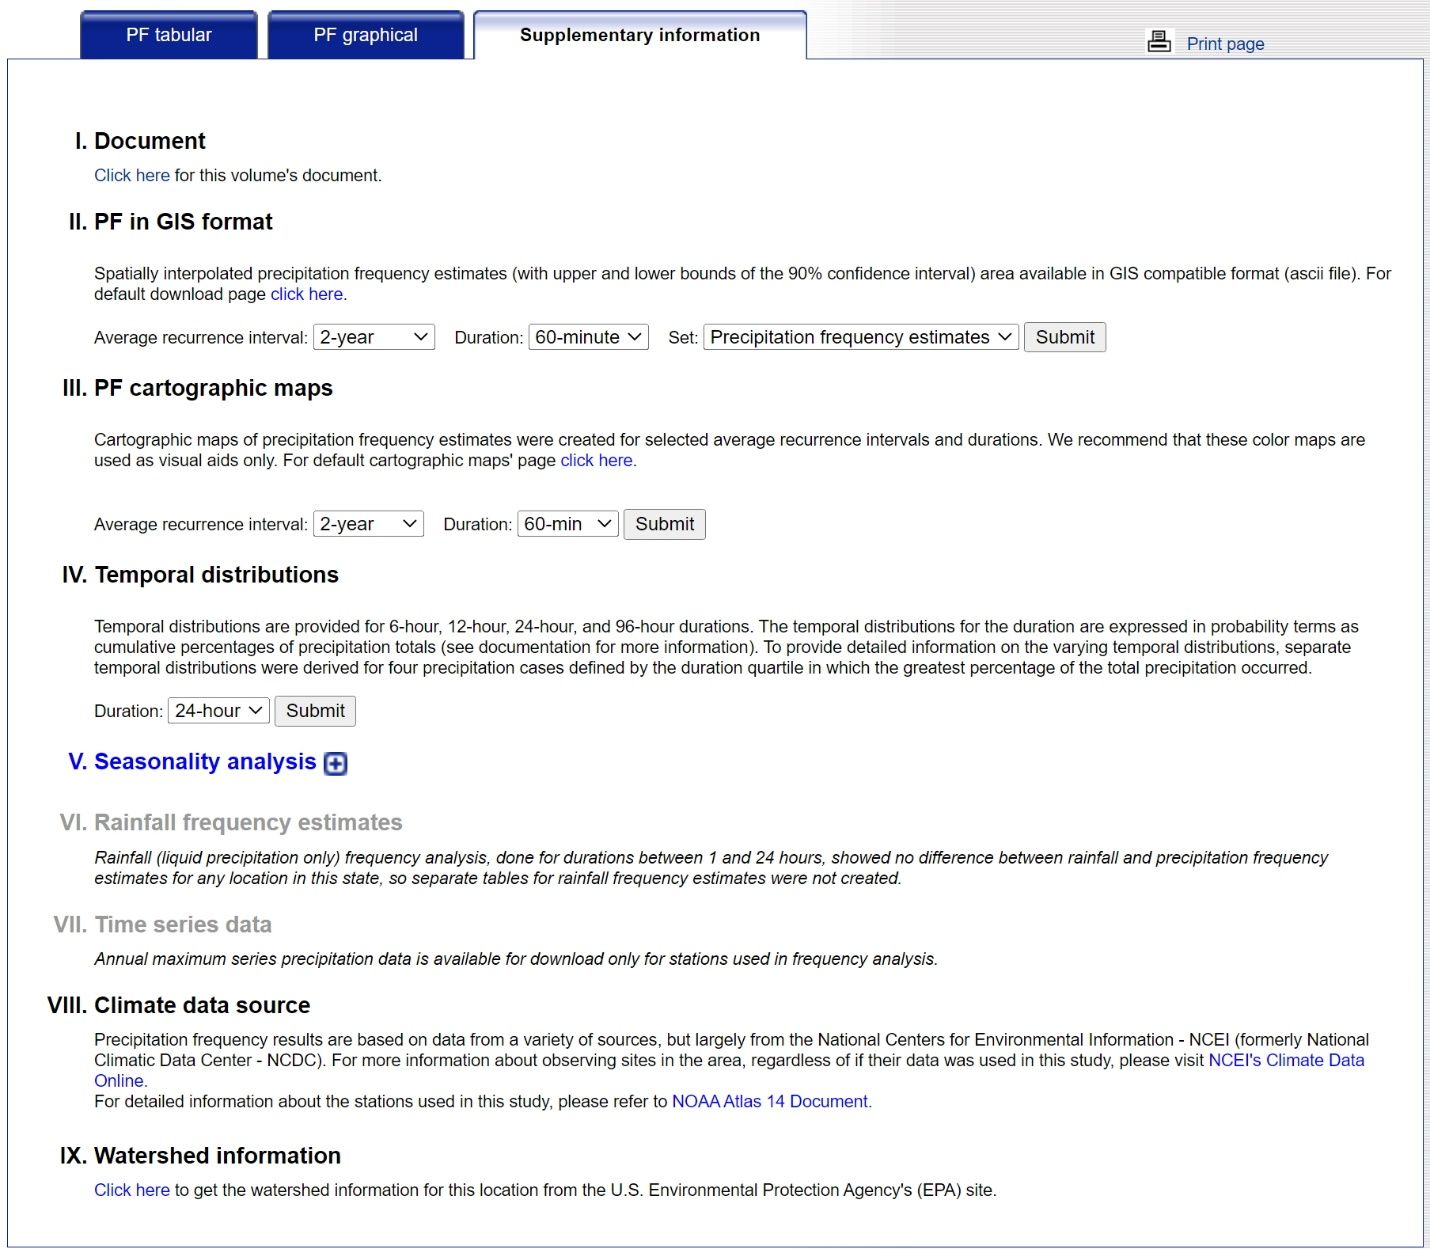
Credit: NOAA (https://hdsc.nws.noaa.gov/hdsc/pfds/pfds_map_cont.html)
Example 2
This example discusses estimating the frequency (or probability) of rainfall that occurred in Sarasota County, FL, on September 28, 2022. In this example, we are going to use the records of rainfall depth observed at the North Port Florida Automated Weather Network (FAWN) station, which is located within the county.
- Visit the FAWN database (https://fawn.ifas.ufl.edu/data/reports/) and download the records of a rainfall event (a CSV file) that occurred in Sarasota County on September 28, 2022 (Figure 6).
- Open the downloaded FAWN report (in the CSV [Excel] format) and find the depth of the rainfall as well as the depth of the rainfall event of interest (Figure 7). In this example, the depth is 13.67 inches.
- Find the latitude and longitude of the North Port FAWN station from the FAWN website (https://fawn.ifas.ufl.edu/tour/location_info.php) (Figure 8). The table shows that the station is located at a latitude of 27.14340° (or N 27.14340) and a longitude of -82.333741° (or W 82.333741).
- Visit NOAA Atlas 14 Point Precipitation Frequency Estimates (https://hdsc.nws.noaa.gov/hdsc/pfds/pfds_map_cont.html).
- Put the location of interest, the North Port FAWN station, into the text boxes next to “a) By location (decimal degrees, use “-“ for S and W)” (Figure 9).
- Click the “Submit” button in gray right next to the text boxes. The map will focus on the location of interest (Figure 10).
- Scroll down and find a table, “PF tabular,” showing the depths of rainfall events by their “Average recurrence intervals (years)” (or return periods) and “Duration” (Figure 11). From this table, we can find that the 13.67 inches of a 24-hour (or 1-day) rainfall event is close to 13.3 inches of a 200-year rainfall event. Thus, we can say that the event of 13.67 inches for the location has a 200-year return period or the 1/200 (or 0.5%) probability of occurring in any year. The confidence intervals of the 100-year, 500-year, and 1,000-year rainfall events also cover the recorded depth of 13.67 inches; thus, the frequency or return period can be 100, 200, 500, or even 1,000 years. However, the best estimate of the return period is 200 years because its estimate of 13.30 inches is closest to the depth of 13.67 inches compared to the others.
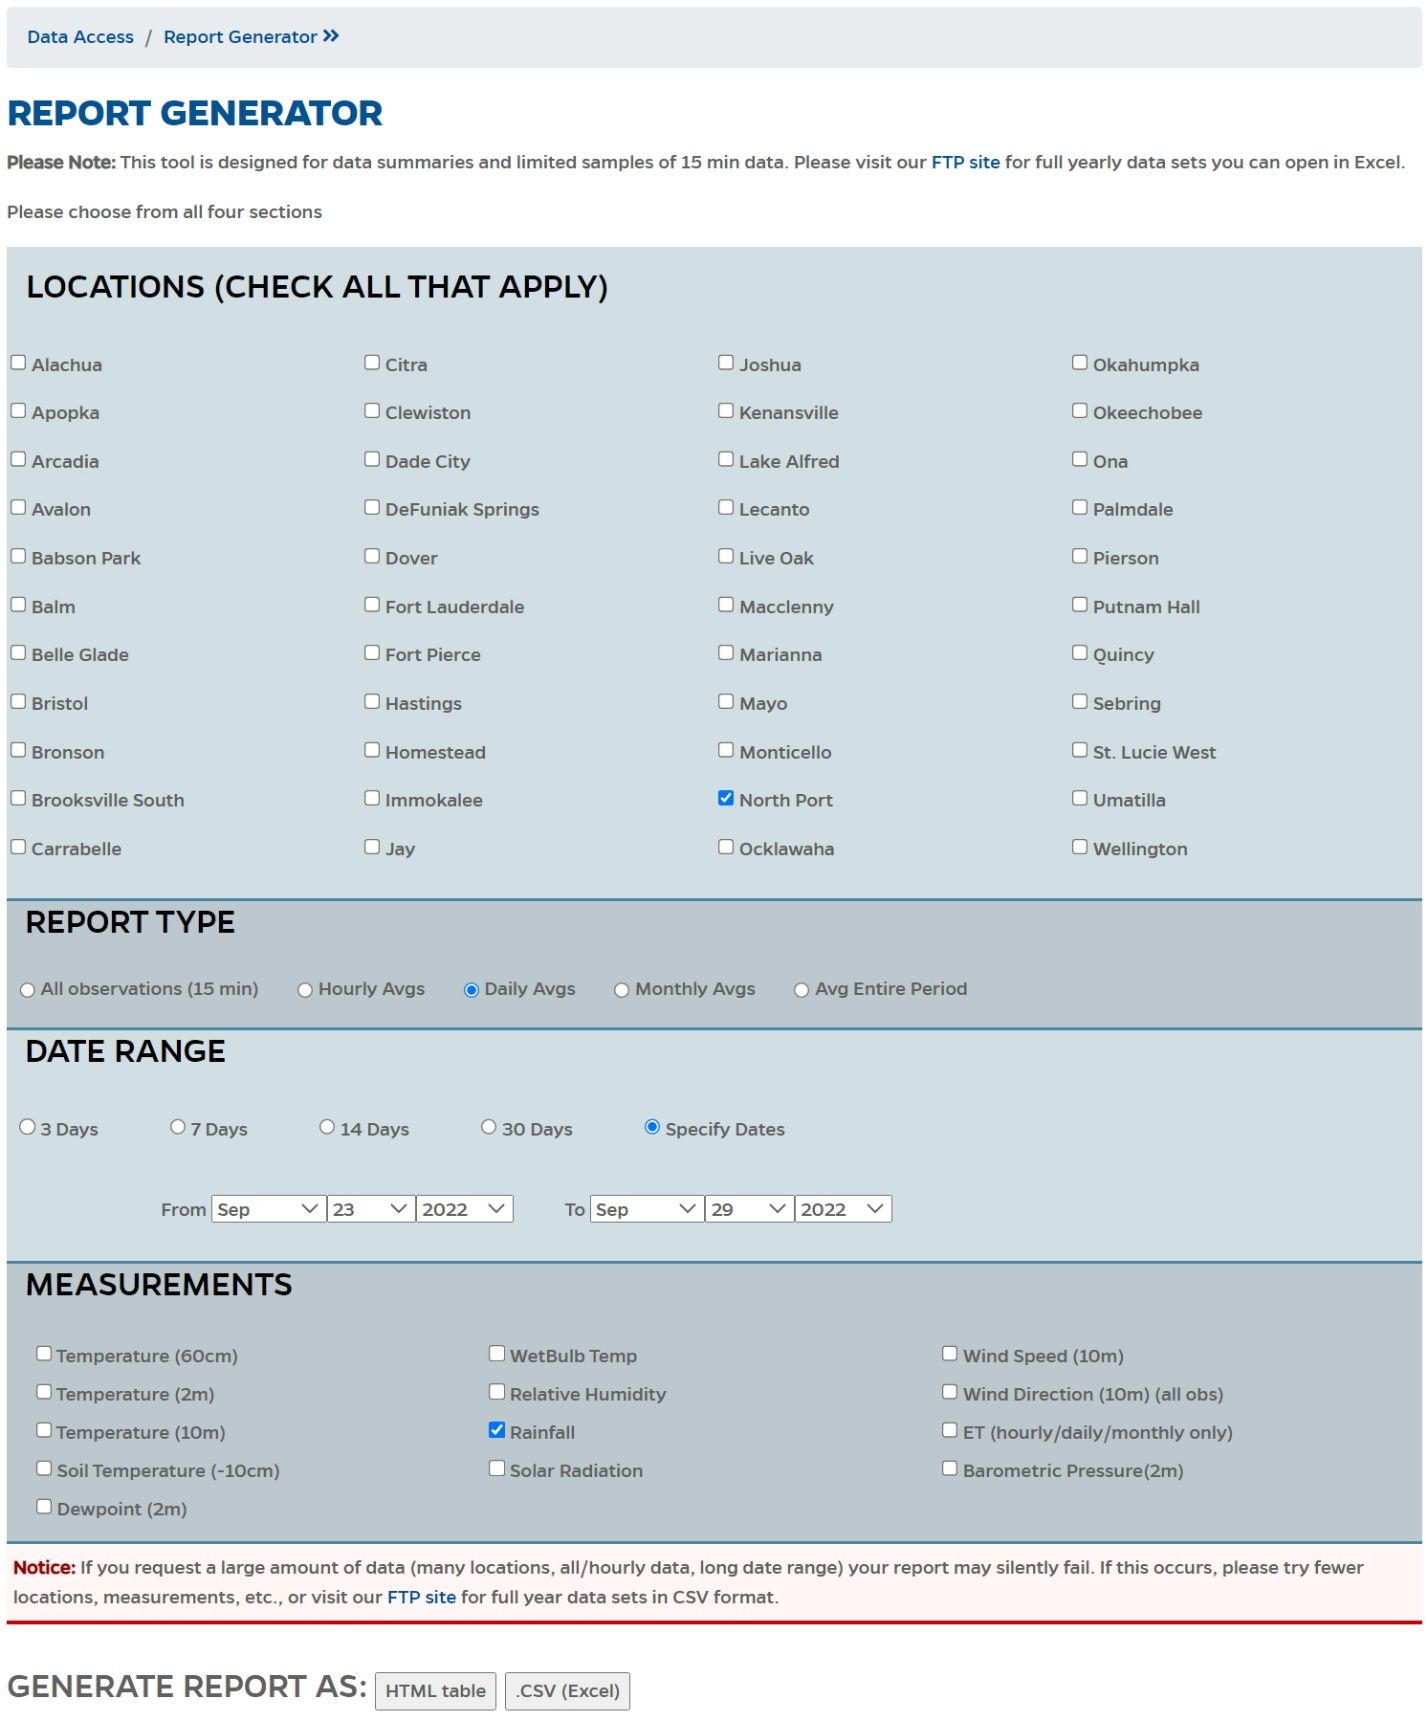
Credit: NOAA (https://hdsc.nws.noaa.gov/hdsc/pfds/pfds_map_cont.html)
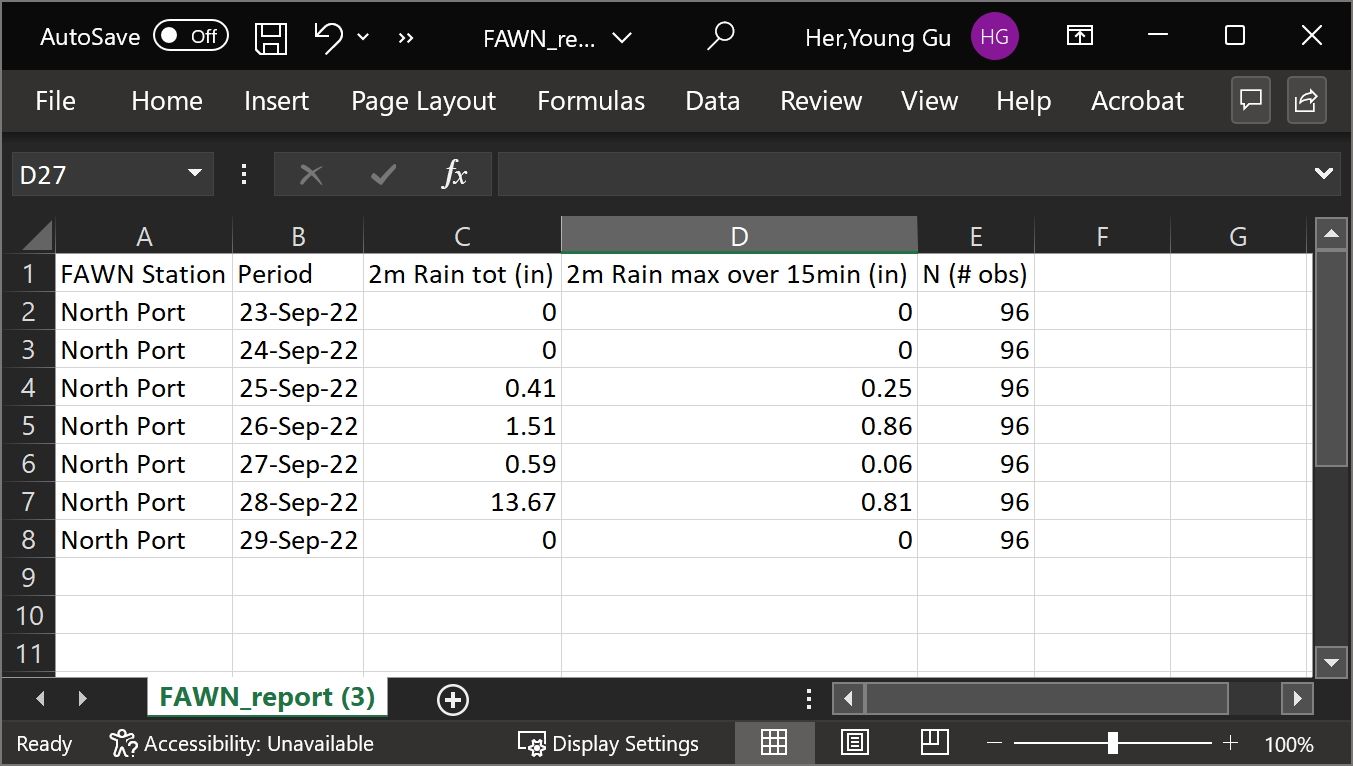
Credit: Young Gu Her, UF/IFAS

Credit: NOAA (https://hdsc.nws.noaa.gov/hdsc/pfds/pfds_map_cont.html)
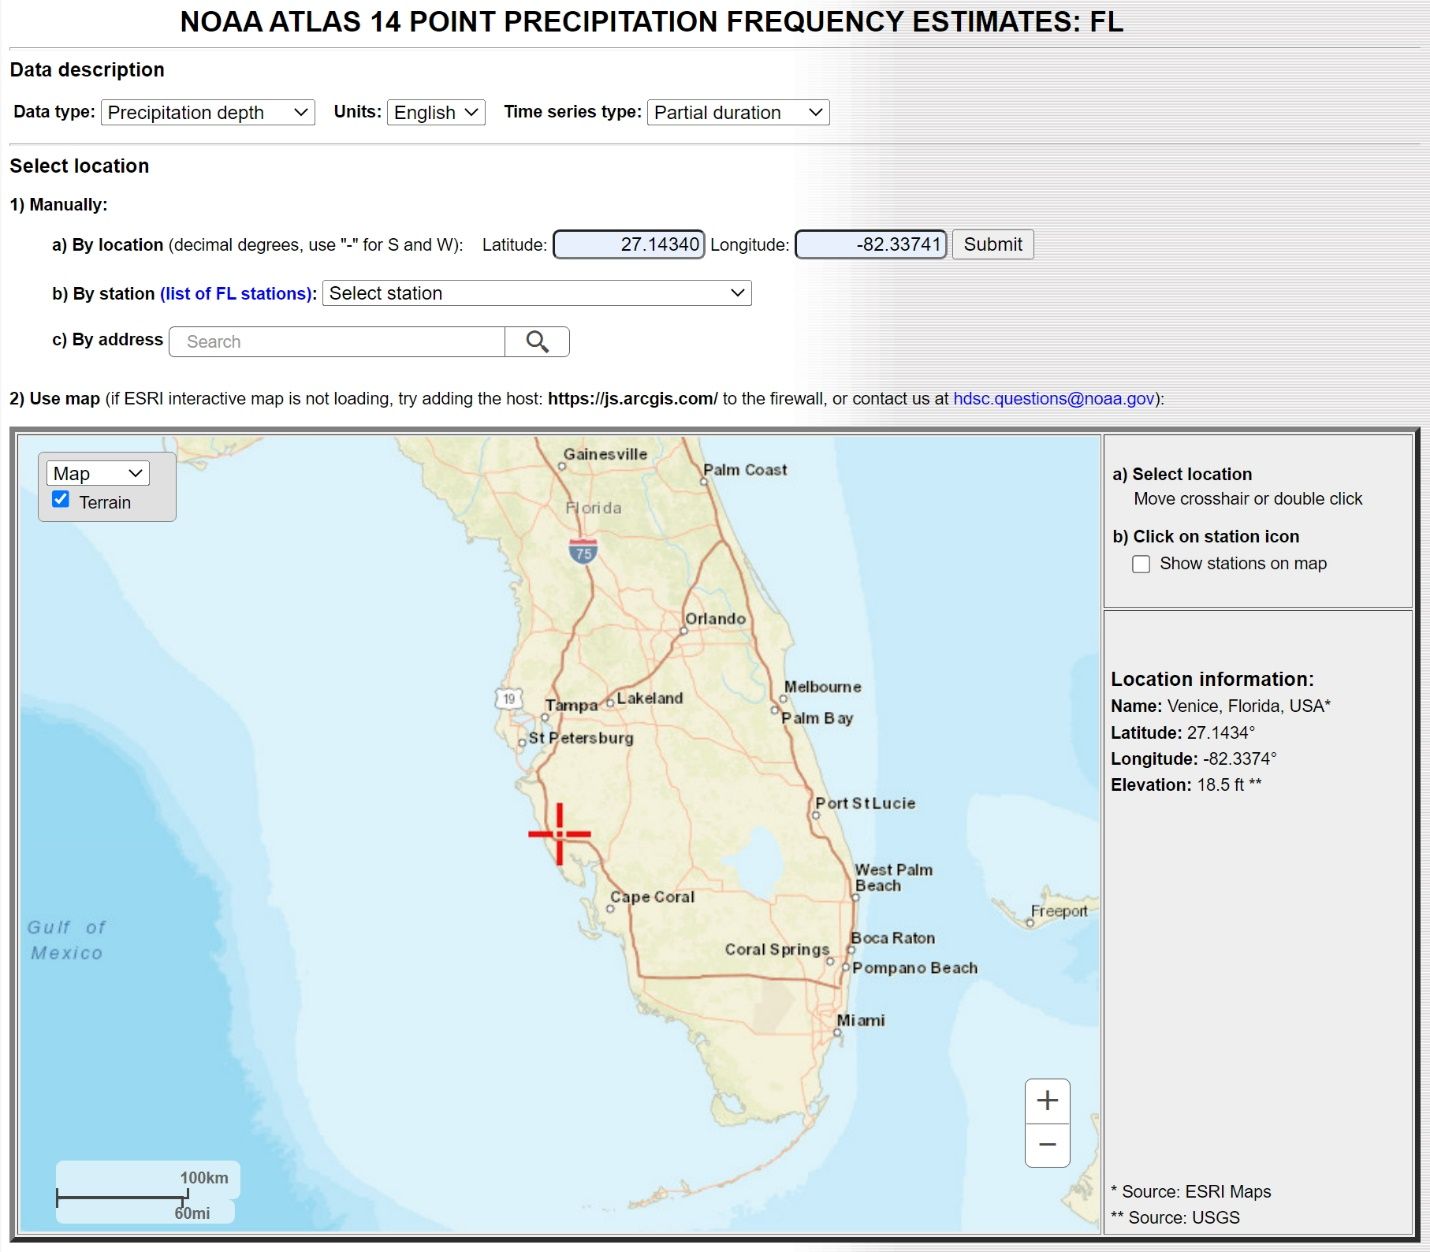
Credit: NOAA (https://hdsc.nws.noaa.gov/hdsc/pfds/pfds_map_cont.html)
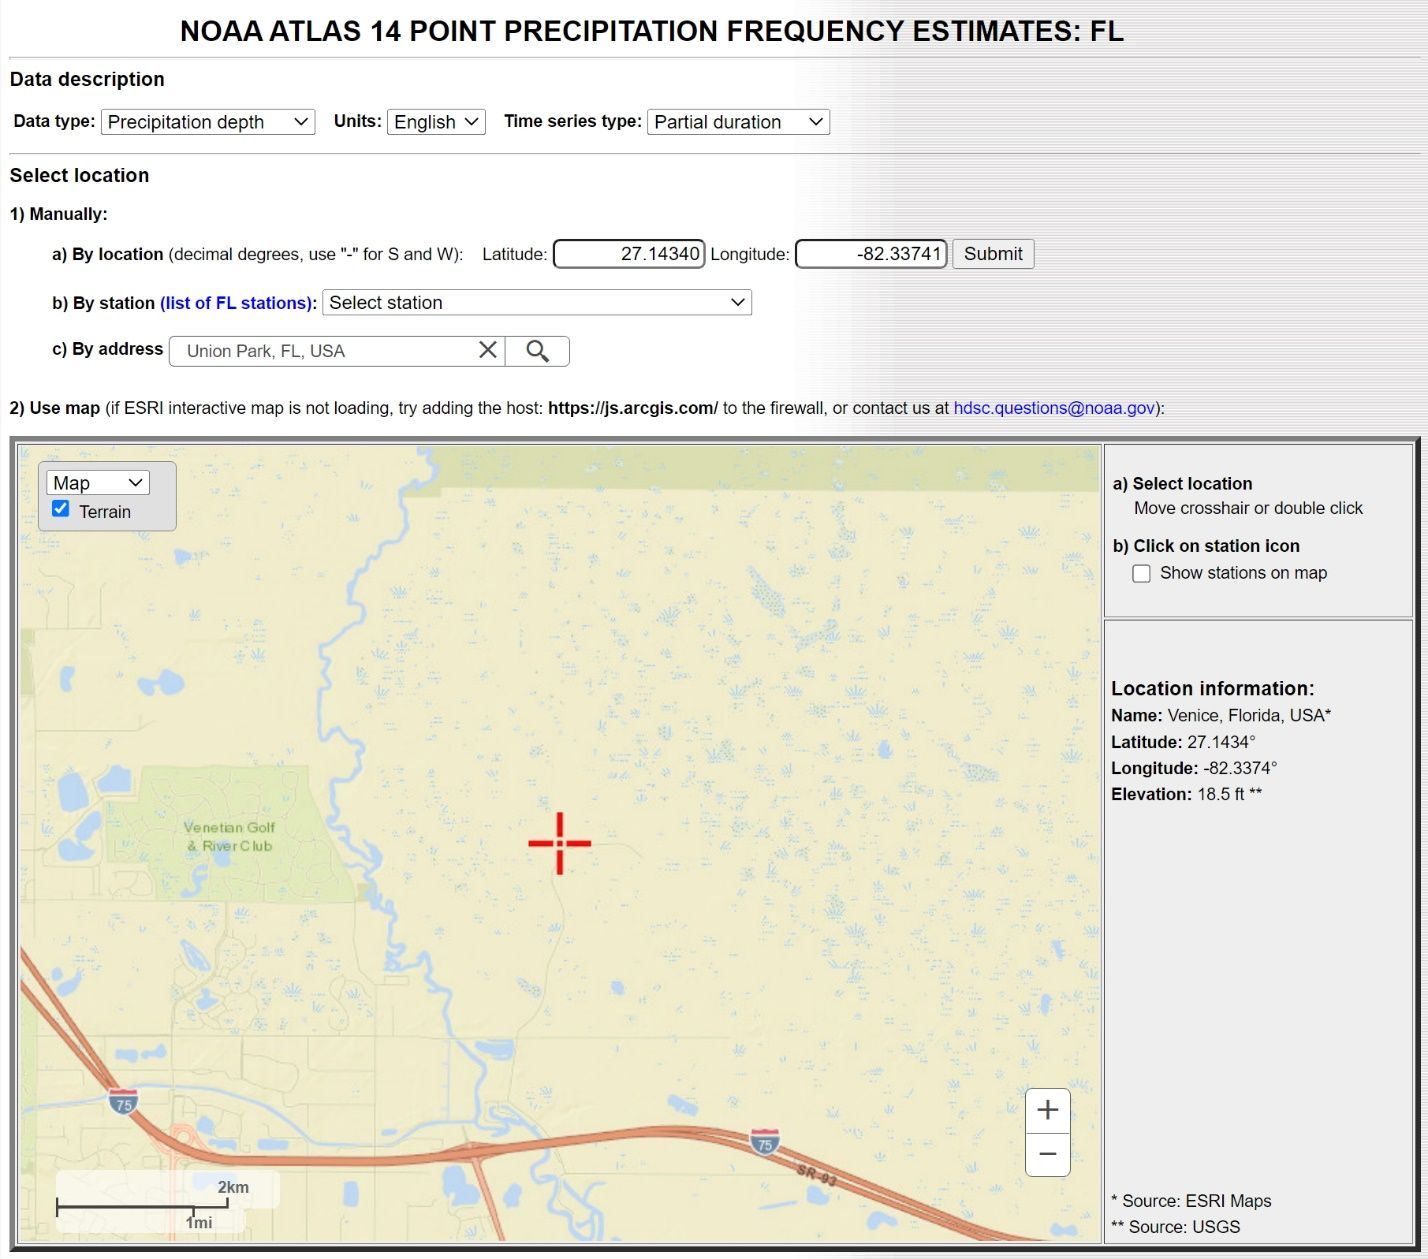
Credit: NOAA (https://hdsc.nws.noaa.gov/hdsc/pfds/pfds_map_cont.html)
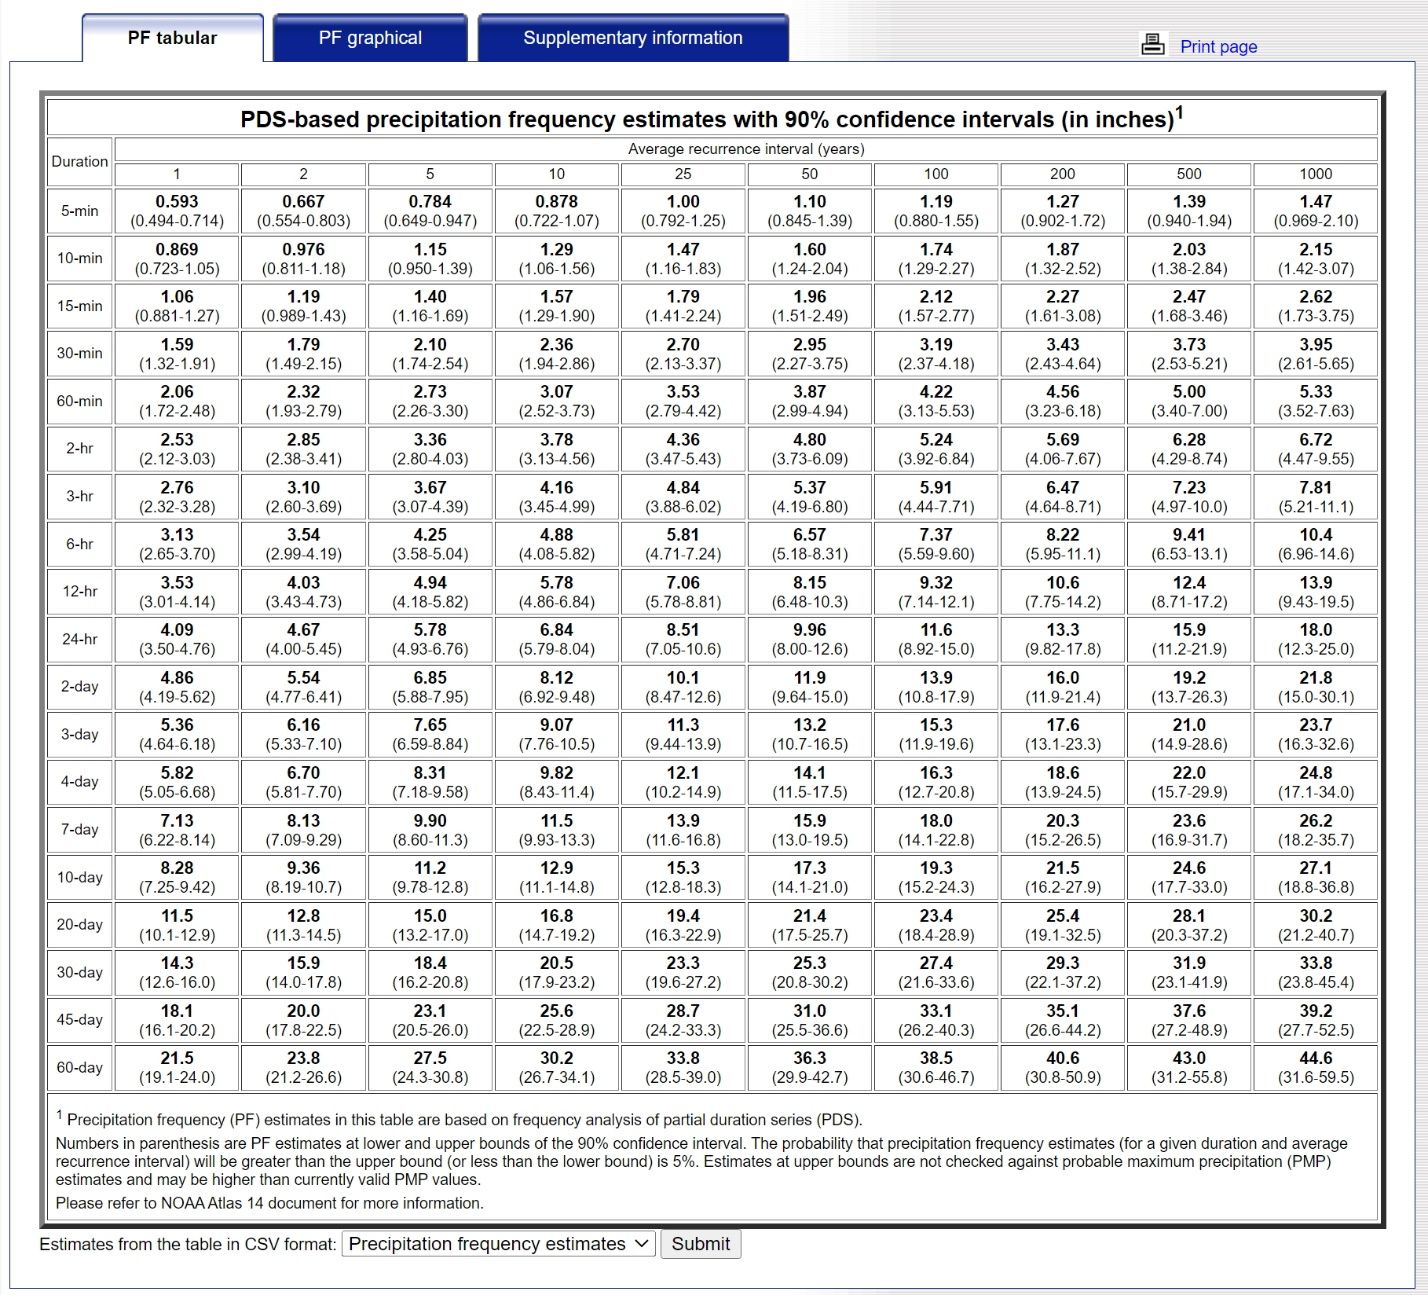
Credit: NOAA (https://hdsc.nws.noaa.gov/hdsc/pfds/pfds_map_cont.html)
Summary
NOAA Atlas 14 Point Precipitation Frequency Estimates are a useful tool that can aid in estimating the depth of a storm event to occur with a certain frequency or probability in any year. As demonstrated in the examples of this article, the tool does not require any background knowledge of statistics and frequency analysis—only the locational information for a place of interest, the rainfall depth, and the duration of a storm event of interest. The two examples focused on Florida, but the tool can be applied to most other places in the United States (except for states in the Northwest). The tool is expected to help users better understand how the rainfall depths of storm events can vary by location, duration, and frequency.
References
Her, Y. G., W. R. Lusher, and K. W. Migliaccio. 2018. “How Likely Is a 100-Year Rainfall Event During the Next Ten Years?” EDIS 2018 (2): AE523, 3/2018. https://doi.org/10.32473/edis-ae523-2018
NOAA CPO. 2023. “NOAA Atlas 14 Precipitation Frequency Atlas of the U.S.” Accessed on April 6, 2023. https://www.youtube.com/watch?v=bD623aYVxeE&ab_channel=ClimateProgramOffice
NOAA NWS. 2023. “5. Precipitation Frequency Data Server.” Accessed on April 6, 2023. https://www.weather.gov/media/owp/hdsc_documents/NA14_Sec5_PFDS.pdf