The purpose of this publication is to inform Extension agents, consultants, and farmers about plant essential nutrients, benefits, and deficiency symptoms. This publication provides a whole plant picture with deficiency symptoms for each nutrient and the location of those symptoms on the plant. The publication also includes the pH scale representing the nutrient availability across different soil pH levels. This publication explains the nitrogen cycle and the important interaction of macro- and micronutrients.
Plants need 17 essential nutrient elements to complete their life cycle (i.e., growth and reproduction) (Table 1). Carbon (C), hydrogen (H), and oxygen (O) are provided by air and water, and there is little control over the availability of these nutrients. For most plants, these three elements make up 94% or more of the dry tissue. The other 14 elements collectively represent less than 6% of the plant dry matter. A deficiency of one or more of these 14 elements often affects crop production.
Fourteen of these essential nutrients, provided by the soil or supplemented by fertilizers, are divided into two groups: macronutrients (required in large amounts) and micronutrients (required in small amounts). The macronutrients are nitrogen (N), phosphorus (P), potassium (K), sulfur (S), calcium (Ca), and magnesium (Mg). The micronutrients include manganese (Mn), iron (Fe), boron (B), zinc (Zn), copper (Cu), molybdenum (Mo), chlorine (Cl), and nickel (Ni). Various removal, fixation, and release mechanisms greatly influence the availability of nutrients to plants from the soil.
Nutrients of Concern to Florida Growers
Macronutrients
Nitrogen (N)
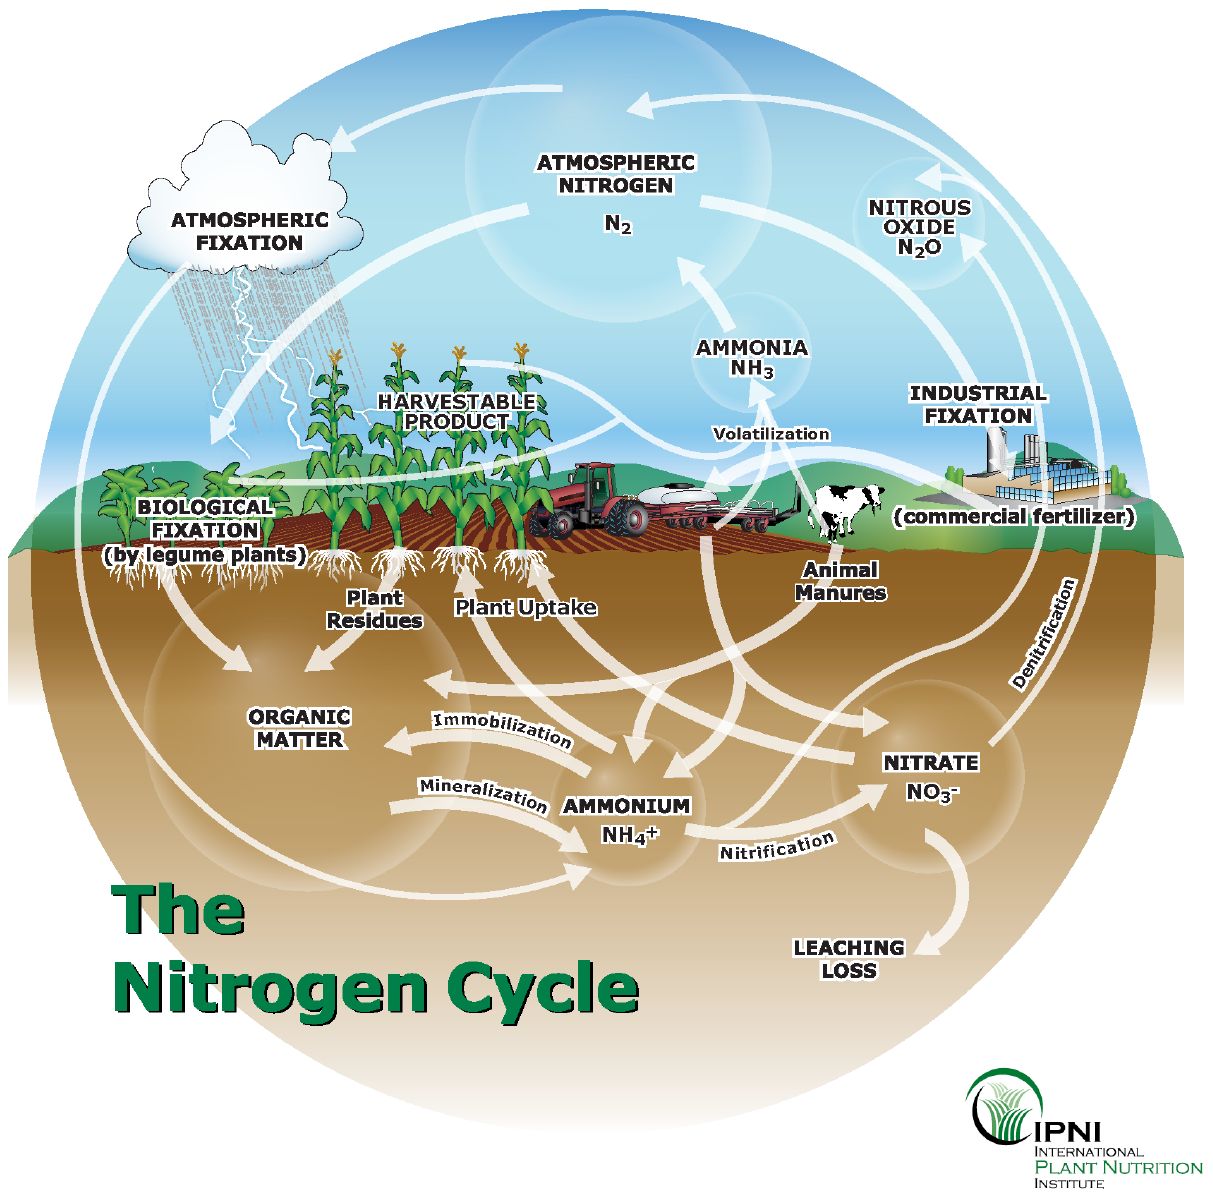
Nitrogen is the most limiting nutrient for plant growth. Figure 1 illustrates transformations in the N cycle. In most soils, the bulk of soil N is found within 2 feet of the surface. N is a principal component of all living cells and is necessary for all proteins, enzymes, and metabolic processes involved in synthesizing and transferring energy. Nitrogen is a structural part of chlorophyll that is responsible for photosynthesis. Nitrogen is also responsible for stimulating rapid, vigorous growth, and increasing seed and fruit yield.

Credit: IPNI
Nitrogen Cycle
The Major Transformations of Nitrogen
- Bacteria convert atmospheric N2 gas into available forms such as nitrites, nitrate, and ammonia.
- Nitrification is a conversion of ammonia to nitrate.
- Denitrification is a conversion of nitrite to gaseous forms of nitrogen.
Soil N is present in three major forms.
- Elemental N is found in a gaseous form in the soil atmosphere, a stable diatomic molecule. The atmosphere has 78% of elemental N. This atmospheric N has direct significance for plants. The nitrogen-fixing bacteria convert environmental N (elemental N) to plant-available N in the soil.
- Organic N makes up nearly 5% of the soil organic matter (humus) by weight and nearly 98% of the total soil N. Organic N is available to plants once converted to inorganic forms (ammonium and nitrate) by soil organisms.
- Fertilizer N for crops is inorganic N, and it is comprised of three types: ammonium (NH4+), nitrate (NO3 -), and urea (CO(NH2)2). While urea is an organic N fertilizer, it is converted to ammonium form quickly after exposure to moist, aerated soil by the urease enzyme.
Phosphorus (P)
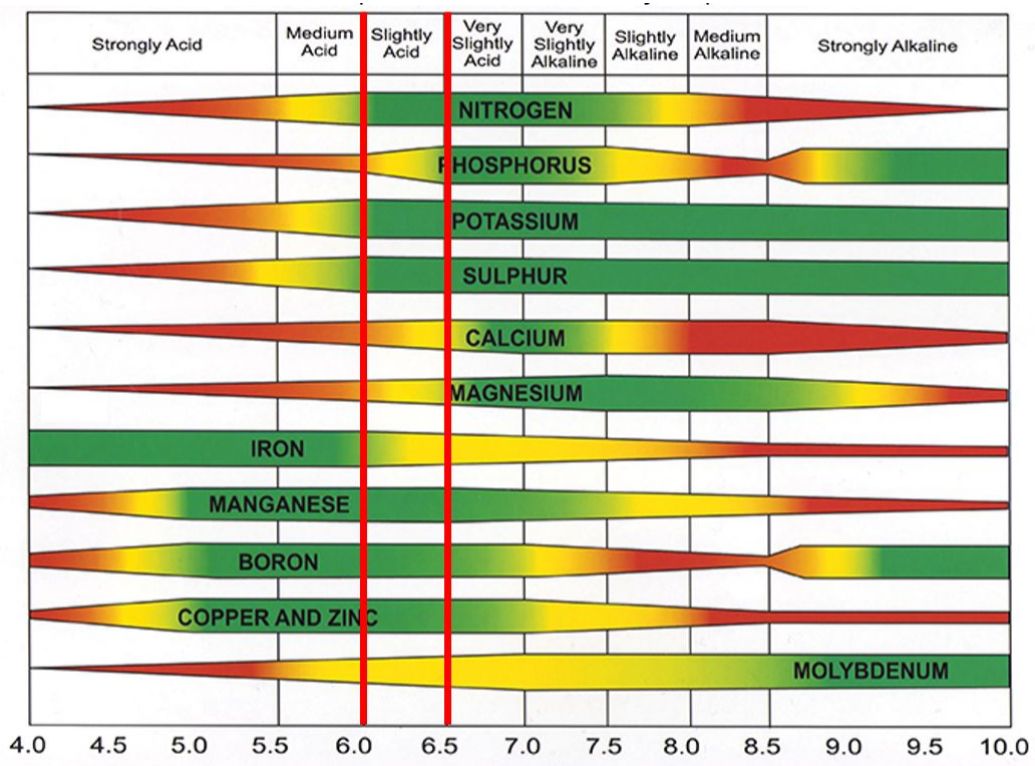
Phosphorus is an essential part of photosynthesis. In young plants, P is most abundant in tissue at the growing point. The immediate source of P for plants is dissolved in the soil solution. Concentrations of phosphate ions in the soil solution may be as low as 0.001 parts per million (ppm), and in-plant dry weight could be in the range of 0.1–0.5%. Soil P is most available for plant growth in the soil pH range of 6.0–7.0 (Figure 2).

Credit: Credit: No-Till Farmer (https://www.no-tillfarmer.com/articles/8691-what-is-my-soil-test-report-telling-me)
Potassium (K)
Unlike N and P, potassium is not found in organic combination with plant tissues. Potassium plays an essential role in the metabolic processes of plants. Adequate amounts are required for several enzymatic reactions, such as those involving the adenosine phosphates (ATP and ADP), which are energy carriers in the metabolic processes of both plants and animals. Most Florida soils have low nutrient holding capacity, so K concentration tends to be low.
Calcium (Ca)
Calcium, an essential part of plant cell wall structure, is required for the normal plant transport system, retention of other elements in the plant, and structural support to plant cells. It also counteracts the effect of alkali salts and organic acids within a plant. Calcium helps in balancing Mg and K ions in the plant cells. Too much of any of these elements may cause insufficiencies of the other two.
Magnesium (Mg)
Magnesium is part of chlorophyll in all green plants and is essential for photosynthesis. It also helps to activate many plant enzymes needed for growth.
Sulfur (S)
Sulfur is a constituent of three amino acids, cystine, cysteine, and methionine. S is also present in glycosides, which give the characteristic odors and flavors in mustard, onion, and garlic plants. It is required for nodulation and N fixation of legumes.
Micronutrients
Micronutrient deficiencies most commonly limit crop growth under the following conditions:
- Highly leached, acidic sandy soils: These soils are common in Florida, with a pH range of 4.5–6.5. The organic matter content in such soils ranges from 0.5–2%. These soils are not suited for crop production without fertilizers, amendments, and proper drainage.
- Muck soils: These soils are distinctly black in color, with 20–80% organic matter content. They are typically found south of Lake Okeechobee.
- Soils with high pH: These soils are common in southwest Florida near the Immokalee area. The pH range in these soils is 7–8.5 because of excess application of lime and naturally occurring CaCO3 below the soil surface.
- Soils that have been intensively cropped and heavily fertilized with macronutrients.
Tabulated Nutrient Functions and Deficiency Symptoms
Table 1 represents all the essential nutrient functions in plant development and metabolism. The mobility of each nutrient within the plant determines the location on the plant where the first symptoms of that specific nutrient deficiency will appear. For example, nitrogen deficiency appears on older leaves first because it is mobile, and the plant defense system protects young leaves. Similarly, soil mobility influences whether the nutrient tends to leach or runoff. However, because many Florida soils have very low capacity to retain nutrients, some elements such as phosphorus and potassium that would be considered immobile in soils with higher clay content can actually move through Florida sands with low clay and organic matter percentages. This is an environmental concern in the case of phosphorus when P applications exceed the soil’s capacity to retain P, and excess P can then move into the drainage water. Additionally, potassium can be leached in Florida sands. As with nitrogen, the timing of fertilizer applications is important to meet crop demand. It is important to consider how nutrients are retained and how they can move in Florida soils.
Table 1. Essential elements required by plants. Source: Hochmuth et al. (2018).
Soil pH is an important chemical characteristic that determines the availability of soil nutrients for plant roots to absorb. The ideal soil pH for availability of most nutrients is 6.5. However, with different pH ranges in Florida, one strategy to manage nutrients may not be useful for the entire state. Therefore, when possible, producers need to maintain their soil pH in the ideal range to get the maximum benefit of their applied fertilizers. Figure 2 explains the availability of different fertilizers across different pH ranges.
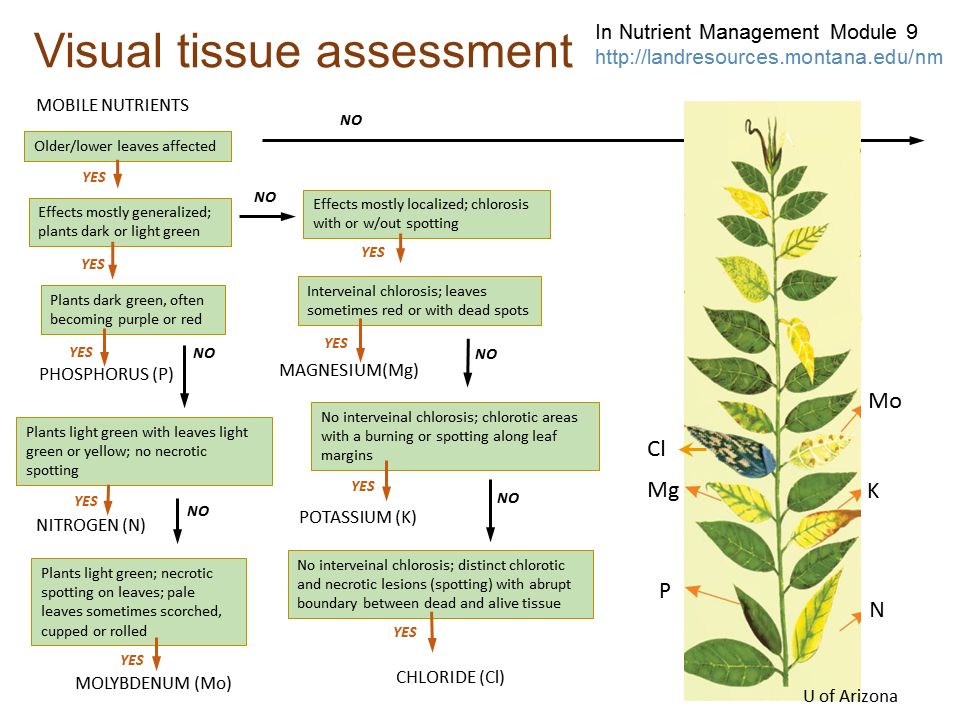
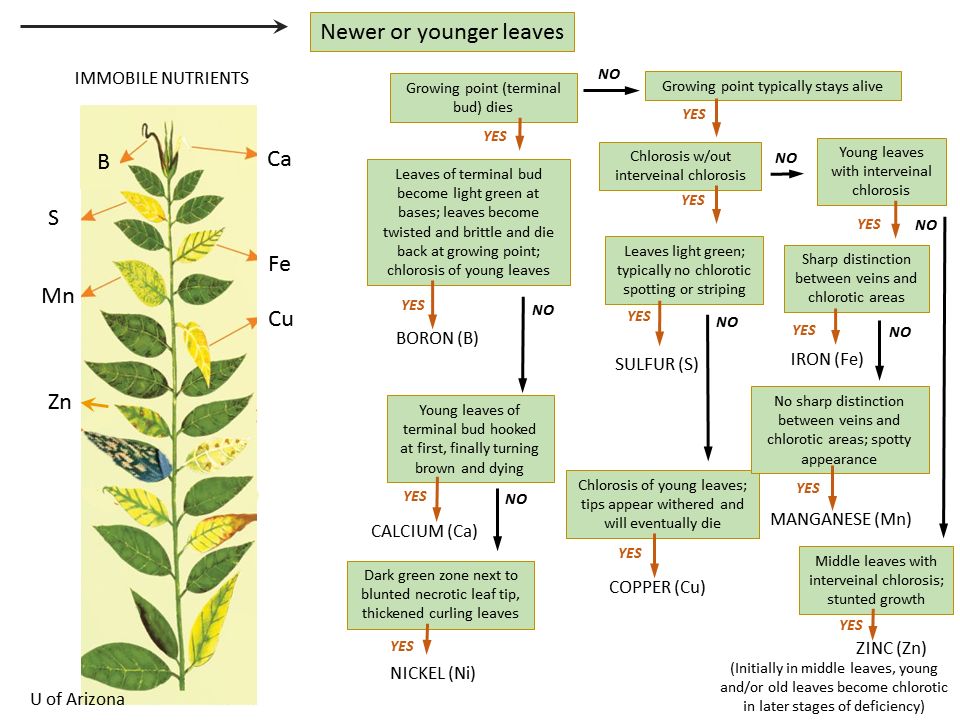
It is very important to diagnose nutrient deficiency in crop plants. Each nutrient has specific deficiency symptoms, and visual analysis could help growers learn a lot about plant health. It is recommended that once the plant shows any deficiency symptoms, a representative tissue sample should be collected for lab analysis to confirm a deficiency. Figures 3 and 4 represent the nutrient deficiency of major and minor essential nutrients, respectively.

Credit: McCauley et al. (2011)

Credit: McCauley et al. (2011). Courtesy of Montana State University
References
Hochmuth, G. J., D. Maynard, C. Vavrina, E. Hanlon, and E. Simonne. 2018. “Plant Tissue Analysis and Interpretation for Vegetable Crops in Florida.” HS964. Gainesville: University of Florida Institute of Food and Agricultural Sciences. https://edis.ifas.ufl.edu/ep081
International Plant Nutrition Institute (IPNI). n.d. “Managing Nitrogen.” Nitrogen Notes Number 1. http://www.ipni.net/publication/nitrogen-en.nsf/0/B83A9B5E76ACF78585257C13004C61A3/$FILE/NitrogenNotes-EN-01.pdf
Lehnert, N., G. Coruzzi, E. Hegg, L. Seefeldt, and L. Stein. 2016. NSF Workshop Report: Feeding the World in the 21st Century: Grand Challenges in the Nitrogen Cycle. Arlington, VA: National Science Foundation. No longer available online.
Magdoff, F. R., C. Hryshko, W. E. Jokela, R. P. Durieux, and Y. Bu. 1999. “Comparison of Phosphorus Soil Test Extractants for Plant Availability and Environmental Assessment.” Soil Science Society of America Journal 63:999–1006. doi:10.2136/sssaj1999.634999x.
Mahler, R. L. 2004. “Nutrients Plants Require for Growth.” CIS 1124. University of Idaho Extension. https://www.extension.uidaho.edu/publishing/pdf/cis/cis1124.pdf
McCauley, A., C. Jones, and J. Jacobsen. 2011. “Plant Nutrient Functions and Deficiency and Toxicity Symptoms.” Nutrient Management Module No. 9. https://apps.msuextension.org/publications/pub.html?sku=4449-9
Uchida, R. 2000. “Essential Nutrients for Plant Growth: Nutrient Functions and Deficiency Symptoms.” In Plant Nutrition Management in Hawaii’s Soils, Approaches for Tropical and Subtropical Agriculture. 31–55. https://www.ctahr.hawaii.edu/oc/freepubs/pdf/pnm3.pdf