Cotton is a tropical crop and one of Florida's most important row crops. Plant growth regulators (PGRs) have been vital to contemporary cotton production for almost four decades. They regulate plant height and crop canopy, which improves foliar spray coverage, reduces fungal disease incidence, and enables mechanical picking of cotton. PGRs are plant hormones that regulate plant growth and development by affecting plant height, canopy growth, leaf area, stem, and internode length. The use of synthetic PGRs is essential for controlling cotton growth, because naturally occurring PGRs, such as auxins, gibberellins, and cytokinins, only have a limited effect on cotton plant growth, development, and reproduction. This article aims to inform cotton producers, Extension agents, crop advisors, and consultants about the role and management approaches of PGRs in cotton production.
Determining the Need for PGR Application
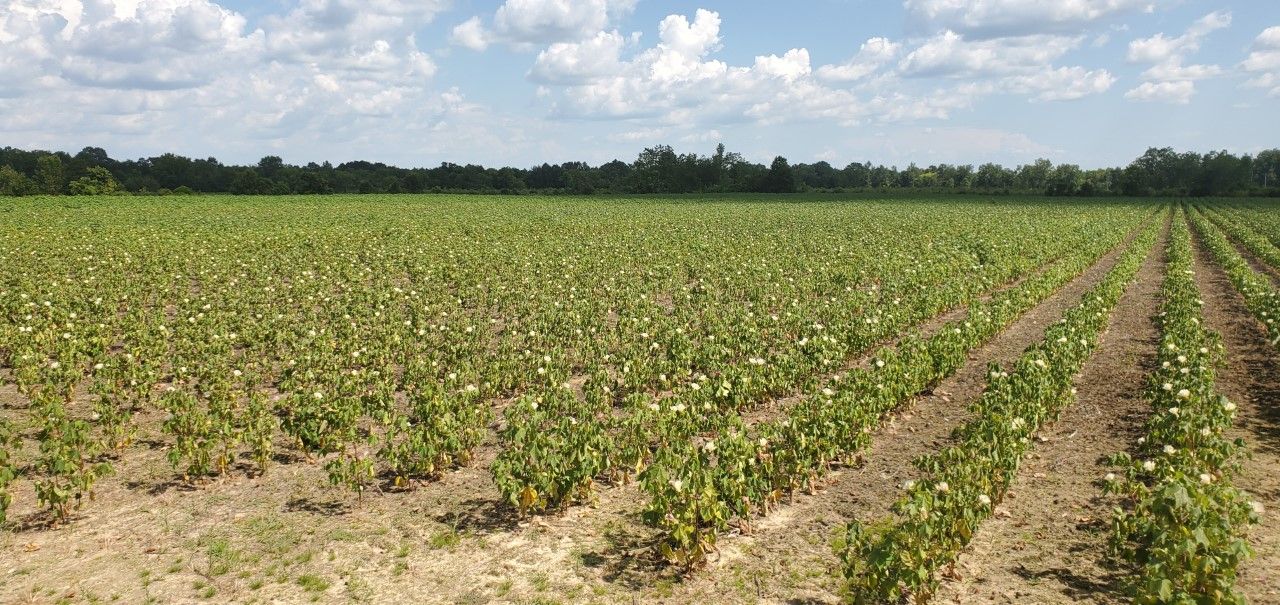
Successful management using PGRs depends on the application timing. Figure 1 illustrates the visual difference between timely PGR applications and delayed PGR applications. For both irrigated and dryland cotton, it is recommended to initiate PGR application prior to bloom. However, lower rates of PGR application prior to bloom are usually more suitable in dryland cotton. Because conditions vary from field to field, farmers can use certain measures and visual indicators to schedule PGR applications. Monitoring of cotton plant growth should begin at least by matchhead square. It is recommended that an initial PGR application be made at nine to ten nodes. One of the effective measures for determining the need for PGR application in the early stage of bloom is the height-to-node ratio (H:N). The H:N is obtained by measuring the height of the cotton plant from the cotyledon node to the terminal and the total number of nodes. For example, if the plant height is 24 inches, and the total nodes are 12, then the H:N ratio is 24/12, which is 2. Table 1 shows how different H:N ratios represent plant growing stages. If the H:N ratio is greater than 2 during early bloom, PGRs should be applied immediately to reduce future plant canopy growth (height) and possibly increase boll retention.

Credit: Steve Brown
Table 1. Determining the need for PGR application based on height-to-node ratio at different growth stages (Adapted from Brown and Sandlin, 2019).
Another method is to count the number of nodes above the first white flower from the top (NAWF). If the NAWF is 8 to 9 or higher during the early bloom period, it is highly recommended to consider PGR application. The NAWF method is also an effective approach to schedule regular PGR applications. However, the desired NAWF decreases as the bloom period progresses. For instance, even 5–6 NAWF is high in mid- or late bloom and requires PGR application (Byrd 2019).
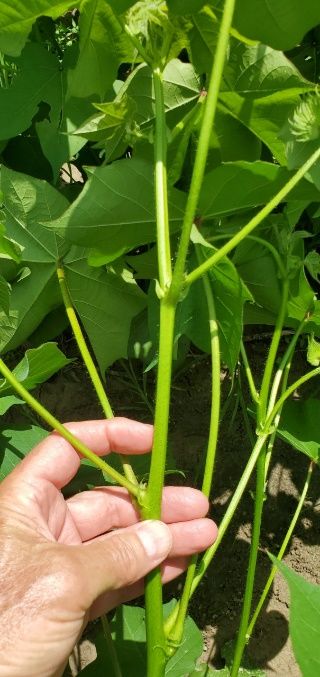
Additionally, the length of the fourth and fifth internodes from the plant terminal reflects the growing potential of the plant. The greater the length of the fourth or fifth internode, the more vigorously the plant grows (Figure 2). This measurement is effective when determining subsequent applications after the first PGR application. An internode length of 2.5 inches to 3 inches indicates the need for a PGR application. Another simple way to evaluate whether a PGR application is necessary is seeing if three or more fingers can fit between the fourth and fifth nodes (Kruse 2012).

Credit: Steve Brown
The timing of PGR applications in dryland cotton requires a more thorough evaluation than in irrigated cotton. Improperly timed applications or excessive rates of PGRs can overstress plants, restrict growth, and negatively affect yield. For instance, the combination of PGR applications and prolonged drought can cause stunting and yield reduction (Figure 3). Consider the 7-to-10-day weather forecast when applying PGRs to avoid application in a dry spell.

Credit: Steve Brown
Mepiquat chloride (MC), known by the trade name Pix, is the most common PGR used in cotton. Since its registration by BASF Chemical Company in 1980, Pix has had a long history of use in cotton PGRs. Although there are several generic versions and similar mepiquat products available, growers often refer to Pix when discussing PGRs in cotton. Since other products contain the same active ingredient and research typically indicates similar performance, the term MC will be used broadly in this publication to refer to the use of PGRs in cotton.
Mode of Action: Mepiquat Chloride
Mepiquat chloride hinders the production of the gibberellin growth hormone in cotton, which is responsible for cell expansion. MC results in decreased leaf area and shorter stem internodes, but it does not affect cell division. However, the application of MC can increase chlorophyll content, which makes the leaves appear dark green. Depending on the timing and rate of applications, MC can have positive or negative impacts on cotton growth and development. MC stimulates plants to transport carbohydrates from leaves to reproductive parts of the plant. The early translocation of sugars into reproductive parts can result in early cutout (i.e., the end of the bloom stage), which can limit overall plant growth and negatively affect cotton development. Earliness is a more important consideration in northern states of the US Cotton Belt, such as Missouri, Arkansas, Virginia, and Tennessee, while stress endurance is typically more important in the lower Southeast including Florida, which has a considerably longer growing season. Effective MC application results in shorter plants with a more compact canopy and helps fruit retention due to carbohydrate translocation. The reduction in plant canopy improves light and air penetration into the lower canopy and thereby tends to decrease boll rot, enhance foliar spray coverage, and improve harvest efficiency (Fromme 2019). Observed yield increases with MC are often associated with these factors (Brown and Sadlin 2019).
Factors Determining the Mepiquat Application Rate
The application rate of MC varies with irrigation, prevailing weather, variety, growth stage, application frequency, and fertility. While there are many approaches to MC use, 8 oz/acre (0.34 oz a.i./acre) is a common rate at or just prior to first bloom, followed by 16 oz/acre (0.68 oz a.i./acre) two weeks after the first application. However, different factors should be considered before determining application rates. The left column of Table 2 lists factors that promote vegetative growth and require higher doses of MC, while the right column lists factors that restrict plant growth and, therefore, require lower doses. Application rates also differ for different MC products and formulations (Table 3).
Table 2. Factors to be considered for mepiquat rate adjustment.
Table 3. Mepiquat products, rates, and considerations for application.
Different Approaches for Mepiquat Applications
PGR use usually involves multiple applications. Below are two approaches to MC use.
Low-Rate Multiple Strategies (LRM)
Low-rate multiple strategies are multiple low-dose applications of MC initiated at the squaring stage, with subsequent applications based on crop growth rate. LRM is a conservative approach in which plant growth is slow and incrementally restricted, with MC applications discontinued in potentially damaging stress conditions. In this approach, multiple applications (up to 4) are made at 2–4 oz/acre (0.09–0.17 oz a.i./acre) for each application (Stevens 2020). Application rate and timing are determined by crop growth and growing conditions. LRM can be cost-effective in case crop growth is restricted naturally, such as in dryland cotton production. Additionally, the LRM approach might be more effective for PGR applications in dryland/rainfed conditions.
Plant Monitoring Approach
This approach is more sophisticated than the LRM strategy and requires a proper management plan and plant mapping. This approach establishes a desired plant height and expected number of nodes. After that, an MC threshold is calculated by dividing the desired plant height by the expected number of nodes. Next, plant height is measured and the number of nodes at or after the square stage is recorded. For precise measurements, choose 10 locations in the field and take 5 plants from each location. Then, divide plant height by the number of nodes to determine the height-to-node ratio and compare it to the MC threshold (Stevens 2020). If the quotient exceeds the threshold, then an MC application is recommended. The application rate is lower at the square stage and 8 oz/acre (0.34 oz a.i./acre) at early bloom.
Take-Home Messages
- Mepiquat chloride is a growth regulator that controls plant growth and aids in the management of cotton height, resulting in a compact canopy, greater fruit retention, reduced boll rot, enhanced foliar spray coverage, and enhanced mechanical harvest.
- The need for MC applications can be determined by looking at the H:N ratio, the fourth and fifth internode length, and/or NAWF.
- For applications of MC in dryland cotton, at least 7–10 days of weather forecast should be considered to avoid potential negative impacts of plant stress (i.e., from a dry spell).
- The common application rate for MC is 8 oz/acre (0.34 oz a.i./acre) at or prior to the bloom stage, followed by 16 oz/acre (0.68 oz a.i./acre) two weeks after the first application. However, rates vary depending on growth factors such as disease incidence, growing conditions, water availability, and nitrogen applications.
- Two different approaches for MC application include the LRM and the plant monitoring approach. In LRM, multiple applications at low rates are used, while in the plant monitoring approach, the MC threshold is established by dividing the desired plant height by the expected number of nodes with applications made accordingly.
- The timing of applications plays a major role in the success of MC in cotton. Mepiquat chloride can positively or negatively affect cotton depending on how and when it is used in the crop.
References
Brown, S., and T. Sandlin. 2019. “How to Think about Cotton: Plant Growth Regulators.” Accessed December 23, 2022. https://www.aces.edu/blog/topics/crop-production/how-to-think-about-cotton-plant-growth-regulators/
Byrd, S. 2019. “Plant Growth Regulators in Cotton.” https://extension.okstate.edu/fact-sheets/plant-growth-regulators-in-cotton.html
Fromme, D. 2019. “Suggested Guidelines for Plant Growth Regulator Use on Louisiana Cotton.”
Kruse, J. 2012. “Cotton PGR Management Just around the Corner.” https://www.lsuagcenter.com/profiles/lblack/articles/page1555428081101
Stevens, G. 2020. “Plant Growth Regulators for Cotton.” https://extension.missouri.edu/publications/g4258#:~:text=Pix%20%28Mepiquat%20Chloride%29%20is%20the%20first%20plant%20growth,frequently%20used%20in%20the%20major%20cotton%20growing%20areas