This publication is adapted from Boldt, N. C., C. R. Engle, J. van Senten, E. J. Cassiano, and M. A. DiMaggio. 2022. “A Regulatory Cost Assessment of Ornamental Aquaculture Farms in Florida.” Journal of the World Aquaculture Society. DOI: 10.1111/jwas.12881
Introduction
Florida’s diverse ornamental aquaculture industry has many unique challenges that set it apart from other aquaculture commodity groups. The numerous production techniques, diversity of species, and various market outlets make the ornamental aquaculture industry an intriguing study in how regulations impact the industry. A study was conducted to measure the impact of regulations on ornamental aquaculture farms in Florida using on-farm data from 2018. All ornamental farms in the state were contacted and results covered 82% of the industry with a response rate of 41% of farms. This publication discusses the results of that study and the regulatory burden that the ornamental aquaculture industry in Florida endures. It is intended for aquaculture producers, aquaculture regulatory agencies, government officials, and the general public interested in aquaculture economics. The data presented in this publication are aimed at identifying the regulatory costs placed on ornamental aquaculture producers in Florida with the intent of streamlining regulatory processes to increase profitability for farmers.
Survey Results
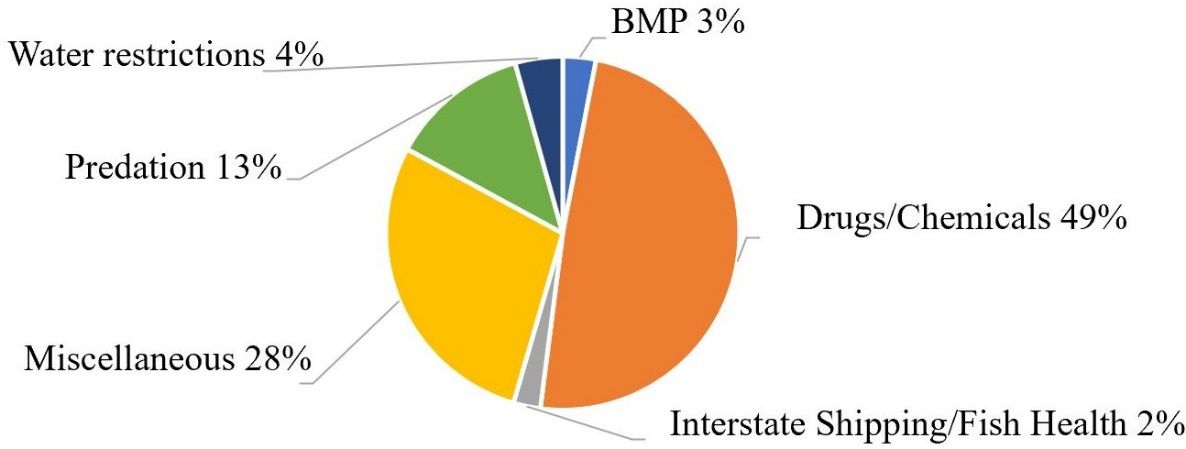
Total on-farm regulatory costs were $5.2 million across the industry and averaged $173,135 per farm in 2018. The top regulatory categories that contributed the most to total regulatory costs were 1) restrictions on beneficial drugs and chemicals for non-foodfish (49%); 2) miscellaneous regulations (primarily those pertaining to insurance compliance and building codes; (28%); and 3) regulations impacting predator control (13%; Figure 1).

Credit: undefined
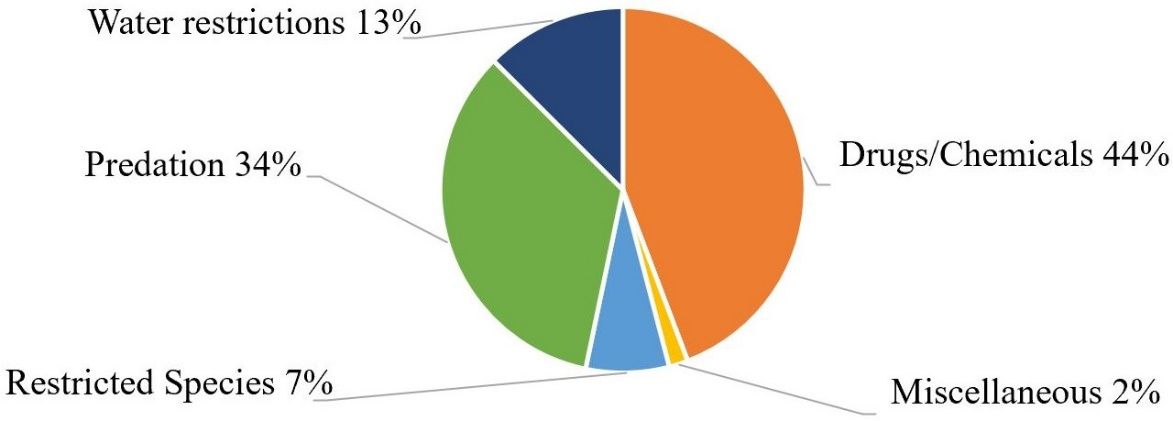
In addition to the costs incurred as a result of regulations, the value of lost production due to regulations was $23.2 million industry-wide and averaged $774,063 per farm. Regulatory categories that contributed the most to the value of lost production included: 1) restrictions on beneficial drugs and chemicals for non-foodfish (44%); 2) regulations impacting predator control (34%); and 3) regulations restricting access to water (13%; Figure 2).

Credit: undefined
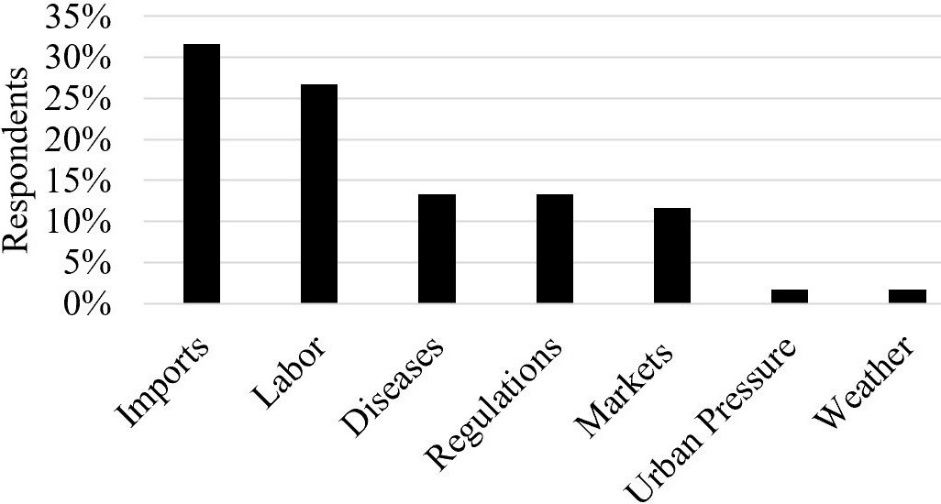
Respondents ranked regulatory costs as the 4th greatest challenge facing their business, following import pressure (32%), finding affordable, consistent, and/or quality labor (27%), and disease management (13%) (Figure 3). When asked to rank regulatory issues, 37% of participants indicated that interstate and international shipping was the most burdensome, followed by access to water (33%) and the restriction of beneficial drugs and chemicals for non-foodfish (27%) (Table 1).

Credit: undefined
Table 1. Top two regulatory burdens for ornamental aquaculture farms in Florida.
Farms were grouped by annual sales in order to analyze any size effects in terms of the regulatory costs and value of lost production. Small farms had less than $100,000 in annual sales, medium farms between $100,000 and $500,000, large farms between $500,000 and $2 million, and extra-large farms had annual sales greater than $2 million. As farm size increased, total regulatory costs increased. However, the average percent contribution of these costs to farm total sales decreased as farm size increased (Table 2). A similar trend was observed when analyzing the impact of the value of lost production due to regulations on farm size. The value of lost production increased as farm size increased, but the percentage of costs to total sales decreased as farm size increased. Thus, the regulatory costs were found to account for a much greater cost on smaller as compared to larger farms. The disproportionately greater negative economic effects from regulatory compliance on smaller aquaculture farms have been found in all regulatory cost studies completed as of the time this publication was written.
Table 2. A comparison of farm size to regulatory costs.
Summary
The regulatory costs observed in the ornamental aquaculture industry in Florida are three times lower than those found in the salmonid and baitfish/sportfish industries. However, the value of lost production measured in the ornamental industry was five times higher than the industries previously mentioned. Thus, attention in the ornamental industry needs to be focused on removing barriers to production not only to reduce lost revenue, but also to allow farms to grow so producers can take advantage of economies of scale. Florida’s relatively low regulatory costs may provide evidence that the regulatory environment in Florida is not as burdensome as it is in other states. (Florida was not included in any other regulatory cost studies completed at the time of this publication.) While this relatively light regulatory burden may have to do with industry characteristics such as small scale of production and a non-food product, Florida has one agency as the primary regulatory body in the state, the Florida Department of Agriculture and Consumer Services Division of Aquaculture. This single-agency model has helped to streamline the regulatory process and provides farmers with a resource if they have any regulatory issues.
Some practical solutions to reduce the regulatory burden in ornamental aquaculture include state and federal support for the approval of beneficial drugs and chemicals, creating more adaptive and expansive management options for controlling predators, and developing risk-based regulations that allow for the culture of some restricted species in an environmentally responsible manner. All these approaches would reduce unnecessary operating costs and allow farmers to increase production, leading to the overall growth of the domestic industry.
Recommended Readings
Engle, C. R., J. van Senten, and G. Fornshell. “The Effects of Regulations on the U.S. Salmonid Industry: National Findings.” Western Regional Aquaculture Center. WRAC Fact Sheet National 8-20-19.Pdf (Washington.Edu)
Infographics Addressing the Effects of Regulations on US Aquaculture Industries:
US Salmonid Industry: National_4set_color (vt.edu)
US Pacific Coast Shellfish Industry: SHELLFISH_infographics_02.06.2021 copy (vt.edu)