Abstract
Key and Tahiti limes have historically been very important to the economy of south Florida. However, few commercial orchards for these lime cultivars are left in the state. Many orchards were destroyed during Hurricane Andrew, and those that survived were then eliminated by Florida’s Citrus Canker Eradication Program in the late 1990s and early 2000s. Tahiti limes are being considered for reintroduction in Miami-Dade County because of the growing demand for this fruit, especially among buyers who are willing to pay more for Florida-grown fruit. In this publication, we explore the history of lime production in south Florida and current trends in the market, especially growing demand in the United States for Tahiti limes. However, the price premiums from the growing domestic market for Tahiti limes would likely not be enough to overcome the challenges growers face in combating the disease pressure from citrus canker and citrus greening, or huanglongbing (HLB), as well as intense competition from Mexico. In fact, under current market and growing conditions, growers would be expected to lose $27 per Tahiti lime tree unless solutions are found to combat these diseases.
Introduction
Lime production has a long history in south Florida; it has been very important to the economy of the region. There are two main lime cultivars that have been grown in south Florida, Key limes (also known as Mexican limes) and Tahiti limes (also known as Persian limes). Key lime fruits are small—1 ½ to 2 inches in diameter. The pulp is greenish yellow, juicy, and highly acidic with a distinctive aroma (Crane 2020a). Tahiti limes, on the other hand, are larger. They are oval, 2 ¼–2 ¾ inches in length, 1 7/8–2 ½ inches in diameter, and weigh about 1.9 oz (54 g). When Tahiti limes are grown in monoculture orchards, the fruit is seedless. They may produce a few seeds when planted with other citrus species. Fruit acid content for Tahiti limes is between 5% and 6%, soluble solids make up 8% to 10% of the fruit, and juice content is 45% to 55% by volume (Crane 2020b). In terms of market share, Tahiti limes account for nearly all the fresh limes sold in the US market, about 90% of all limes (Plattner 2014).
Key limes acquired their common name from the Florida Keys. Although they are native to South Asia, they were introduced in the Florida Keys in 1838 and became naturalized there. In the late 19th century through the turn of the 20th century, a small commercial Key lime industry was active in the Florida Keys. However, the Great Miami Hurricane in 1926 destroyed most of the trees, and commercial production never fully recovered (Robinson 1942; Sloan 2019). Now, commercial production of Key limes takes place outside of the US. Mexico and Brazil are the main global producers.
Tahiti limes were first introduced to the US in 1875. By 1883, Tahiti lime production was expanding in Florida. When Tahiti limes were first introduced to US markets, they were referred to as Persian limes. By the 1930s, the major production area of Tahiti limes was concentrated in Miami-Dade County. Florida was the main supplier of Tahiti limes in the US until 1992 when Hurricane Andrew hit south Florida. This natural disaster was followed by the implementation of the North American Free Trade Agreement (NAFTA) in 1994, which led to direct competition from lower priced Tahiti limes from Mexico. This influx of supply led to Tahiti lime market prices becoming unattractive for south Florida growers. The trade agreement was followed by the appearance of citrus canker in Miami-Dade County in 1995. The state of Florida responded to this disease by creating the Citrus Canker Eradication Program (CCEP), which led to the removal of all lime trees in the county by 2003.
Because of the economic importance that Tahiti limes had to Miami-Dade County (before Hurricane Andrew, they would be valued at $53 million in 2022 dollars), and because of growing consumer demand for the product, which nearly doubled in the last decade, interest has been growing to reintroduce Tahiti limes in the county (Evans et al. 2014; USDA ERS 2021). The question is whether Tahiti lime production could now in the early 2020s be profitable for Florida growers. This publication provides an historical overview of the Florida Tahiti lime industry and an analysis of trends in imports, consumption, and prices. We conclude with a discussion of some of the challenges for the reactivation of the industry and potential economic viability. The information presented in this publication would be useful not only to citrus growers in south Florida who are interested in alternative cropping opportunities but also to citrus processors, as well as anyone interested in sourcing limes from south Florida, for instance, the retail sector and the hospitality industry in Florida and throughout the United States.
Tahiti Lime Production
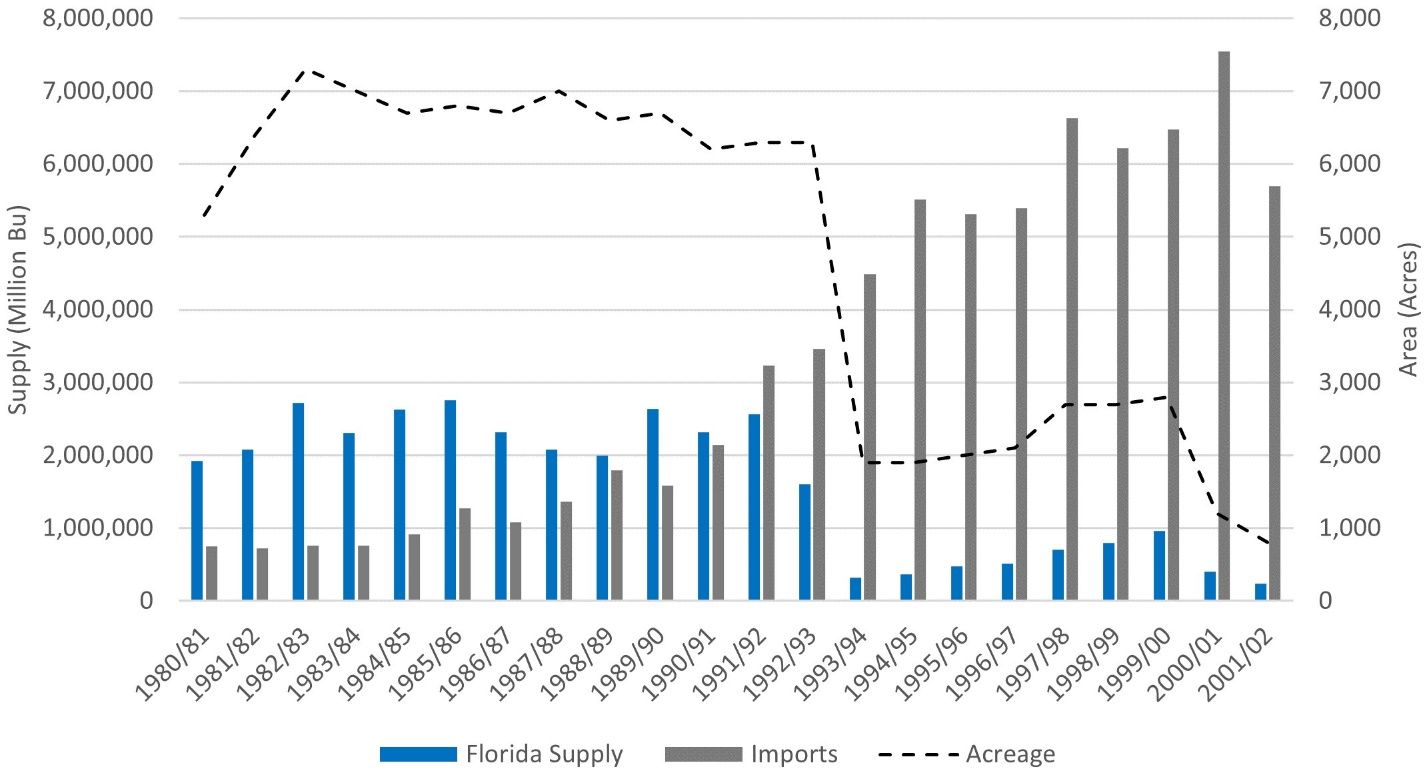
The Florida lime industry was expanding during the early 1980s when fruit-bearing acreage increased by 38% from 5,300 acres in the 1980–1981 growing season to 7,300 acres in the 1982–1983 season (Figure 1). Tahiti lime production area was 6,300 acres in the 1992–1993 season, 14% below its peak, when Hurricane Andrew, a very powerful category 5 storm, struck the primary agricultural production area in south Miami Dade County in August 1992. The hurricane destroyed about 70% of the production area. Only 1,900 acres were left standing.
The Tahiti lime industry was not able to recover before it was hit with citrus canker. In September 1995, citrus trees infected with citrus canker were found in a residential neighborhood near the Miami International Airport. The state implemented an aggressive control program with the objective of protecting the economically important orange and grapefruit industries in central Florida. It initially targeted residential citrus, hoping to eradicate it before the disease moved to commercial groves. Despite all the efforts to contain the disease, it eventually spread to the main production area in south Miami-Dade County in 1999. By this time, the industry had partially recovered from Hurricane Andrew with 2,800 acres dedicated to Tahiti lime. The state government mandated that all infected citrus trees and all citrus trees exposed to the disease, including limes, be destroyed. The Florida Department of Agriculture and Consumer Services destroyed any healthy citrus tree found within a mile of an infected tree (Shubert et al. 2001). Official data collection about the Florida lime industry ended in the 2002–2003 season, as all the commercial Tahiti limes in south Florida had been removed.
Before Hurricane Andrew, Florida was the main supplier of Tahiti limes in the United States. Florida production fluctuated from a low of 1.9 million bushels in the 1980–1981 season to a high of 2.76 million bushels in the 1985–1986 season (Figure 1). Because of the growing demand for the fruit and the constraints on domestic production, fruit imports outpaced domestic supply in the 1991–1992 season. Even though Hurricane Andrew hit in August 1992, production for that season dropped by 60% compared to the previous year. Because the main harvest season in south Florida is from June to August, a significant volume of the crop had been harvested by the time Hurricane Andrew arrived. The magnitude of the damage was much more evident during the1993–1994 season as production reached just 320,000 bushels, about 14% of the average production between the period of the 1980–1981season and the 1991–1992 season. As a result of the void left by falling Florida production and the growing popularity of the fruit, imports expanded with foreign-grown fruit being the primary product available to US consumers by the mid-1990s. This situation was further exacerbated by NAFTA going into effect in 1994, and then made even worse with the arrival of citrus canker (Spreen 2000; Evans et al. 2014).
Credit: USDA/NASS 2003
US Tahiti Lime Imports
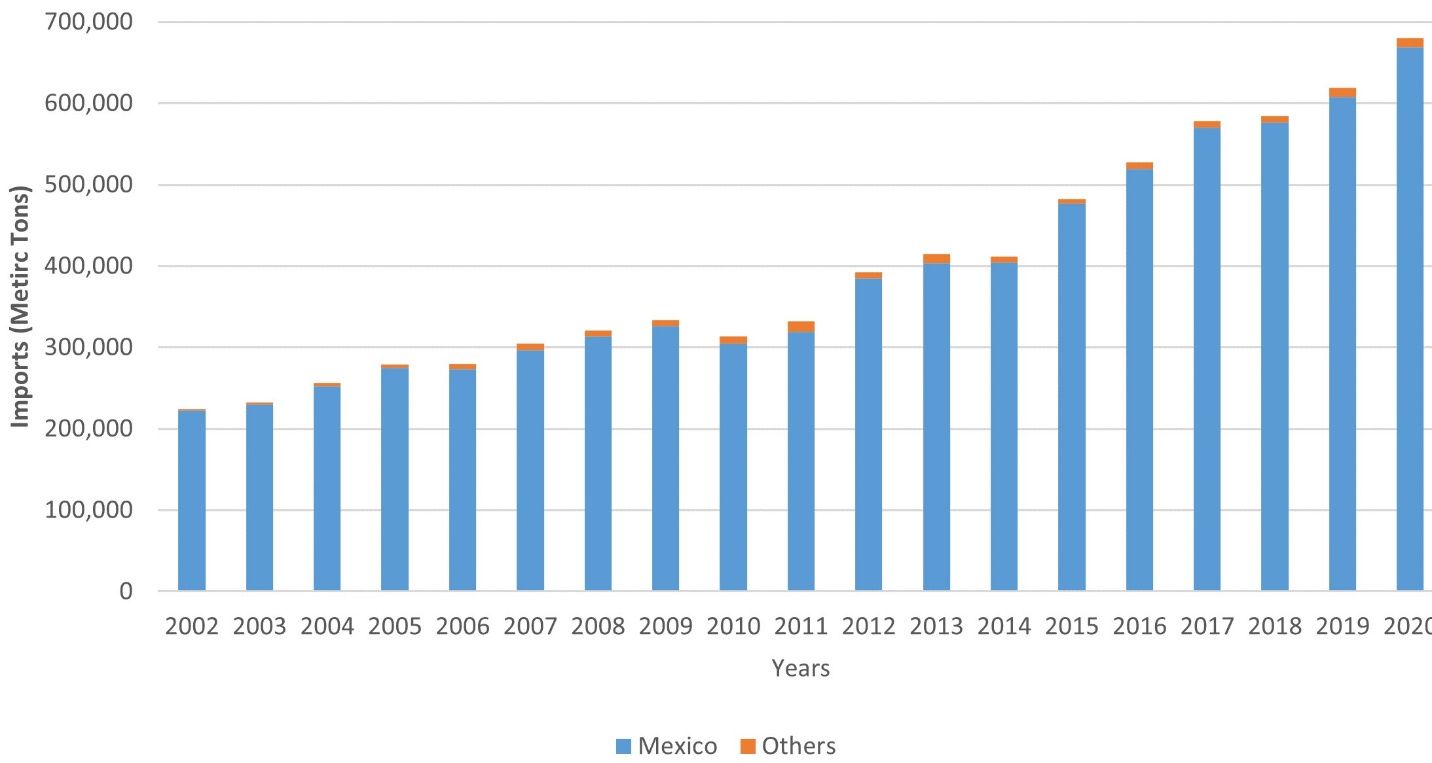
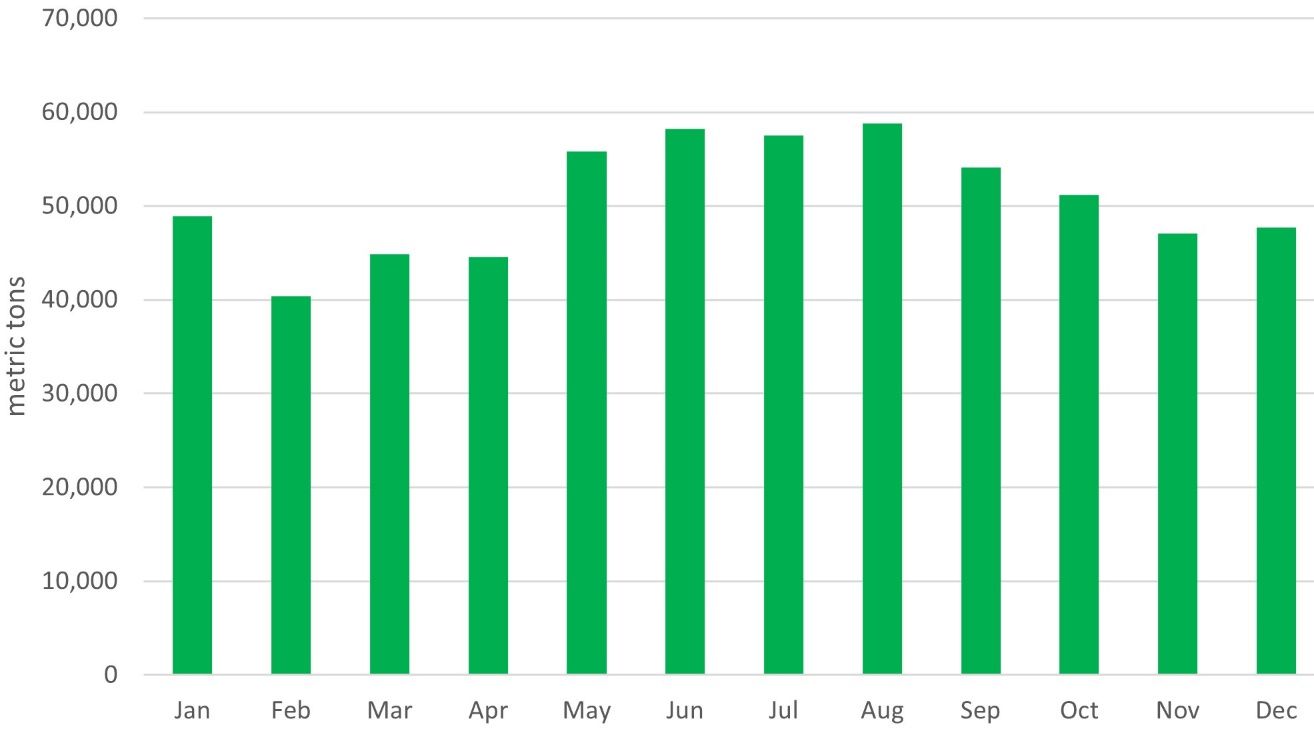
Starting in 2003, the United States depended completely on imports to supply its Tahiti lime market. In the nearly two decades since US production ceased, lime growers in Mexico and other countries outside the United States have done very well in the US market, with fresh lime imports more than tripling between 2002 and 2020. They went from 224,703 metric tons (MT) in 2002 to 680,405 MT in 2020 (Figure 2). Mexico is by far the dominant supplier of the fruit to the United States, accounting for over 98% of the total imports during this period. Fresh lime imports wax and wane in a seasonal pattern with the growing season in Mexico (Hofshi n.d.). This pattern remained consistent through the COVID-19 pandemic (Figure 3). Tahiti lime imports are relatively lower during the winter at the beginning of the year. They are particularly low in February. Between 2016 and 2020, for instance, imports averaged slightly less than 40,000 MT. Imports increase from May to August. Between 2016 and 2020, May imports averaged 55,700 MT, and August imports averaged close to 57,300 MT. Finally, imports reach another low for the season during November. Between 2016 and 2020, imports in November were slightly over 46,000 MT on average (USDA/FAS 2022).
Credit: USDA/FAS (2022)
Credit: USDA/FAS (2022)
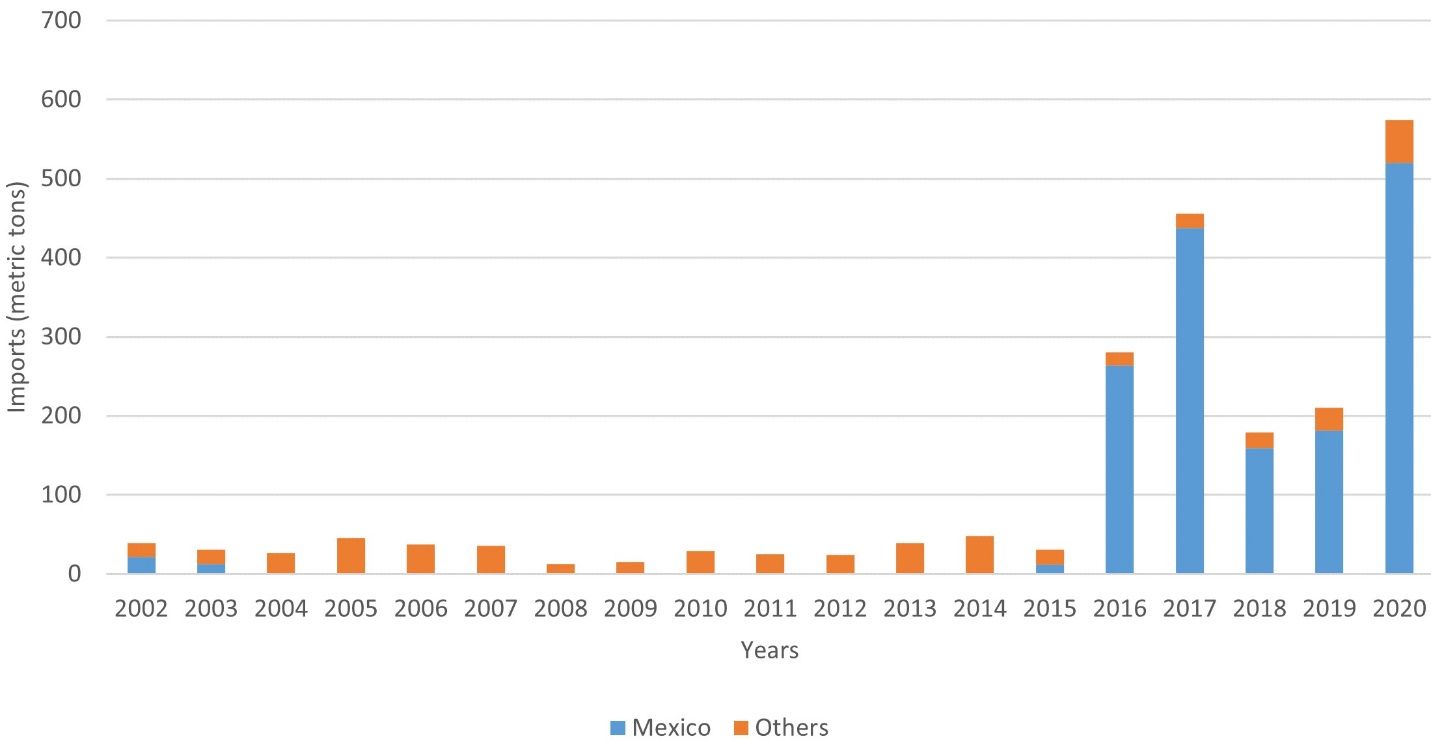
In contrast to imports of fresh limes, imports of processed lime products were stagnant from 2002 to 2015 (Figure 4). Imports of processed lime products, mostly shelf stable lime juice and frozen lime concentrate, fluctuated from a low of 12.6 MT in 2008 to a high of 48 MT in 2014. Since 2016, there has been a noticeable increase in the supply of processed lime products from Mexico, which is now the main source of processed lime products in the United States, about 520 MT in 2020 (USDA FAS 2021). The increase in processed lime imports may be signaling a shift to these value-added products.
Credit: USDA/FAS (2022)
The Great Lime Shortage of 2014 was an exception to the nearly stable markets over the last decade. The shortage started in March 2014. It was the result of a combination of adverse weather events, the arrival of a new plant disease, and supply disruptions. Yields were lower after heavy rains that hit the main lime-producing regions in Mexico. The Mexican state of Colima, one of the main Tahiti lime-producing areas in the country, had even lower production due to an outbreak of HLB. The supply challenges were further exacerbated by criminal gangs that stole fruit from orchards and hijacked shipments bound for the United States. These events resulted in prices for Tahiti limes increasing by 47%. The retail price reached $0.54 in May 2014, compared to just $0.30 a year earlier (Barclay 2014).
Citrus Consumption in the United States
Unlike oranges and grapefruit, for both of which US consumer demand has dropped, Tahiti limes have been growing more popular in the United States. US consumers have been demanding steadily more and more of them over the last decade (Figure 5). Fresh orange and fresh grapefruit consumption declined by 7.3% and 44% respectively between 2010 and 2020. However, consumption of lemons and Tahiti limes has grown consistently year on year. Per-capita consumption of Tahiti limes in the United States remains lower than per-capita consumption of fresh lemons, but it has grown at a faster rate than per-capita consumption of lemons. Tahiti lime per-capita consumption grew by 70% from 2.51 lbs. in 2010 to 4.27 lbs. in 2020, while lemon consumption grew by 43% from 3.47 lbs. to 4.95 lbs. during the same year (USDA/ERS 2021).
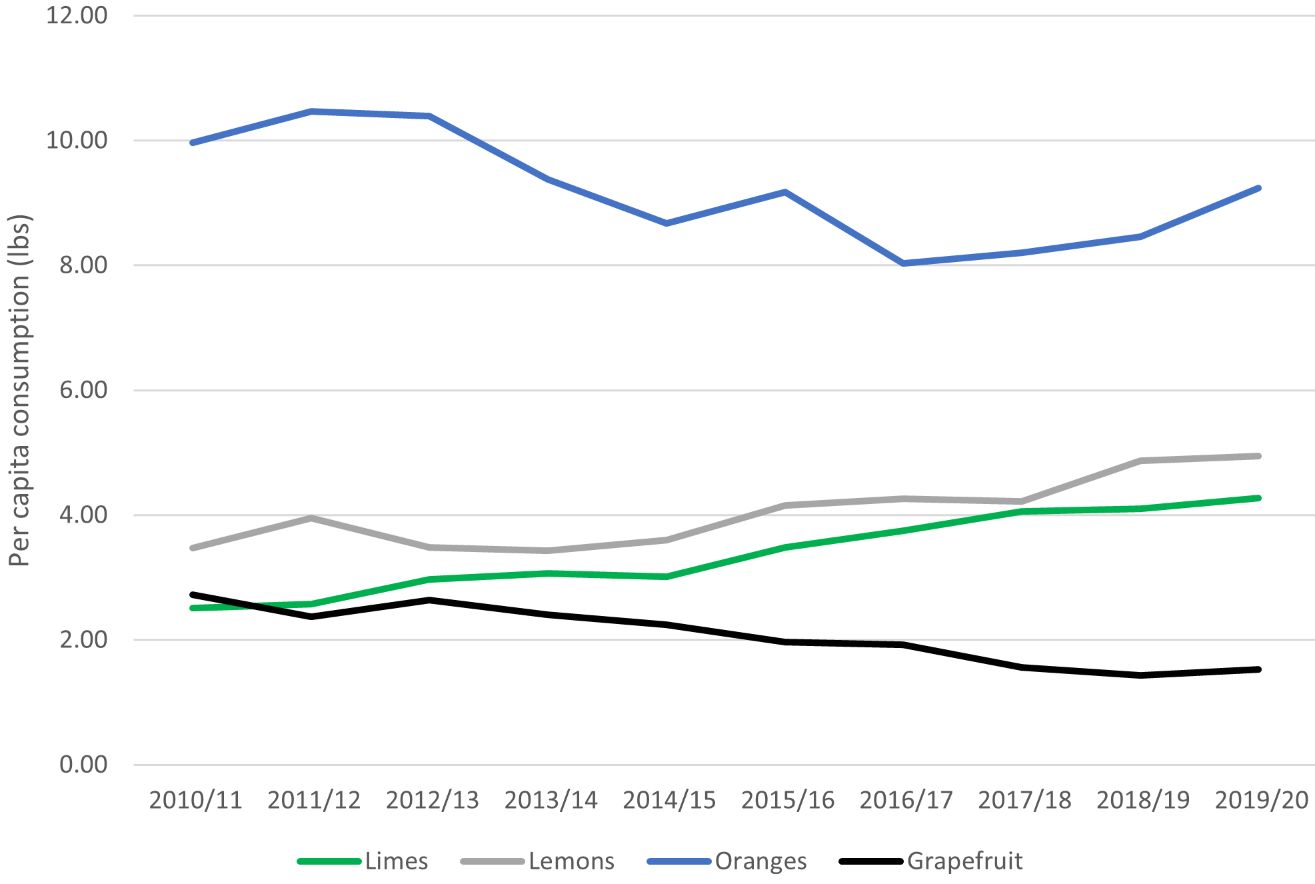
Credit: USDA/ERS (2021)
Growth in fresh Tahiti lime demand could be due to changing US culinary practices. The fruit is used in a variety of foods and beverages, where it enhances the taste of fruits, vegetables, salads, and baked goods, providing a light, fresh flavor. The growing demand for dishes and drinks from Latin America that require limes could be a factor in this growth (Ramirez-Santos 2018). Consumer demand has also been driven by the perceived health benefits of the fruit. According to US Citrus’s 2020 blog post, “Everything You Need to Know About Lime Juice Nutrition,” Tahiti lime juice has benefits for heart health, reduces asthmatic conditions, and promotes healthy skin. To demonstrate the nutritional benefits of Tahiti limes, this fruit of just 44 grams provides 20% of an individual’s daily vitamin C needs. The fruit also contains key minerals, such as magnesium and phosphorus (US Citrus 2020).
Wholesale Tahiti Lime Prices
Consistent with the seasonal pattern of imports, fruit prices also vary widely through the year. For the price analysis, we chose the wholesale markets of Miami and New York City to represent markets for the US East Coast. Tahiti limes are sold under different weight options including 10-lbs, 30-lbs, and 40-lbs cartons. A 40-lbs carton is the most common. So, we based our price analysis on the 40-lbs carton with different sizes of Tahiti limes, 110 limes per carton, 150 limes per carton, 175 limes per carton, and 200 limes per carton. The fewer the number of limes in a box, the larger the limes in that box. Boxes with 110 limes have the largest limes.
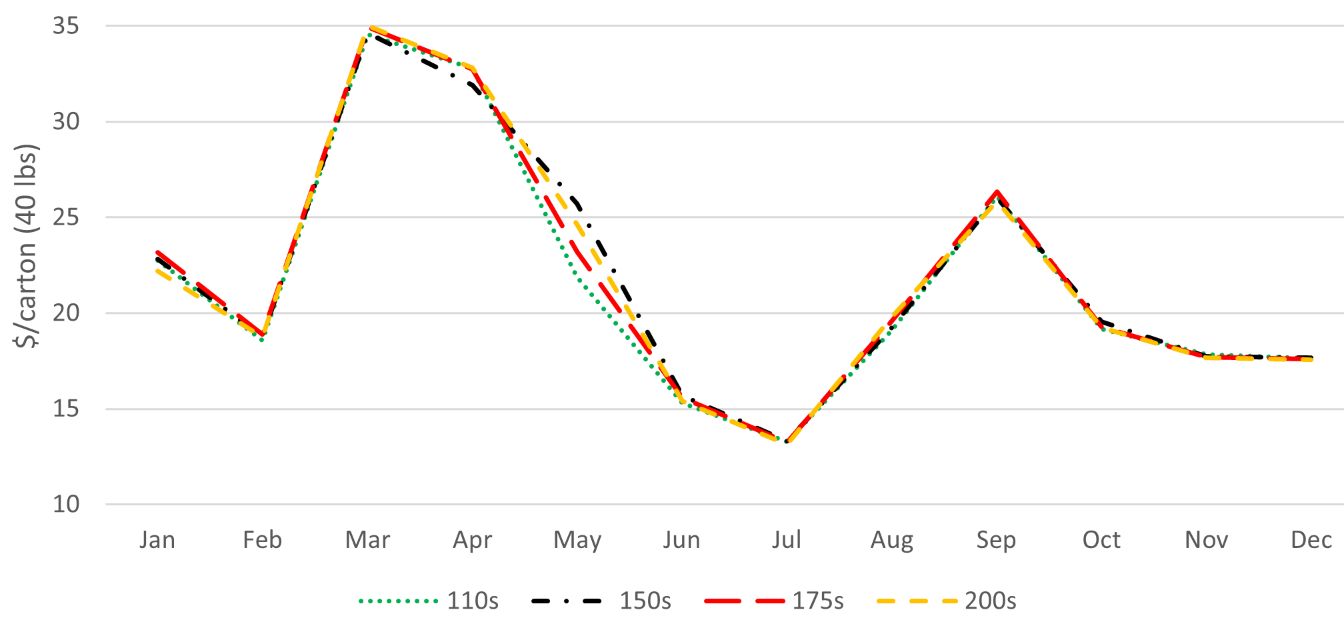
Because there was no noticeable difference in lime prices before and after the COVID-19 pandemic, we took an average of the prices between 2018 and 2020 in the Miami wholesale market to demonstrate the seasonal fluctuation in Tahiti lime prices. This average price reached a high of $35/carton in March, when import volume is low (Figure 6). Average prices fell in the second quarter as fruit imports increased. They continued to fall during July reaching a low of $13/carton. Then, they increased, reaching about $25/carton in November. Finally, average prices fell again during the fourth quarter and reached an average of $14.46/carton in December. The average wholesale price for all the size types was nearly the same, indicating that the market does not provide premiums for larger fruits. The largest variation in price between different sized fruit was in May, when a package of 150 limes reached $25.71/carton and a package of 200 limes was sold at $24.62/carton. The market provided about a 4% premium, $1.09 more per carton, for the larger fruit. (USDA AMS 2021).
Credit: USDA AMS (2021)
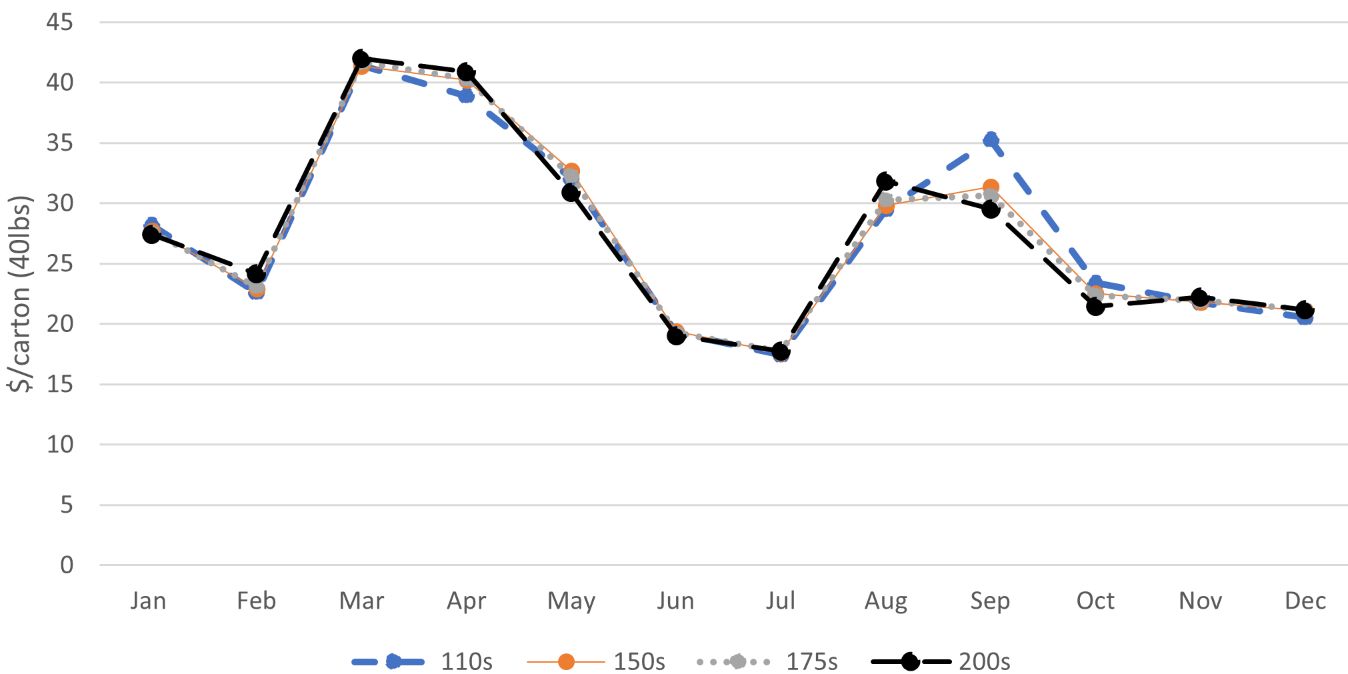
The trends in average prices for 2018 to 2020 in the New York wholesale market mirror those of the Miami wholesale market. However, prices in New York were higher throughout the year compared to the prices received in Miami. Average prices in New York in March reach a high of about $42/carton, the highest of the season, 20% higher than in Miami. Average prices trended downward during the second quarter as imports increased. In April, the 110-lime cartons had an average price of $38.90/carton, while the other size options averaged above $40/carton. During the third quarter, average prices reached a low of about $18/carton in July; then prices started to rise again, and, by September, the 110-lime cartons peaked at $35/carton. Average prices fell during the last quarter. By December, the average price for a 40-lbs carton was $21 (USDA AMS 2021).
Credit: USDA AMS (2021)
Market Outlook
Even after the Florida lime industry was eradicated, citrus canker eventually spread to the main orange- and grapefruit-producing regions in central Florida. Further research later proved that citrus canker was not as devastating as initially thought, due to the establishment of Best Management Practices to mitigate its impact (Dewdney and Johnson 2021). After learning that citrus production even with citrus canker pressure was still possible, there have been some attempts to revive the lime industry in Florida. During the early 2010s a few commercial Tahiti lime acres were planted. However, concerns about the feasibility of the industry remain because growers now must deal simultaneously with two bacterial diseases: citrus canker and HLB. Huanglongbing, which arrived in Miami-Dade County in 2005 (UF/IFAS 2018) and has since became endemic. Even though some progress has been made, finding a new lime cultivar that is economically viable remains an elusive target, as researchers need to come up with a scion and rootstock combination able to handle the combined effect of two aggressive bacterial diseases.
Given the challenges facing the Florida citrus industry, imports will continue to be the main source of Tahiti limes for US markets in the foreseeable future. As of the early 2020s, Mexico was the unchallenged greatest supplier of fresh Tahiti limes to the US market. Fruit exporters in other tropical countries, including nearby Latin American countries, have yet to attempt to compete with Mexico in US markets. This reality is concerning for US consumers and the businesses that supply them. Relying on just one big supplier may have significant consequences when production and supply chain disruptions, such as the Great Lime Shortage of 2014, occur. With national attention being paid to supply-chain challenges generally in the United States since 2019, fruit buyers are likely to seek to diversify their sourcing options. Likely they will not only seek limes from additional international sources but also will continue to support efforts to increase domestic production in Florida.
References
Barclay, E. 2014. “The Lime Shortage: Still Messing With Your Margarita.” NPR’s The Salt: What’s on Your Plate. https://www.npr.org/sections/thesalt/2014/05/05/309073066/the-lime-shortage-still-messing-with-your-margarita
Crane, J. 2020a. “Key Lime Growing in the Florida Home Landscape.” FC47/CH092. EDIS 2020. https://edis.ifas.ufl.edu/publication/CH092
Crane, J. 2020b. “Growing ‘Tahiti’ Limes in the Home Landscape.” HS8. EDIS 2020. https://edis.ifas.ufl.edu/publication/CH093
Dewdney, M., and E. G. Johnson. 2022. “2022–2023 Florida Citrus Production Guide: Citrus Canker.” CPG Ch. 31, CG040/PP-182, Rev. 4/2022. EDIS 2022 (CPG). https://doi.org/10.32473/edis-cg040-2022
Evans, E. A., F. H. Ballen, and J. H. Crane. 2014. “Economic Potential of Producing Tahiti Limes in Southern Florida in the Presence of Citrus Canker and Citrus Greening.” HortTechnology 24 (1): 99–106. https://doi.org/10.21273/HORTTECH.24.1.99
Hasfhi, R. (n.d.). “Hass Cultivation in Mexico.” Production Research Committee (CAC). https://www.avocadosource.com/Journals/AvoResearch/avoresearch_01_03_2001_Hofshi_MEX.pdf
Plattner, K. 2014. “Fruit and Tree Nuts Outlook: Economic Insight. Fresh-Market Limes.” Fruit and Tree Nuts Outlook Special Article/FTS-357SA Economic Research Service, USDA https://www.ers.usda.gov/webdocs/outlooks/37059/49132_fresh-market-limes-special-article.pdf?v=651
Ramirez-Santos, H. 2018. “Statistics behind the Insatiable Appetite for Mexican Food in the U.S.” Absoto. https://abasto.com/en/news/insatiable-appetite-mexican-food-us/
Robinson, T. R. 1942. "Henry Perrine: Pioneer horticulturist of Florida." Tequesta 1 (2): 16–24.
Schubert, T.S., S.A. Rizvi, X. Sun, T. R. Gottwald, J.H. Graham, and W.N. Dixon. 2001. “Meeting the Challenge of Eradicating Citrus Canker in Florida—Again.” Plant Disease 85(4) https://doi.org/10.1094/PDIS.2001.85.4.340
Sloan, D. 2019. “The Rise and Fall of Commercial Key Lime Crops.” Keys Weekly. https://keysweekly.com/42/the-rise-fall-of-commercial-key-lime-crops/
Spreen, T. H. 2000. “The Citrus Industries of the United States and Mexico after NAFTA.” Revista Chapingo Serie Horticultura, 6(2):145–152. https://doi.org/10.5154/r.rchsh.1999.04.029
UF/IFAS Citrus Extension. 2018. “Citrus Greening: History—Greening or Huanglongbing (HLB) Worldwide.” https://crec.ifas.ufl.edu/research/citrus-production/disease-identification/citrus-greening-huanglongbing/
US Citrus. 2020. “Everything You Need to Know about Lime Juice Nutrition.” https://uscitrus.com/blogs/citrus-delight-blog/everything-you-need-to-know-about-lime-juice-nutrition
USDA/AMS. 2021. “Fruit & Vegetables Market News.” United States Department of Agriculture, Agricultural Marketing Service, Washington, D.C. https://www.marketnews.usda.gov/mnp/fv-report-config-step1?type=termPrice
USDA/ERS. 2021. Fruit and Tree Nuts Yearbook Tables: Supply and Utilization (Table G-36). United States Department of Agriculture, Economic Research Service, Washington, D.C. https://www.ers.usda.gov/data-products/fruit-and-tree-nuts-data/fruit-and-tree-nuts-yearbook-tables/
USDA/FAS. 2021. Global Agricultural Trade System. United States Department of Agriculture, Foreign Agricultural Service, Washington, D.C. https://apps.fas.usda.gov/GATS/ExpressQuery1.aspx
USDA/NASS. 2021. Citrus Summary. United States Department of Agriculture, National Agricultural Statistics Service, Washington, D.C. https://www.nass.usda.gov/Statistics_by_State/Florida/Publications/Citrus/Citrus_Summary/