Abstract
This publication provides a summary of the economic contributions of the citrus industry in the state of Florida during the 2020–2021 citrus marketing year. Additional details on the data sources, methodologies, and results are published in the most recent report on the economic contributions of the citrus industry in Florida from the University of Florida, Institute of Food and Agricultural Sciences (UF/IFAS) Economic Impact Analysis Program. The information in this publication is intended to be used by individuals working in the citrus industry, representing the citrus industry, or governing the citrus industry in support of informed decision making related to the citrus industry.
Florida’s Citrus Industry
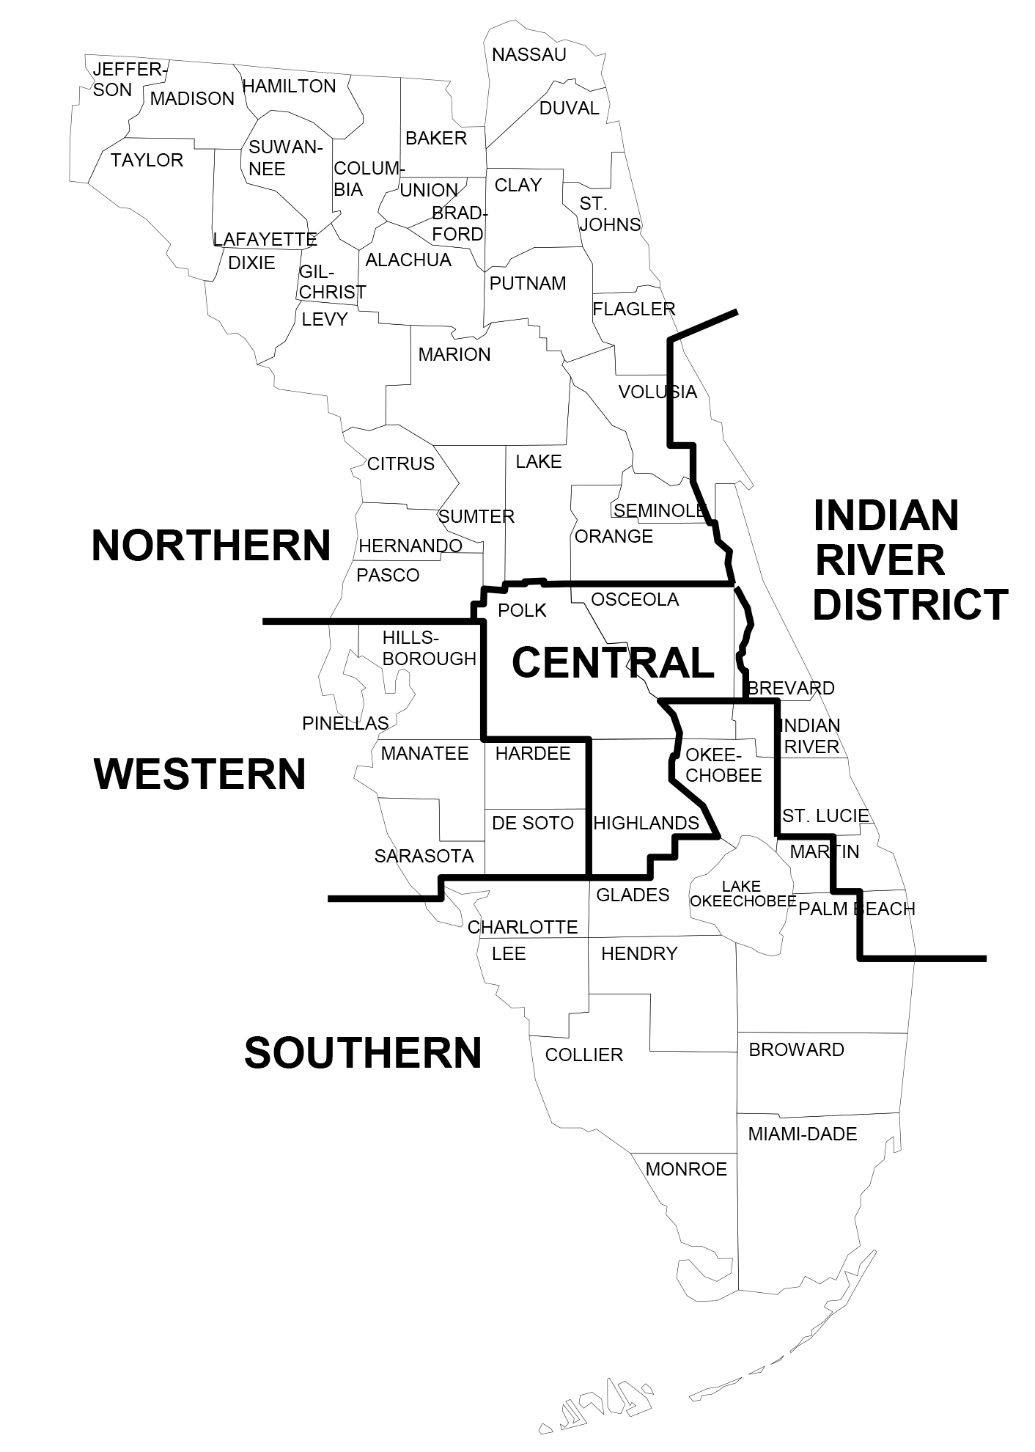
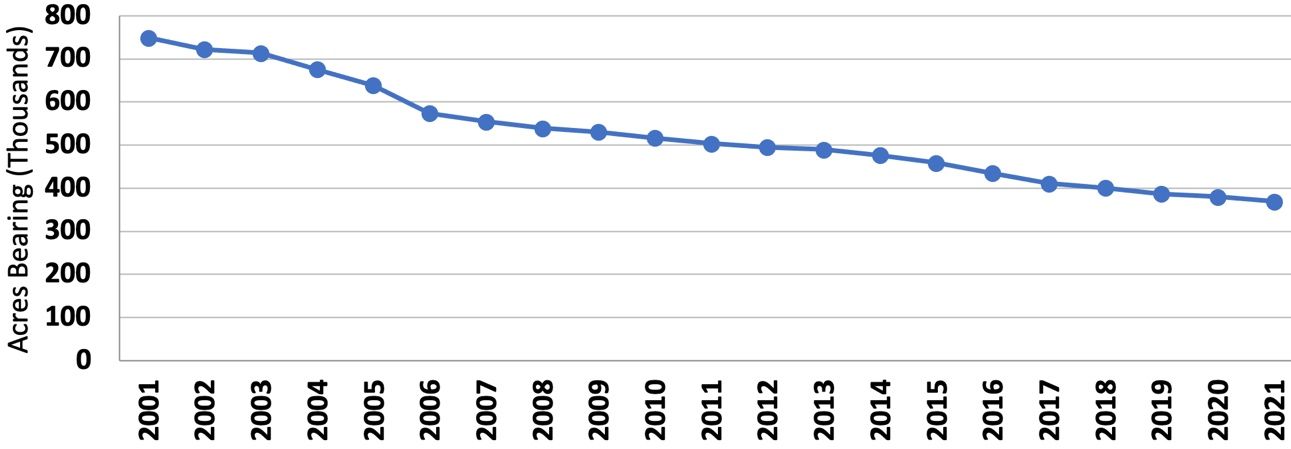
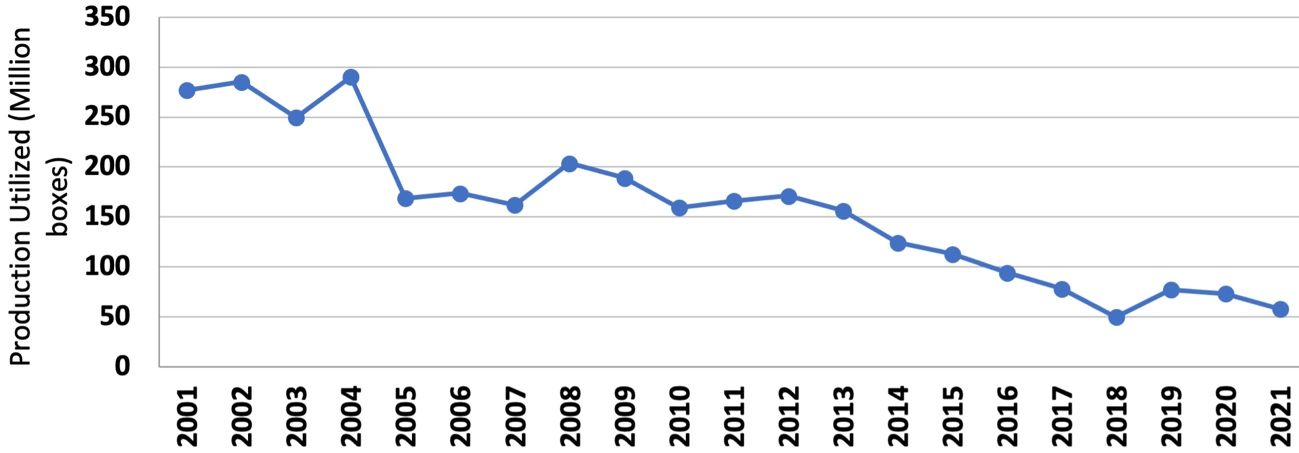
The Florida citrus industry encompasses a range of economic activities, including fruit production, fresh fruit grading, packing, and shipping to domestic and international markets, fruit processing for juice extraction and bulk shipment, and juice packaging for retail distribution. Citrus fruits, including oranges, grapefruit, and specialty fruits such as tangerines and tangelos, are commercially produced in 27 counties across central and south Florida that comprise five commercial citrus production areas (Figure 1). Florida citrus-bearing grove area has declined from approximately 750,000 acres in the year 2001 to around 369,300 acres in 2021 (Figure 2), a reduction of 51 percent, while production volume for utilization has declined by 79 percent (Figure 3), due to losses from citrus greening disease (also known as Huanglongbing or HLB), which was introduced to the state in 2005, as well as hurricanes, freeze events, and urbanization.
This publication provides a brief summary of the information available in the most recent report on the economic contributions of the Florida citrus industry to the state of Florida, published by the University of Florida, Institute of Food and Agricultural Sciences (UF/IFAS) Economic Impact Analysis Program. The full report (27 pages) is available on the UF/IFAS Economic Impact Analysis Program webpage. The economic contributions of the citrus industry were estimated for the 2020–2021 marketing year to provide updated information for all market participants as important reference data in support of informed decision making related to the citrus industry. While the Florida citrus industry is under stress due to disease and extreme weather events, understanding and communicating how the citrus industry supports economic activity throughout the state, even outside of the industry itself, is critical to the decision-making processes related to private and public investments in research, recovery funds, and other types of support. This publication provides this information in a format that is easy to understand and share with others.

Credit: USDA-NASS (2022a)

Credit: USDA-NASS (2022b)

Credit: USDA-NASS (2022b)
The report estimates the economic contributions of the Florida citrus industry to the state for the 2020–2021 marketing year while also updating the estimates from previous reports for 2018–19 and 2019–20 (Court et al. 2020, 2021; Cruz et al. 2023). The analyses were conducted using the 2019 state of Florida IMPLAN model as well as county-level IMPLAN data related to citrus industry activity (IMPLAN Group LLC) to estimate the broad regional economic contributions of the industry. Estimates of the total regional economic contributions of the citrus industry include multiplier effects. Including estimates of multiplier effects ensures that any economic activity that occurs in non-citrus-industry sectors but that is supported by the citrus industry is included in the overall estimate. The citrus industry contributes to other sectors through both supply chain spending and the spending of income directly or indirectly associated with the sale of Florida citrus products.
During the 2020–21 citrus marketing year, 57.9 million boxes of citrus fruit were produced in Florida, including 53.0 million boxes of oranges, 4.1 million boxes of grapefruit, and 0.9 million boxes of specialty citrus, of which 10 percent were sold in the fresh market, and 90 percent were used for processing. The total grower value of citrus fruit production was nearly $785 million, with fruit for processing valued at nearly $673 million and fruit for fresh consumption valued at more than $112 million, based on delivered-in prices. The total volume of certified fresh shipments in the 2020–21 citrus marketing year was nearly 11 million cartons (a carton is 4/5 of a bushel), including 6.1 million cartons of oranges, 3.8 million cartons of grapefruit, and 1.1 million cartons of specialty citrus (tangelos and tangerines). The wholesale margin on total certified fresh shipments for 2020–21 was valued at $81 million. In the same period, Florida citrus juice processors produced more than 665 million gallons of citrus juice, with a total producer value of $2.983 billion (free on board [F.O.B.] price basis). Florida citrus processors also produced byproducts of citrus pulp, meal, molasses, and the essential oil d-limonene, valued at nearly $63 million.
Results of the economic contribution analysis for the state of Florida are shown in Table 1. The analysis estimated total industry output contributions of $6.935 billion, including $1.425 billion from citrus fruit production (grower receipts), $5.334 billion from citrus juice manufacturing, and $177 million from packinghouse sales of fresh citrus. The citrus industry supported a total of 32,542 full-time and part-time jobs across the state. Total value-added contributions, estimated at $2.841 billion, represent the industry’s contribution to Gross State Product. Labor income contributions amounted to $1.606 billion (labor income includes earnings by employees and business owners throughout the state economy). Total state and local tax contributions supported by the Florida citrus industry were $151 million. The southern commercial citrus production area had the highest share of citrus industry employment contributions (9,637 jobs), followed by western (6,732 jobs), central (5,254), northern (5,158 jobs), Indian River District (2,591 jobs), and the rest of Florida (3,169 jobs).
Table 1. Summary of economic contributions of Florida citrus industry activities, 2020–21.
References
Court, C. D., J. P. Ferreira, and J. Cruz. 2020. Economic Contributions of Florida Citrus Industry in 2018–2019. UF/IFAS Economic Impact Analysis Program.
Court, C. D., J. P. Ferreira, and J. Cruz. 2021. Economic Contributions of Florida Citrus Industry in 2019–2020. UF/IFAS Economic Impact Analysis Program.
Cruz, J., C. D. Court, and J. P. Ferreira. 2023. 2020–2021 Economic Contribution of the Florida Citrus Industry. UF/IFAS Economic Impact Analysis Program, Food and Resource Economics Department, University of Florida. https://fred.ifas.ufl.edu/extension/economic-impact-analysis-program/publications/2020-21-citrus-economic-contributions-report/
IMPLAN® model. 2022. 2019 Data for Florida, using inputs provided by the user and IMPLAN Group LLC [dataset and software], 16905 Northcross Dr., Suite 120, Huntersville, NC 28078. http://www.implan.com
USDA National Agricultural Statistics Service (USDA-NASS). 2022a. Florida Citrus Statistics 2020–21. USDA-NASS, Florida Field Office. https://www.nass.usda.gov/Statistics_by_State/Florida/Publications/Citrus/Citrus_Statistics/2020-21/fcs2021b.pdf
USDA National Agricultural Statistics Service (USDA-NASS). 2022b. NASS - Quick Stats [dataset]. USDA-NASS. https://quickstats.nass.usda.gov/
Glossary
Contribution (economic) represents the gross value of economic activity associated with an industry, event, or policy in an existing regional economy.
Employee compensation comprises wages, salaries, commissions, and benefits such as health and life insurance, retirement, and other forms of cash or non-cash compensation.
Employment is a measure of the total number of jobs, including full-time, part-time, and seasonal positions. It is not a measure of full-time equivalents (FTEs).
Exports are sales of goods to customers outside the region in which they are produced, which represents a net inflow of money to the region. This also applies to sales of services to customers visiting from other regions.
Final demand represents sales to final consumers, including households, governments, and exports from the region.
Gross Regional Product (GRP) is a measure of economic activity in a region or total income generated by all goods and services. It represents the sum of total value added by all industries in that region and is equivalent to gross domestic product (GDP) for the United States.
IMPLAN is a computer-based input-output modeling system that enables users to create regional economic models and multipliers for any region consisting of one or more counties or states in the United States. For more information, visit www.implan.com.
Imports are purchases of goods and services originating outside of the region of analysis.
Income is the money earned within the region from production and sales. Total income includes labor income such as wages, salaries, employee benefits, and business proprietor income, plus other property income.
Taxes on production and imports are taxes paid to governments by individuals or businesses for property, excise, and sales taxes but do not include income taxes.
The Input-Output (I-O) model and Social Accounting Matrix (SAM) represent the transactions between industry sectors within a regional economy. These models capture what each sector purchases from every other sector to produce its output of goods or services. Using such a model, flows of economic activity associated with any change in spending can be traced backward through the supply chain.
Margins represent the portion of the purchaser price accruing to the retailer, wholesaler, and producer/manufacturer in the supply chain. Typically, only the retail margins of many goods purchased by consumers accrue to the region of analysis, as the wholesaler, shipper, and manufacturer often lie outside the region of analysis.
Multipliers are expressed as a ratio of the total economic contributions in the region relative to the direct economic contributions. Multipliers are derived from an input-output model of the regional economy and communicate the degree of interdependency between sectors in a region's economy. Multipliers can vary considerably across regions and sectors.
Other property income represents income received from investments, such as corporate dividends, royalties, property rentals, or interest on loans.
Output is the dollar value of a good or service produced or sold and is equivalent to sales revenues plus changes in business inventories.
Producer prices are the prices paid for goods at the factory or point of production. For manufactured goods, the purchaser price equals the producer price plus a retail margin, a wholesale margin, and a transportation margin. For services, the producer and purchaser prices are equivalent.
Proprietor income is income received by non-incorporated private business owners or self-employed individuals.
Purchaser prices are the prices paid by the final consumer of a good or service.
Region or Regional economy is the geographic area and the economic activity it contains for which contributions are estimated. It might consist of an individual county, an aggregation of several counties, a state, or an aggregation of states. These aggregations are sometimes defined on the basis of worker commuting patterns.
A Sector is an individual industry or group of industries that produce similar products or services or have similar production processes. Sectors are classified according to the North American Industrial Classification System (NAICS).
Value-added is a broad measure of income, representing the sum of employee compensation, proprietor income, other property income, indirect business taxes, and capital consumption (depreciation), that is comparable to Gross Domestic Product. Value-added is a commonly used measure of the contribution an industry makes to a regional economy.