
Introduction
Florida’s craft beer industry recently underwent explosive growth, expanding from just 66 to 396 breweries over the past decade, a sixfold increase, with an estimated economic impact of over $4 billion in 2022 (Brewers Association 2023a). Hundreds of recent entrants mean that the craft beer sector is composed primarily of small businesses that may lack the resources and expertise to conduct in-house market research, unlike their large domestic counterparts (Budweiser, Coors, etc.). For example, Molson Coors Beverage Company, which produces approximately 9.7 million US barrels (bbl.) of beer annually just at their Golden, Colorado, facility (Molson Coors Beverage Company 2023), can afford to invest substantially more in market analysis than the median Florida craft brewery producing 347 bbls/year (Brewers Association 2024). (A single beer barrel contains 31 US gallons or 248 US pints.) Trade groups for craft breweries, such as the Brewers Association, publish market research at the national level (Brewers Association 2023c; Zondag and Watson 2017), but, due to their national audience, often do not delve into more localized, state-specific nuances. This report aims to deliver data-driven marketing information to Florida breweries. It can serve as a guide to the purchasing and consumption habits of Florida beer consumers. We specifically dive into beer consumption and purchase frequency, monthly beer expenditure, and where consumers most often drink and purchase beer. A bulleted list of key consumer insights for craft breweries is included at the end.
Survey of Florida Beer Consumers
We conducted an online market research study of consumers between July and October of 2023. The survey focused on recent alcohol purchasing and consumption habits of Florida beer consumers—people who purchased and consumed beer during the previous six months. We break down the demographics of our sample in Table 1 and compare it to official statistics for the overall population in the state of Florida. Comparatively, our consumers are more likely to be women and are considerably older, wealthier, and more likely to hold a college degree. The results that follow apply specifically to Florida beer consumers rather than the general population.
Table 1. Sample composition vs population of Florida.
Beer consumption, purchasing habits, and preferences
Our survey focused on several key consumer profile characteristics that, when combined with demographic information, can help brewers more efficiently market their products to specific segments of beer consumers.
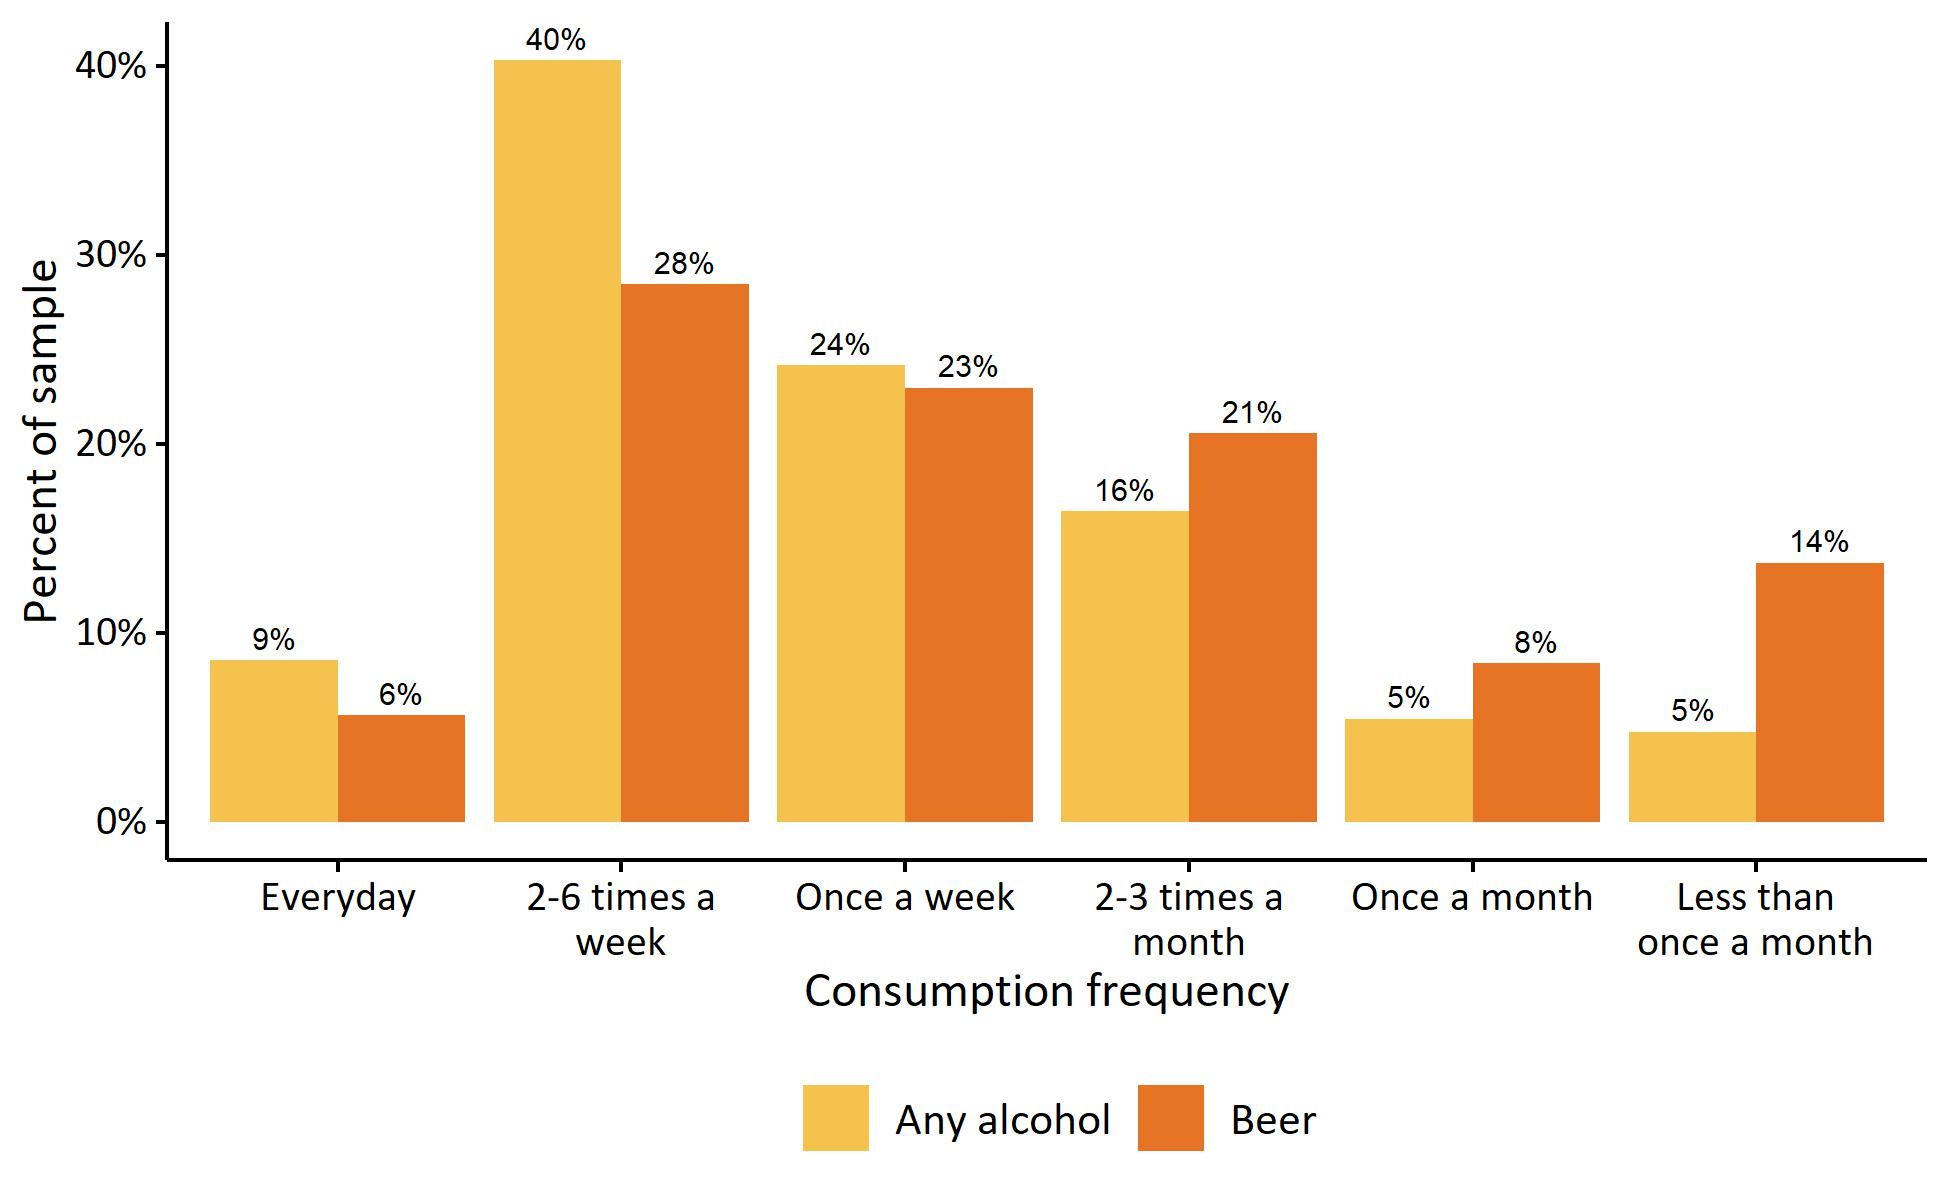
We first look at beer consumption frequency, an important indicator of consumer familiarity and preferences. Most Florida beer consumers enjoyed beer often, with 86% consuming beer at least once a month and 57% at least once a week (see Figure 2). Frequent consumption is good news for craft breweries because regular consumers often (but not always) prioritize non-price attributes such as quality and taste (Calvo-Porral, Orosa-González, and Blazquez-Lozano 2018; Hollebeek et al. 2007). Additionally, beer consumption was only slightly less frequent than consumption of any alcohol type, indicating that beer likely accounts for a substantial share of total alcohol consumed.
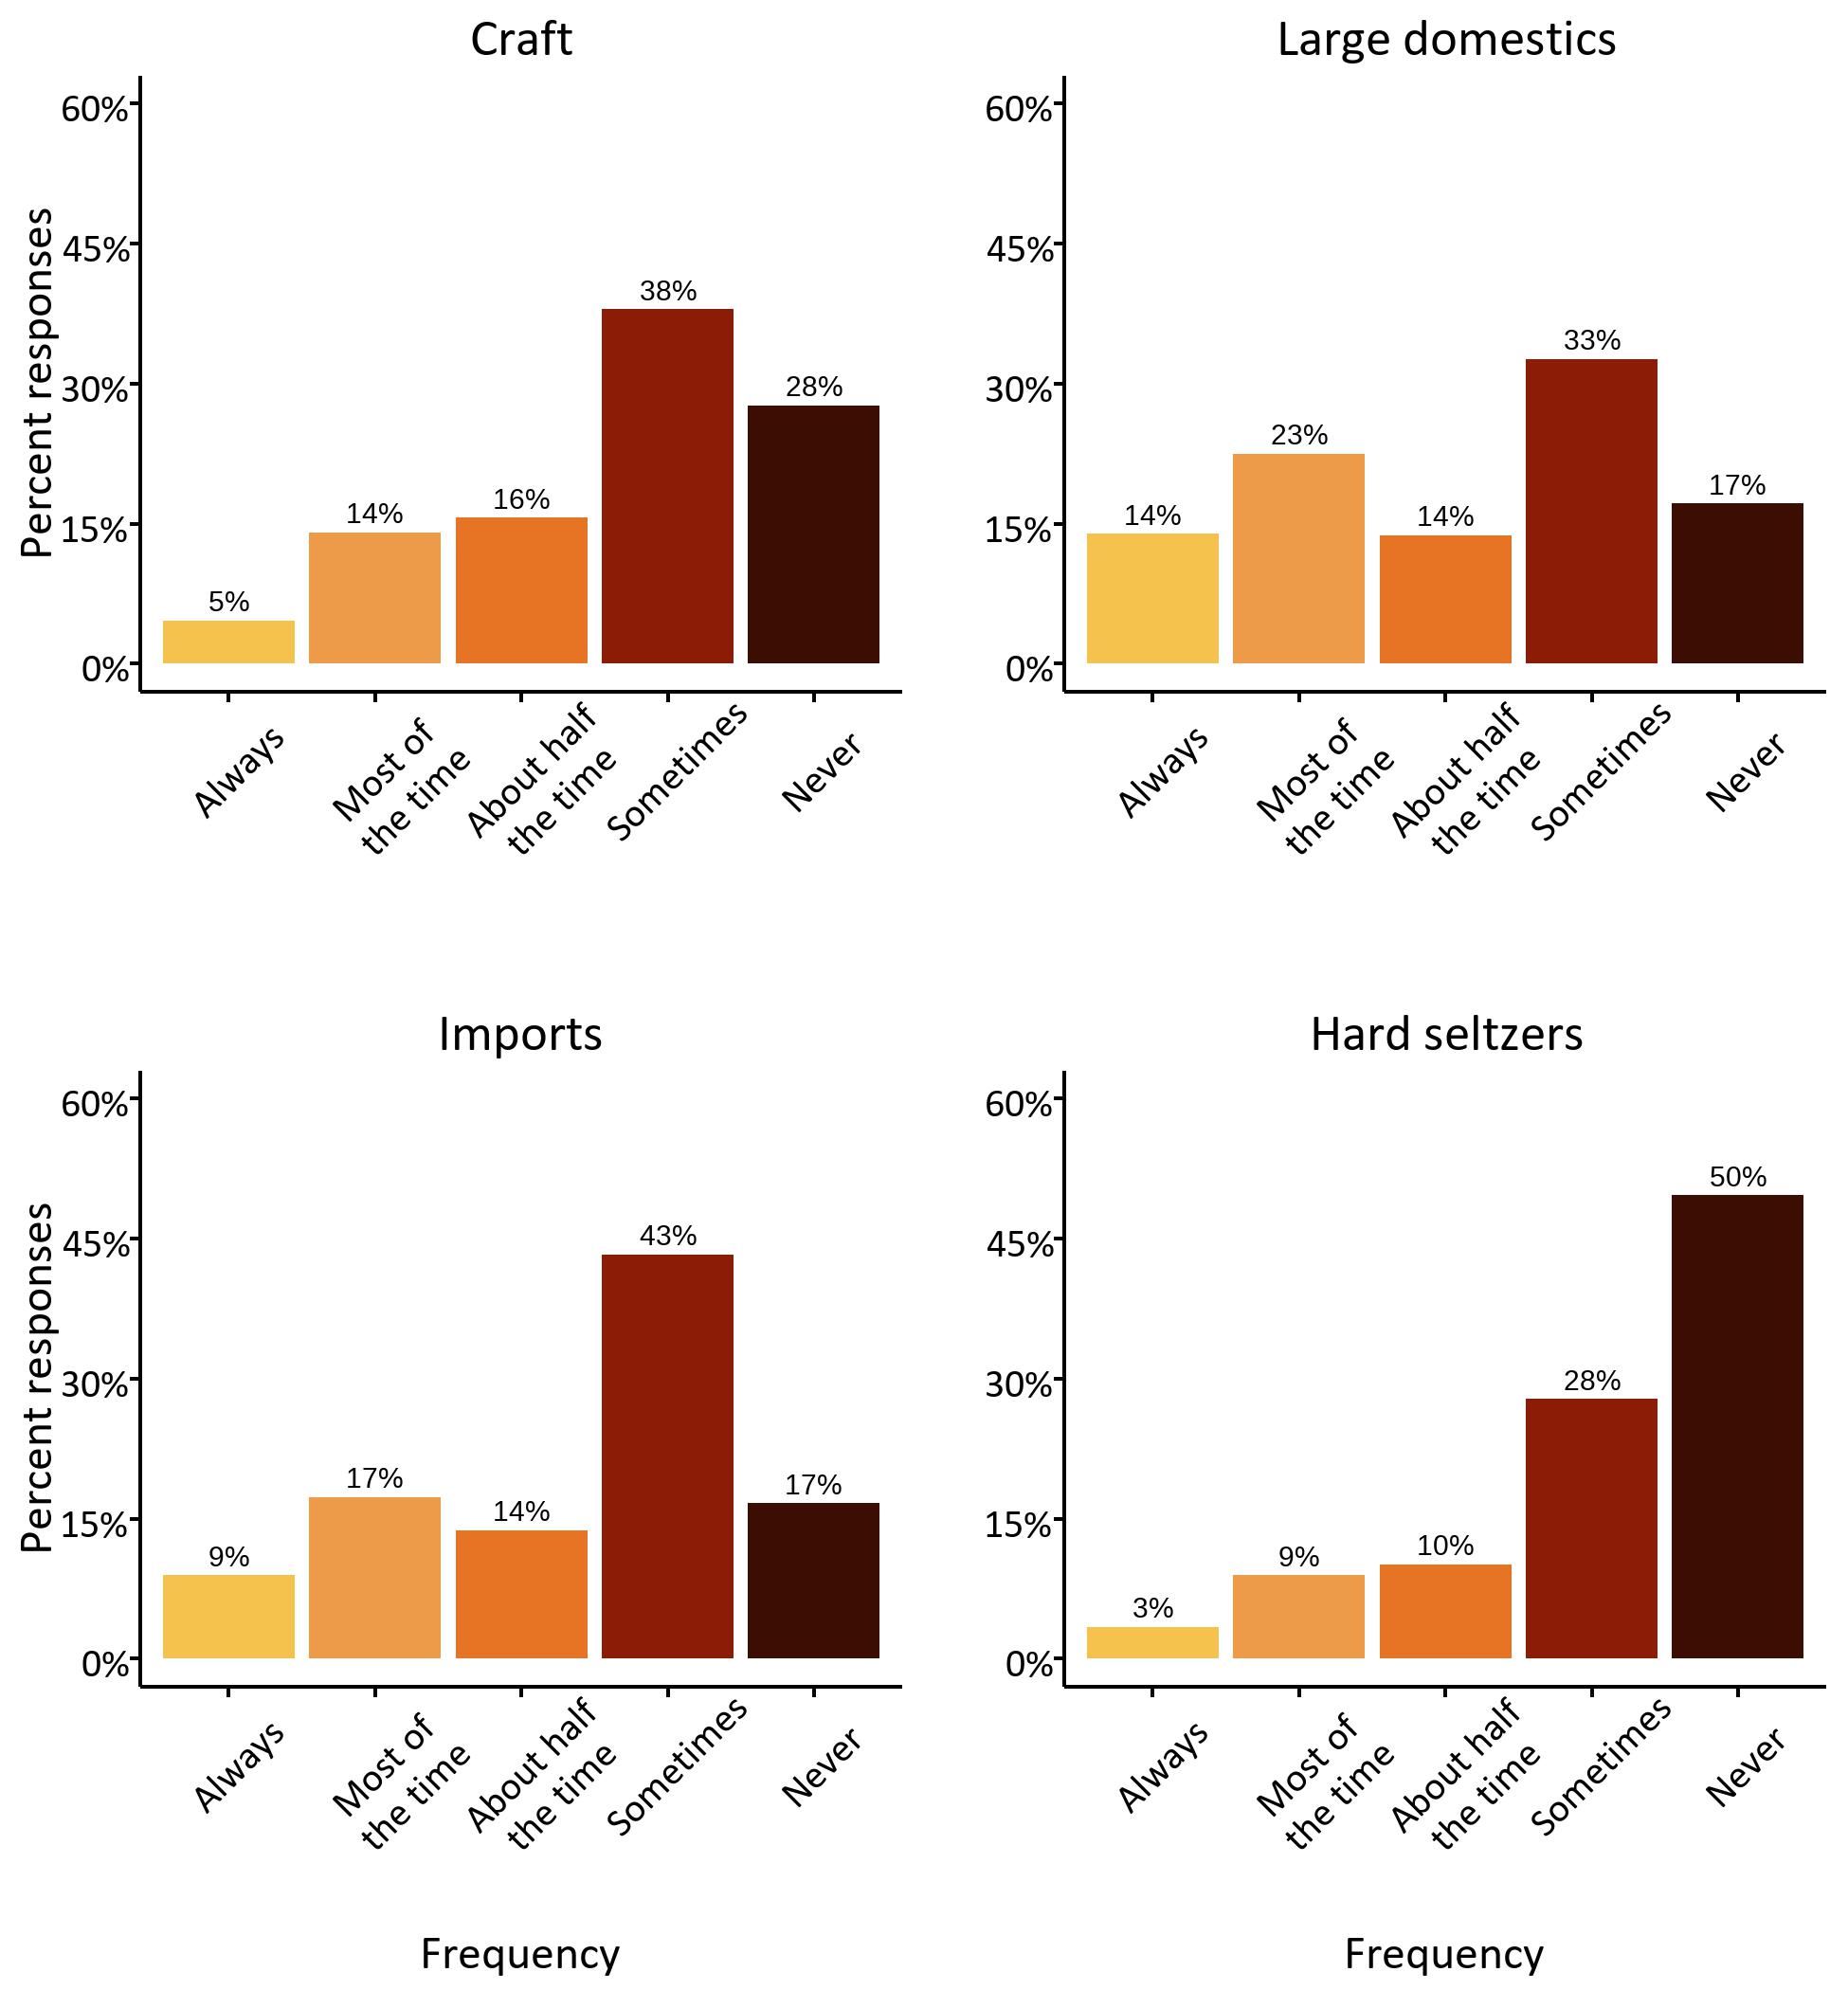
Another closely related metric is purchasing frequency, which we break down by beer type to show how craft beer stacks up against other beer categories. We provided respondents with definitions and examples of brands in each beer category. Categories follow NielsenIQ’s classification (NielsenIQ and 3 Tier Beverages 2024), although multiple subcategories (e.g., domestic premium, domestic super premium, below premium) were grouped into a single domestic beer category to avoid confusing respondents. Large domestics and imports were the most frequently purchased, with very few consumers reporting that they never purchase these categories (see Figure 3). This is unsurprising and aligns with large domestics and imports accounting for the first and second largest shares of the US beer market (64.5% and 22.2%, respectively), compared to craft beer, which accounts for 13.2% of the market (Brewers Association 2023b). That being said, over 30% of our consumers purchased craft beer at least half the time, and only 28% reported never buying it. The fact that 72% of our sample purchased craft beer at least some of the time highlights its diverse appeal beyond a narrowly defined demographic of consumers. Hard seltzer (not actually beer but often marketed as a substitute) was purchased the least frequently and was the only category where a plurality of respondents (50%) stated that they had never purchased it.
Because the purchasing habits of specific demographic groups can be used to tailor marketing effort and identify new market opportunities, we segment purchase frequency by gender, generation, and income brackets. Our results, visualized in Figure 4, show that women reported purchasing craft beer only slightly less frequently than men, which reflects a shrinking gap between genders who identify as regular beer drinkers (Watson 2018). Implementing inclusive marketing strategies can enhance the attractiveness of products to a growing segment of women consumers.
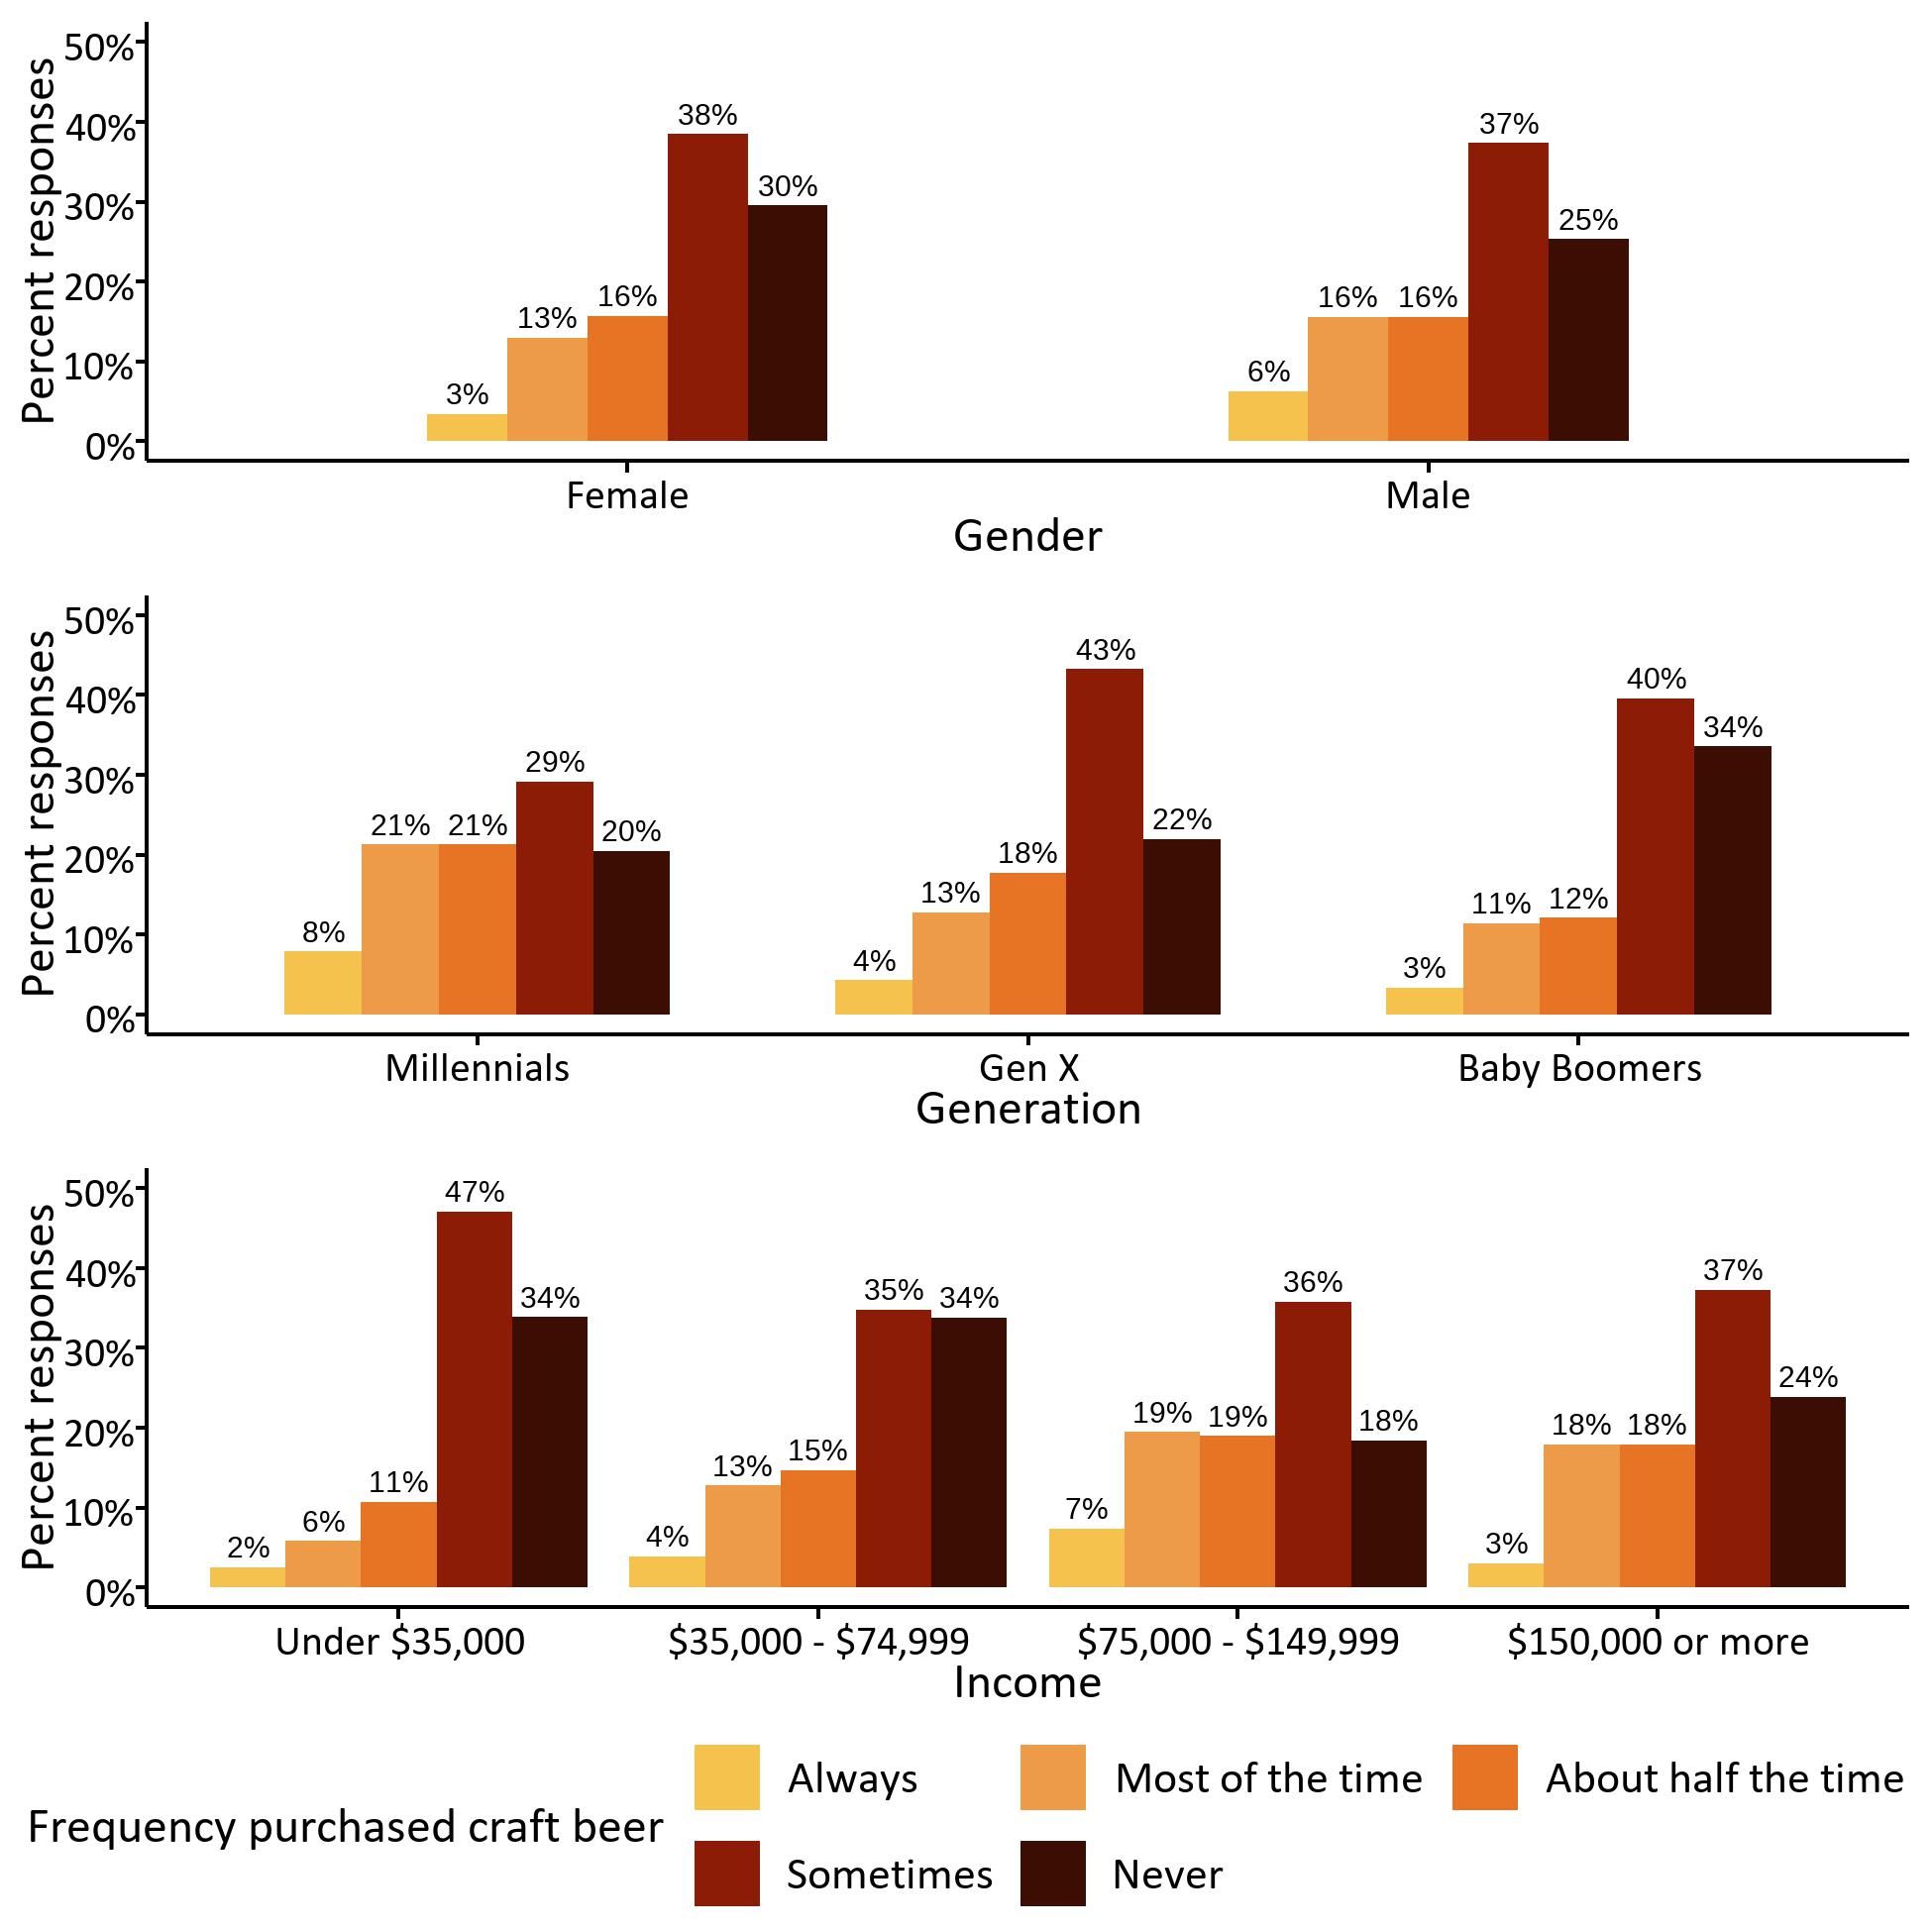
Generational differences are known to drive distinct purchasing and consumption patterns, and our results sync with national level market research showing that millennials tend to purchase craft beer the most frequently, with rates declining as age increases (Zondag and Watson 2017). Although baby boomers purchased craft beer the least often, Florida’s uniquely large population of retirees represents a considerable potential market for breweries that can effectively appeal to this generation. We refrained from including Gen Z out of an abundance of caution due to the extremely low representation within our sample (less than 3% of responses).
In relation to income brackets, craft-beer purchase frequency increases substantially as we move up through the first three groups but somewhat unexpectedly declines among the top earners. The minor downward shift (top earners still purchased beer substantially more often than either of the first two income brackets) could be driven by a higher proportion of older consumers or a preference for other alcohol types (e.g., wine). For similar reasons, consumers in the $75,000 and $150,000 brackets may purchase craft beer most frequently because they are generally younger than top earners and have substantial disposable income. The main takeaway for brewers is that the most frequent purchasers of craft beer fall into the higher income brackets.
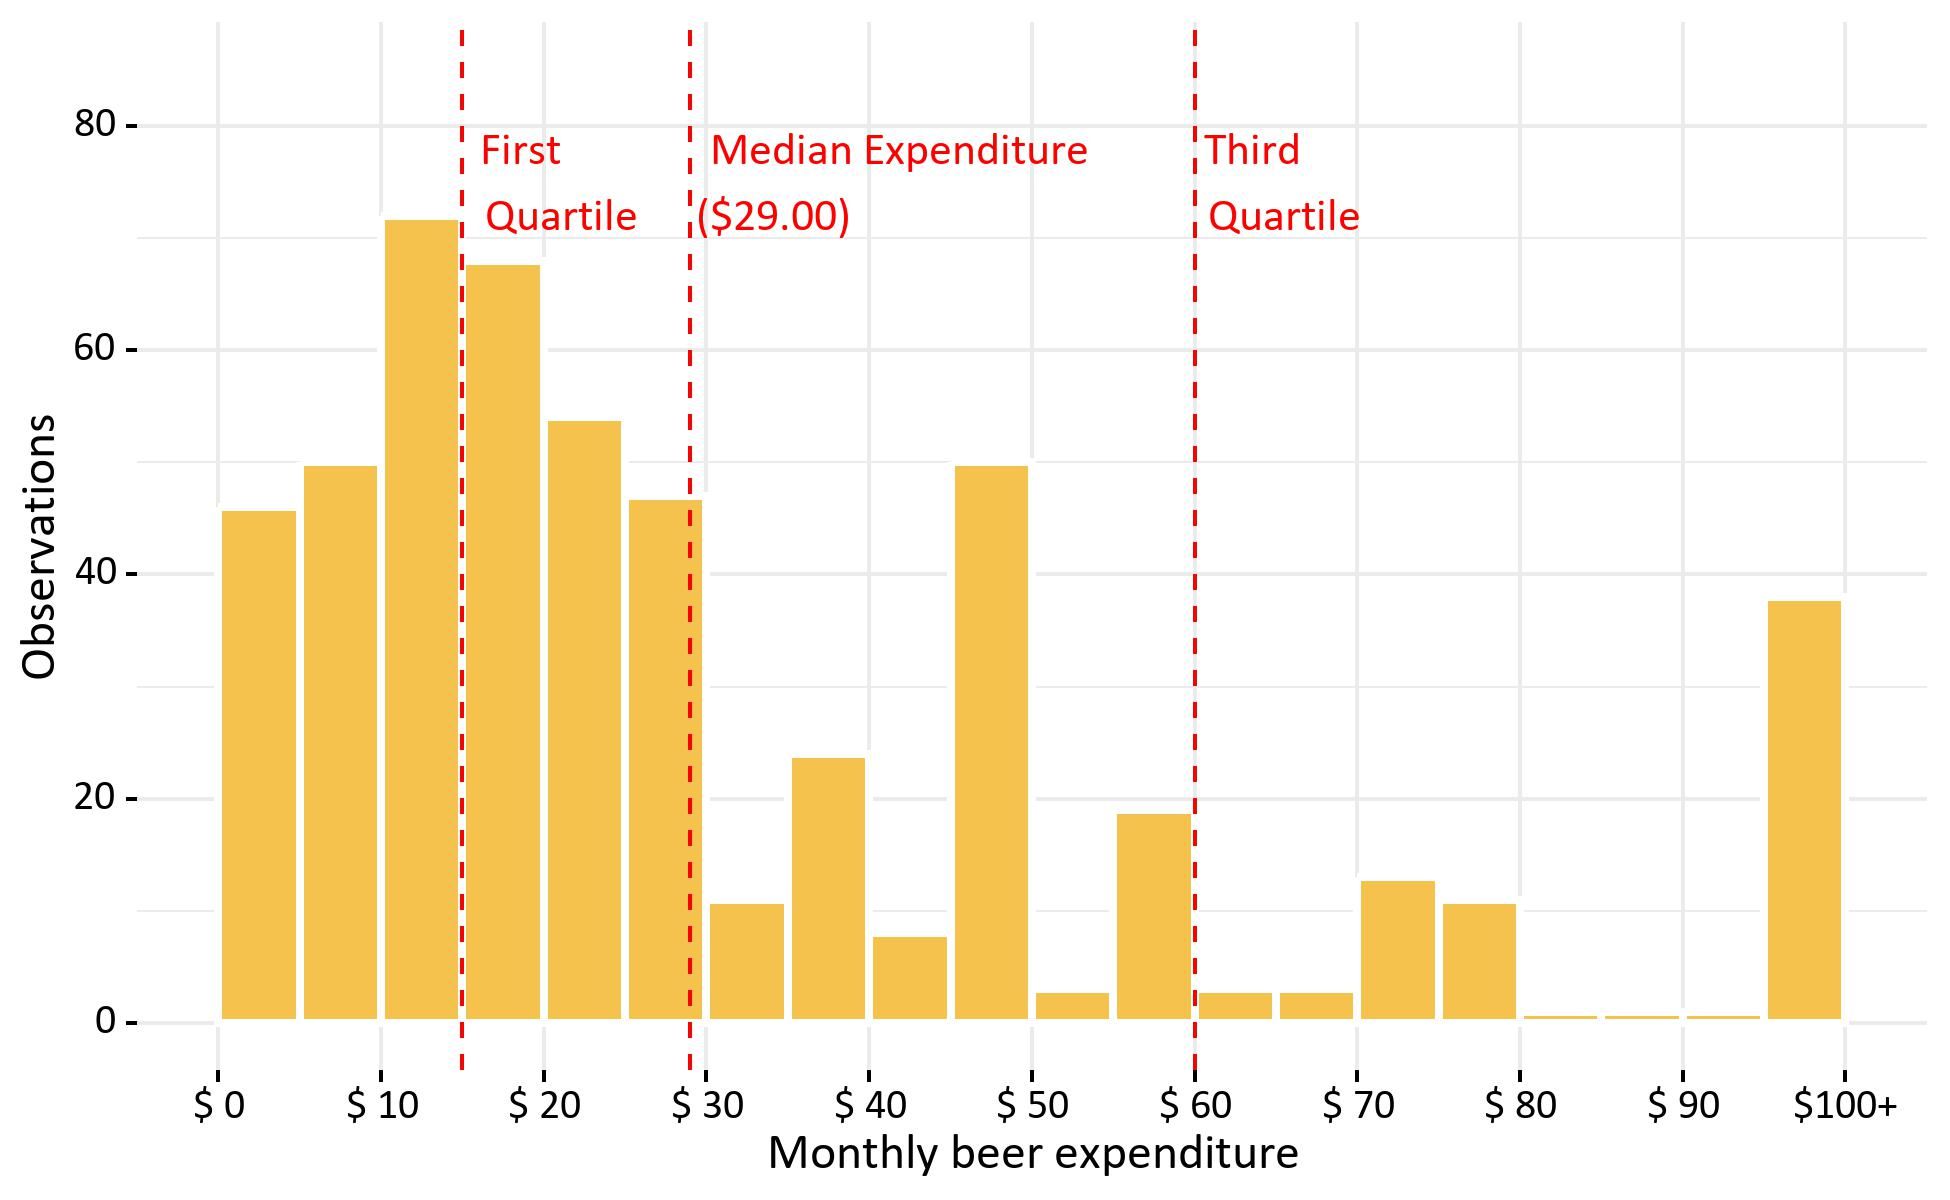
We also examined monthly expenditures to provide insight into how much specific segments of consumers will spend on beer, an approach that can be useful when determining pricing strategies and potential market size. The typical monthly spending among our consumers ranged widely from $0 for some to over $500 for others. However, as indicated in Figure 5, 75% of our sample spends less than $60 a month on beer, and 50% (the median) spend less than $29. Note that expenditure includes all beer purchases, regardless of type, and is likely split between craft beers, imported beers, and large domestic beers. The key distinction is that the median beer drinker in our sample spends a fraction of $29 on craft beer every month.
As with beer purchase frequency, we further investigated the spending habits of different generations of beer consumers. As shown in Table 2, beer expenditure is highest among millennials and declines with age. Impressively, the median monthly beer expenditure for millennials is twice that of baby boomers ($50 vs $25, respectively) and $20 more than Gen X. Moreover, a quarter of millennials (the 3rd quartile in Table 2) stated that they spent at least $100 monthly on beer. Given that millennials are also the most frequent purchasers of craft beer, it is no surprise that this demographic is the primary target for many breweries. However, as stated earlier, Florida has a large population of baby boomers, and, although their monthly spending may be lower, it is certainly not negligible. The boomer sector represents a large market when it is aggregated across all members of this generation. Of course, a brewery must have a successful marketing strategy to attract these consumers. We again excluded Gen Z due to the limited representation of this group in our sample.
Table 2. Median monthly beer expenditure by generation.
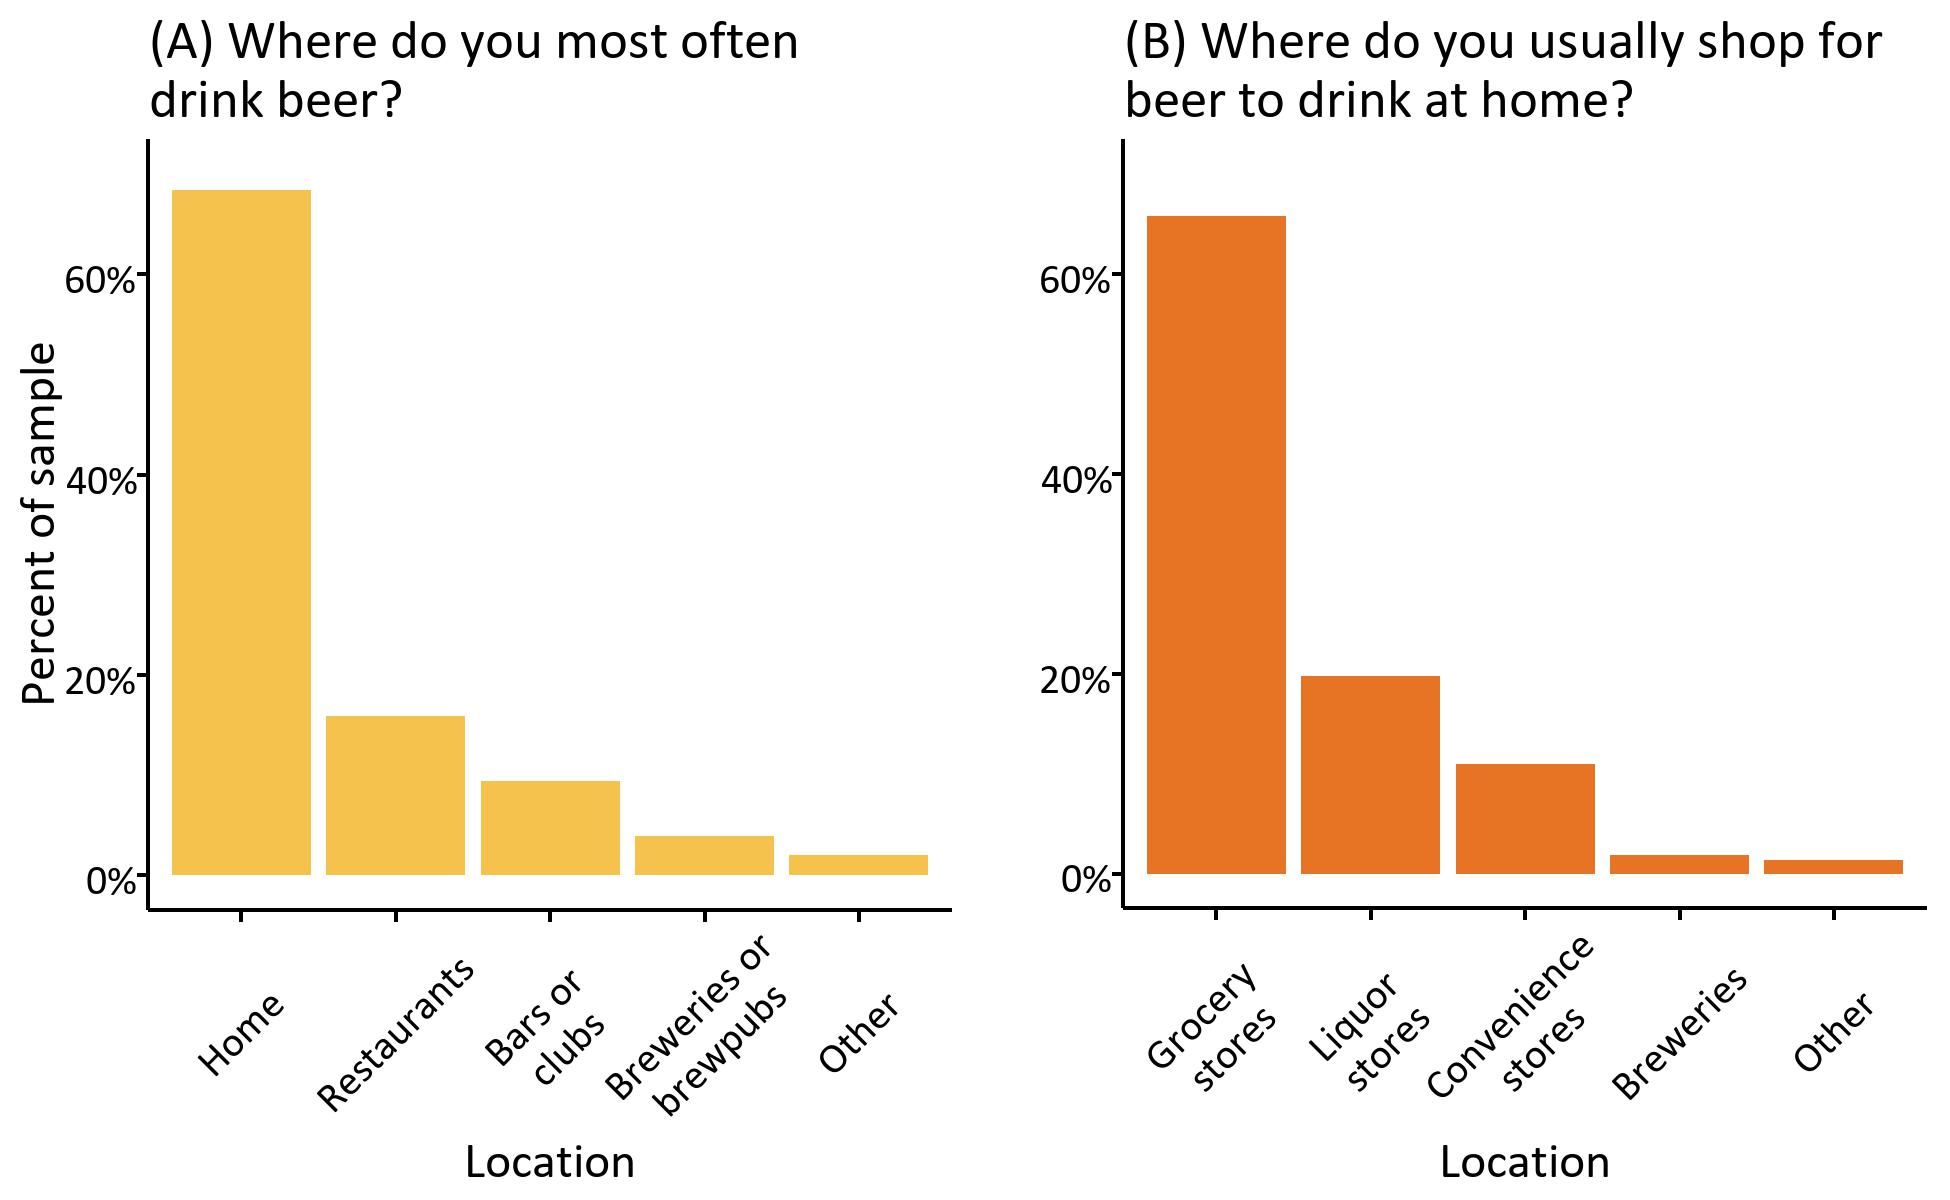
Understanding where Floridians choose to drink and shop for beer has major implications for breweries in terms of marketing, packaging, and distribution. We asked our consumers to identify where they usually enjoy drinking beer and which retailer they buy from most often. Figure 6 shows that the vast majority of consumers most frequently drink beer at home, highlighting the importance of packaging (e.g., cans or bottles) in terms of market penetration. We also found that grocery stores were the most popular beer retailers, which has meaningful ramifications for small craft breweries. Major grocery retailers tend to dedicate limited shelf space to beer and prefer to stock widely recognized brands because they rely on high product turnover (Palardy et al. 2023). This can make getting beer onto grocery shelves a challenge for newer, less well-known breweries. The good news for craft brewers is that liquor stores were the second most cited places to shop for beer. In contrast to grocery stores, liquor stores often rely on a diverse product selection to drive foot traffic, which makes them more accessible to craft breweries and responsive to direct marketing (Palardy et al. 2020).
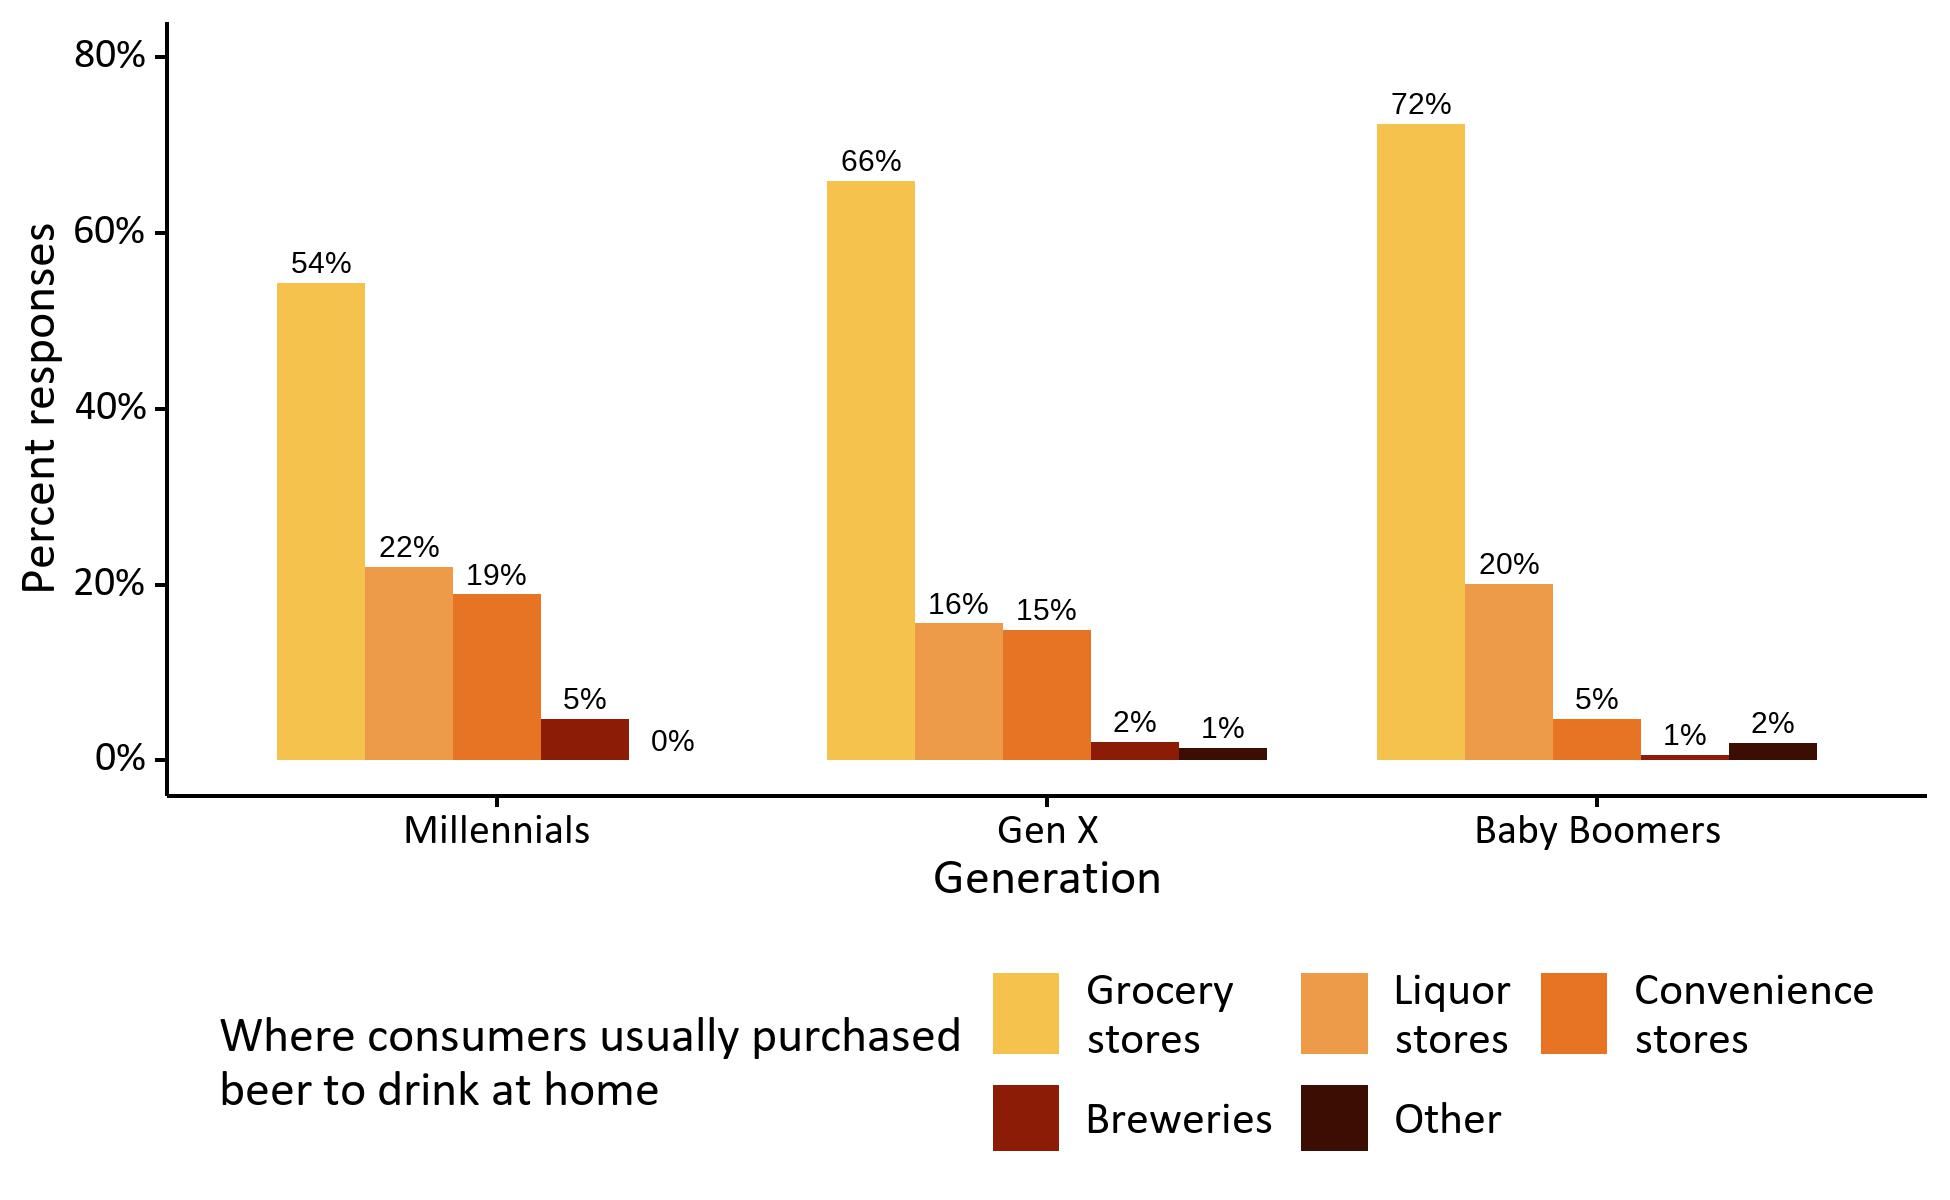
Generational differences in shopping preferences motivated us to contrast where consumers of different ages usually purchase beer to drink at home. Beer drinkers of all ages listed grocery stores as their retailer of choice, reiterating the dominance of the grocery channel (see Figure 7). Older consumers, however, were much more likely to choose grocery stores compared to younger consumers (72% of baby boomers vs 54% of millennials), while the opposite was true for convenience stores (5% of baby boomers vs 19% of millennials). Liquor stores were the second choice for all generations, again a positive sign for craft beer, but the high proportion of millennials who usually purchased from convenience stores could present a challenge. The previously mentioned hurdles to getting on grocery shelves are amplified even further in the convenience environment. Shelf space is more limited, packaging favors larger single containers, and convenience store customers typically take only a few minutes to enter a store, select and purchase their items, and leave, implying rapid purchase decisions driven by price and brand recognition (Palardy et al. 2020). That being said, some regional craft breweries, such as Firestone Walker, New Belgium, and Bell’s, are targeting convenience store customers with recently launched product lines of 19.2 oz. cans (Iseman 2023).
Key Consumer Insight for Craft Breweries
This is the first installment in a series focusing on providing evidence-based market analysis that will allow breweries to leverage their strengths to market their products using strategies that align with recent insights on consumption patterns and purchase preferences in Florida. Our initial snapshot of Florida beer consumers generated some key insights for brewers operating in the Sunshine State.
- 86% of our consumers drank beer at least once a month, and 72% purchased craft beer at least some of the time, a positive sign that craft beer broadly appeals to a diverse array of consumers.
- Women purchased craft beer only slightly less frequently than men, highlighting the importance of inclusive marketing for breweries looking to expand their consumer base in a competitive market.
- Millennials purchased craft beer the most frequently and had the highest median monthly beer expenditure ($50) of any generation, reaffirming the importance of appealing to this segment of consumers.
- Although baby boomers purchased craft beer the least frequently and had a lower median monthly beer expenditure ($25), the sheer size of this consumer segment, especially in certain counties in Florida, presents an opportunity for breweries that can successfully appeal to these consumers.
- Consumers most frequently enjoyed beer at home, illustrating the importance of packaging to reach customers in stores.
- Grocery stores were the most popular choice for buying beer to-go across all age groups, but to a much greater extent for baby boomers than for millennials.
- A substantial share of millennials (19%) reported that they most often buy beer from convenience stores, higher than any other generation. This could pose a challenge to small breweries trying to reach these consumers due to the hurdles involved in selling through convenience stores.
References
Brewers Association. 2023a. “Florida’s Craft Beer Sales & Production Statistics, 2022.” State Stats (blog). 2023. https://www.brewersassociation.org/statistics-and-data/state-craft-beer-stats/?state=FL
Brewers Association. 2023b. “National Beer Sales & Production Data.” Brewers Association (blog). 2023. https://www.brewersassociation.org/statistics-and-data/national-beer-stats/
Brewers Association. 2023c. “The New Brewer September/October 2023: Sales and Marketing Issue.” 2023. https://mydigitalpublication.com/publication/?i=802101&view=issueViewer&pp=1
Brewers Association. 2024. “Brewery Data (2023 Data).” 2024. https://www.brewersassociation.org/statistics-and-data/brewery-production-data/
Calvo-Porral, Cristina, Javier Orosa-González, and Felix Blazquez-Lozano. 2018. “A Clustered-Based Segmentation of Beer Consumers: From ‘Beer Lovers’ to ‘Beer to Fuddle.’” British Food Journal 120 (6): 1280–94. https://doi.org/10.1108/BFJ-11-2017-0628
Hollebeek, Linda D., Sara R. Jaeger, Roderick J. Brodie, and Andrew Balemi. 2007. “The Influence of Involvement on Purchase Intention for New World Wine.” Food Quality and Preference 18 (8): 1033–49. https://doi.org/10.1016/j.foodqual.2007.04.007
Iseman, Courtney. 2023. “19.2-Ounce Beers Are on the Rise: The Skinny on the Taller Cans.” All About Beer, May 23, 2023. https://allaboutbeer.com/19-2-ounce-beers-are-on-the-rise-the-skinny-on-the-taller-cans/
Molson Coors Beverage Company. 2023. “Golden Brewery | Molson Coors.” 2023. https://www.molsoncoors.com/our-locations/us/brewery/golden
NielsenIQ, and 3 Tier Beverages. 2024. “3 Tier Beverages/NielsenIQ Dashboard.” 2024. https://www.brewersassociation.org/statistics-and-data/industry-data-sets/#tab-3tierbeveragesniqdashboard
Palardy, Nathan, Marco Costanigro, Joseph P. Cannon, Dawn Thilmany, Joshua Berning, and Jeff Callaway. 2020. “Beer Sales in Grocery and Convenience Stores: A Glass Half-Full for Colorado Craft Brewers?” REDI Reports (blog). August 26, 2020. https://foodsystems.colostate.edu/wp-content/uploads/2020/08/FF_BeerGrocery_8-26-20.pdf
Palardy, Nathan, Marco Costanigro, Joseph Cannon, Dawn Thilmany, Joshua Berning, Jude Bayham, and Jeff Callaway. 2023. “Beer Sales in Grocery and Convenience Stores: A Glass Half-Full for Craft Brewers?” Regional Studies 57 (10): 1981–1994. https://doi.org/10.1080/00343404.2023.2166914
Watson, Bart. 2018. “Shifting Demographics Among Craft Drinkers.” Brewers Association (blog). June 12, 2018. https://www.brewersassociation.org/insights/shifting-demographics-among-craft-drinkers/
Zondag, Marcel, and Bart Watson. 2017. “Who Is the Craft Beer Shopper?” Brewers Association. https://s3-us-west-2.amazonaws.com/brewersassoc/wp-content/uploads/2017/09/White-Paper-Who-Is-the-Craft-Beer-Shopper.pdf