Managing soil moisture properly through irrigation is key to increasing crop yield and conserving water. By understanding soil moisture variability, growers can better manage their irrigation systems to apply the right amount of water at the right time. Soils are known to be heterogeneous across fields, and this plays an important role in soil moisture variability. By knowing the spatial variability of soil moisture on an irrigated field, localized and precise irrigation scheduling can be performed, thus avoiding under- and over-irrigation, which can result in plant water stress or nutrient leaching. Improved irrigation scheduling techniques that use soil moisture sensors to control irrigation events can greatly increase irrigation water use efficiency. Capacitance-based soil moisture measurement devices are relatively accurate in the sandy soils common to Florida.
This publication proposes guidelines for soil moisture sampling that account for spatial variability, which helps to determine the minimum number of soil moisture sensors required to survey and monitor a specific area for irrigation.
Soil Moisture Equipment
Soil moisture can be directly evaluated using commercially available portable soil moisture sensor devices. Specific zones of the field can be easily identified and managed when soil moisture sensing technology includes global positioning systems (GPS) and geographic information systems (GIS) for producing soil moisture maps.
For the purposes of this publication, near-surface (8 inches) volumetric soil moisture content was sampled using a commercially available portable time domain reflectometry (TDR) probe. The equipment has a published error of ±2% vol/vol or less. The soil probe consists of two parallel 0.25-inch-thick and 8-inch-long stainless steel rods. The TDR unit was connected to a GPS for georeference of each sampling point. The georeferenced soil moisture data were stored in the TDR unit's datalogger.
Soil Moisture Sampling Plan
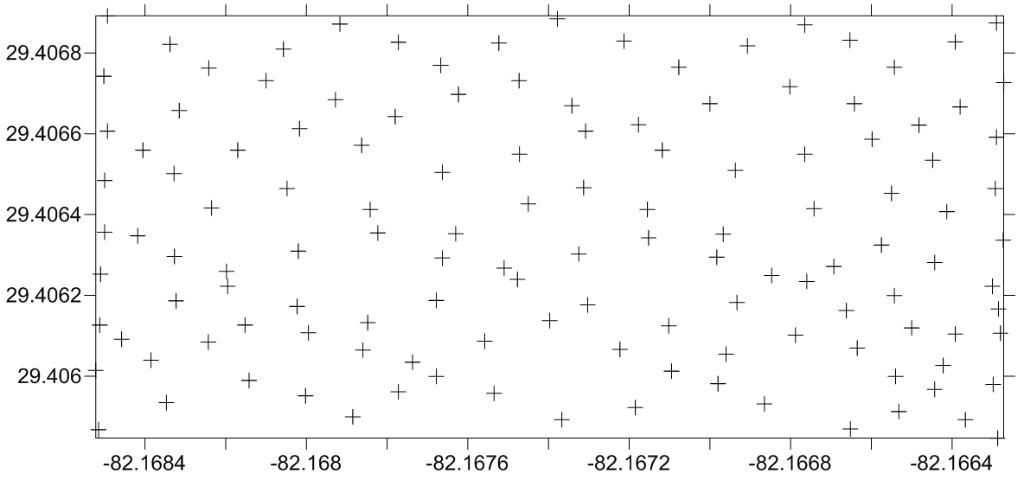
After determining the boundaries of a given area, a soil moisture sampling plan should be developed. The initial sampling should be performed in a small grid; however, it is important to maintain a minimum of twenty sampling points per acre for a good soil moisture characterization, covering the entire area (Figure 1). Subsequent soil moisture sampling can be conducted using a grid-based system; however, the sampling density can be reduced to half of the distance beyond which soil moisture is no longer spatially dependent (indicated as "range value") (Mann et al. 2012).

Credit: M. Paranhos, UF/IFAS
A temporal distribution of the sampling is also recommended in order to capture the spatial soil moisture variability of the area with regard to overall soil moisture conditions (e.g., dry season vs. wet season). Sampling should be taken under at least three soil moisture conditions: high soil moisture (i.e., after a rainfall); medium soil moisture (i.e., a few days after a rainfall), and low soil moisture (i.e., a few weeks without rainfall).
Determining Soil Moisture Scale and Preparing Soil Moisture Map
Soils can store different amounts of water, depending on their texture and structure. The upper limit of water storage is called "field capacity," while the lower limit is called the "permanent wilting point." Soil moisture characteristics and interpretation are detailed in Interpretation of Soil Moisture Content to Determine Soil Field Capacity and Avoid Over-Irrigating Sandy Soils Using Soil Moisture Sensors (https://edis.ifas.ufl.edu/ae460). Based on the soil field capacity and permanent wilting point of most of Florida's sandy soils, a soil moisture scale can be determined to provide a better visual analysis, mapping data interpretation and identifying areas with similar soil moisture patterns. This study sampled Tavares sand, Candler sand, Placid sand, Myakka fine sand, St. Johns fine sand, and Immokalee fine sand. The field capacity point for these Florida soils ranges between 9% and 14% volumetric water content (VWC). Based on the soil field capacity range of the soils studied, an arbitrary soil moisture scale was prepared (Table 1). For heavier soil texture, another soil moisture scale may be required for similar analysis.
Basic Components of Geostatistics, Variogram Interpretation, and Data Interpolation
Geostatistical procedure provides a set of tools for incorporating the spatial coordinates of soil moisture observations in data processing. This allows for better description and modeling of spatial patterns and better prediction of soil moisture at unsampled locations. Detailed descriptions of geostatistical estimation can be found in specific texts, such as Goovaerts (1997). This publication explains important parameters of geostatistical analysis in a more simplistic language to help with interpretation of observed results. This publication does not aim to teach the reader how to perform geostatistical analysis or data interpolation.
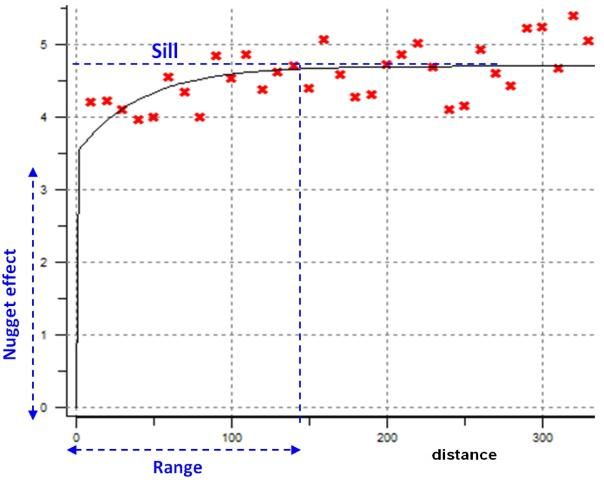
The first product obtained from a geostatistical analysis is the variogram. The variogram is a measurement of how quickly the measured parameters, in this case sampled soil moisture, change according to their distance from one another. The underlying principle is that, on average, two observations closer together are more similar than two observations farther apart. The variogram model mathematically specifies the spatial variability of the data set and the resulting grid file. The interpolation weights, which are applied to data points during the grid node calculations, are direct functions of the variogram model. The variogram includes two independent variables and one dependent variable: sill, range, and nugget, respectively. Figure 2 shows the variogram's components.

Credit: M. Paranhos, UF/IFAS
Nugget effect: The nugget effect is the distance on the Y-axis between the origin and at the point where the fitted model intersects the Y-axis at a positive value. It quantifies the sampling and assaying errors and the short variability (i.e., spatial variation occurring at a distance closer than the sample spacing or representing spatially uncorrelated noise associated with any value of a random variable). The units of the nugget effect are the units of the observation squared.
Range: The range is the distance beyond which the deviation in the values does not depend on distance; hence, values are no longer correlated.
Sill: The sill is the total scale of the variogram (nugget effect + sum of all component scales), and is also the plateau of bounded variograms. The linear, logarithmic, and power variogram models do not have a sill.
Interpreting Variograms
If there is spatial autocorrelation between the sampled points, it should expect the variogram values to increase as the separation distance (X-axis) increases. In most situations, the variogram stops increasing at a given distance, called the range, which can be interpreted as the distance of dependence or the zone of attribute's influence. The nugget effect or discontinuity at the origin of the variogram (i.e., at very small separation distances) arises from measurement errors, sources of spatial variation at distances smaller than the shortest sampling interval, or both. For instance, very high nugget effect indicates a very high variance between close samples. This might be attributed to the soils' natural variability or to management that needs to be further investigated. The parameters obtained from the variogram mentioned above are used to provide confidence in the performed analysis.
Identifying Areas with Homogenous Soil Moisture for Soil Moisture Sensor Placement
The minimum number of soil moisture sensors for irrigation or monitoring of a given area can be estimated by using the range value obtained from the geostatistical analysis. The range value (Figure 2) is where the variogram stops increasing at a given distance, which is interpreted as the maximum distance between sampled points where there is correlation of distance dependence, in this case for soil moisture content. In other words, the range value (expressed in feet) can be translated as the maximum distance between soil moisture sampling points. After the initial soil moisture sampling characterization, future sampling can be conducted on a grid system, where the grid should be half of the range value distance. The range value should be determined for the three predominant soil moisture conditions (from dry to wet soil), and then the values can be compared to each other considering the homogeneity of the area, based on soil moisture maps. The prediction of unsampled areas (spatial prediction) and mapping preparation can be performed by using kriging, which allows the estimation of soil moisture values at an unsampled location, given the soil moisture measured values at neighboring sampled locations. Detailed descriptions of kriging procedures can be found in specific texts, such as Goovaerts (1997), and can be performed with specific software.
Practical Example of Soil Moisture Sensor Determination for Agricultural Areas
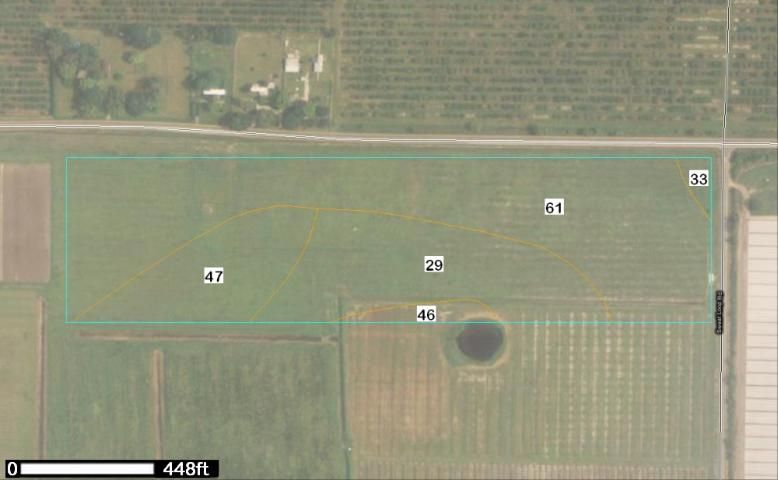
For this example of soil moisture sensor number determination, 26.6 acres of perennial pasture located in Hillsborough County, Florida, was chosen. Figure 3 shows the aerial photograph of the area and identifies the soil series.

Credit: USDA-NRCS (http://websoilsurvey.nrcs.usda.gov/app/HomePage.htm).
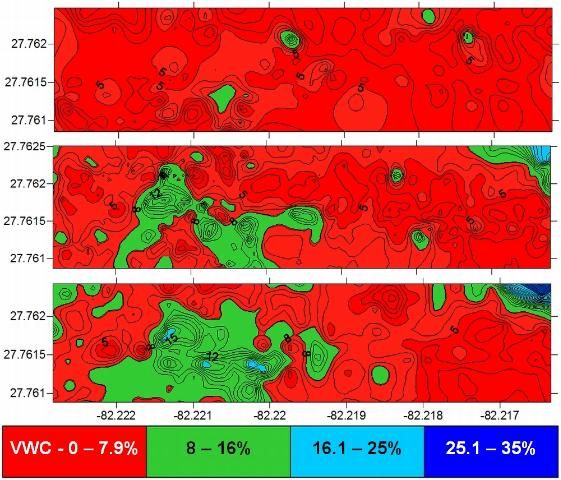
Figure 4 shows the soil moisture distribution map for three different soil moisture conditions. The dry condition (Figure 4, top graph) was characterized by the percentage of the sampled points below 7.9% volumetric water content (VWC). In this case, 94.7% of the points were below the VWC threshold, while only 5.3% of the sampled points were between 8% and 15% VWC range. For the medium soil moisture condition evaluation (Figure 4, center graph), about 20% of the area sampled was characterized by medium soil moisture conditions. The sampling was performed 2 days after 1.4 inches of precipitation. Another soil moisture variability evaluation was performed after 3.43 inches of rainfall in the 3 previous days, characterizing a wet soil moisture condition (Figure 4, bottom graph).

Credit: M. Paranhos, UF/IFAS
For the area of this example, three soil moisture conditions were evaluated in terms of spatial soil moisture distribution patterns (dry, medium, and wet conditions). For irrigation and crop management purposes, the soil moisture maps were used to identify homogenous area. These areas are called management zones, and they should be managed independently for irrigation based on soil moisture and crop water requirements. For those areas, the fixed soil moisture sensors located in the management zones could be used to periodically monitor the soil moisture or automatically drive the irrigation valves.
Based on graphs of soil moisture distribution, three management zones were identified (Figure 5) for the studied area. Because of their soil moisture characteristics, the three zones should be managed independently for irrigation purposes. Zone I was characterized by drier soil moisture conditions than Zones II and III. The estimated area of Zone I was 16 acres, followed by 9.4 and 1.2 acres for Zones II and III, respectively. Zones I and II could be monitored by one or two soil moisture sensors placed at convenient points within each management zone. Because of its small area, a single moisture sensor could monitor Zone III, or alternatively, area drainage could be improved and, depending on a future soil moisture characterization, the area could be incorporated into Zone I or II accordingly.

Credit: L. Zotarelli, UF/IFAS
When determining irrigation management zones, one should also consider irrigation method and design. Irrigation management zones with irregular shapes may not be practical and could be hard to manage. Therefore, adequate distribution of irrigation management zones within irrigation design may be crucial to irrigate the crops according to the soil moisture holding capacity of each zone.
Summary
Datasets of soil moisture can be investigated from a geostatistical point of view in relation to spatial soil water distribution in different predominant soil moisture conditions. Repeated soil moisture measurements over several drying/wetting cycles are necessary to access spatial soil moisture patterns and confidently evaluate the required number of soil moisture sensors for a given area. For the TDR measurement procedure, the first sampling should be performed under a high density of measured points using small-grid sampling. Further moisture sampling plans can be developed based on the first sampling. Sampling can be conducted on a grid system, where the grid should be half of the range value distance. After the homogenous soil moisture areas are mapped, these areas can be identified as management zones and managed independently for irrigation based on soil moisture and crop water requirements. For those areas, the fixed soil moisture sensors could be used to periodically monitor soil moisture or for automated irrigation systems.
References
Goovaerts, P. 1997. Geostatistics for Natural Resources Evaluation. Oxford, England: Oxford University Press.
Mann, K. K., A. W. Schumann, T. A. Obreza, W. G. Harris, and J. B. Sartain. 2012. How to Characterize Soil Variability in Florida Citrus Groves as It Relates to Tree Growth and Yield. SL556. Gainesville: University of Florida Institute of Food and Agricultural Sciences. https://edis.ifas.ufl.edu/ss557