Lettuce in Florida
The Florida lettuce industry ranks 3rd among all states in the United States (Figure 1), generating $70–$80 million annually (USDA Ag Census 2017). The majority of Florida’s lettuce is planted on approximately 10,000 acres of rich organic soil, known as “muck,” in the Everglades Agricultural Area (EAA), where it is used as a rotation crop between sugarcane, rice, sweet corn, turf, and other commodities. During the cooler months of September and April, lettuce producers primarily plant iceberg, romaine, and Boston for whole-head markets (Figure 2), as well as baby leaf lettuces (Figure 3) to satisfy many types of lettuce markets along the US East Coast and Canada. This publication is intended for county Extension faculty, leafy vegetables stakeholders, and members of the public interested in understanding the nutritional benefits that lettuce provides. The article explains which nutrients are abundant among the major lettuce types compared to other leafy vegetables, encourages consumers to help satisfy dietary recommendations by eating lettuce at appropriate serving sizes, and outlines the basic growing conditions that help maximize its nutrition as a crop.
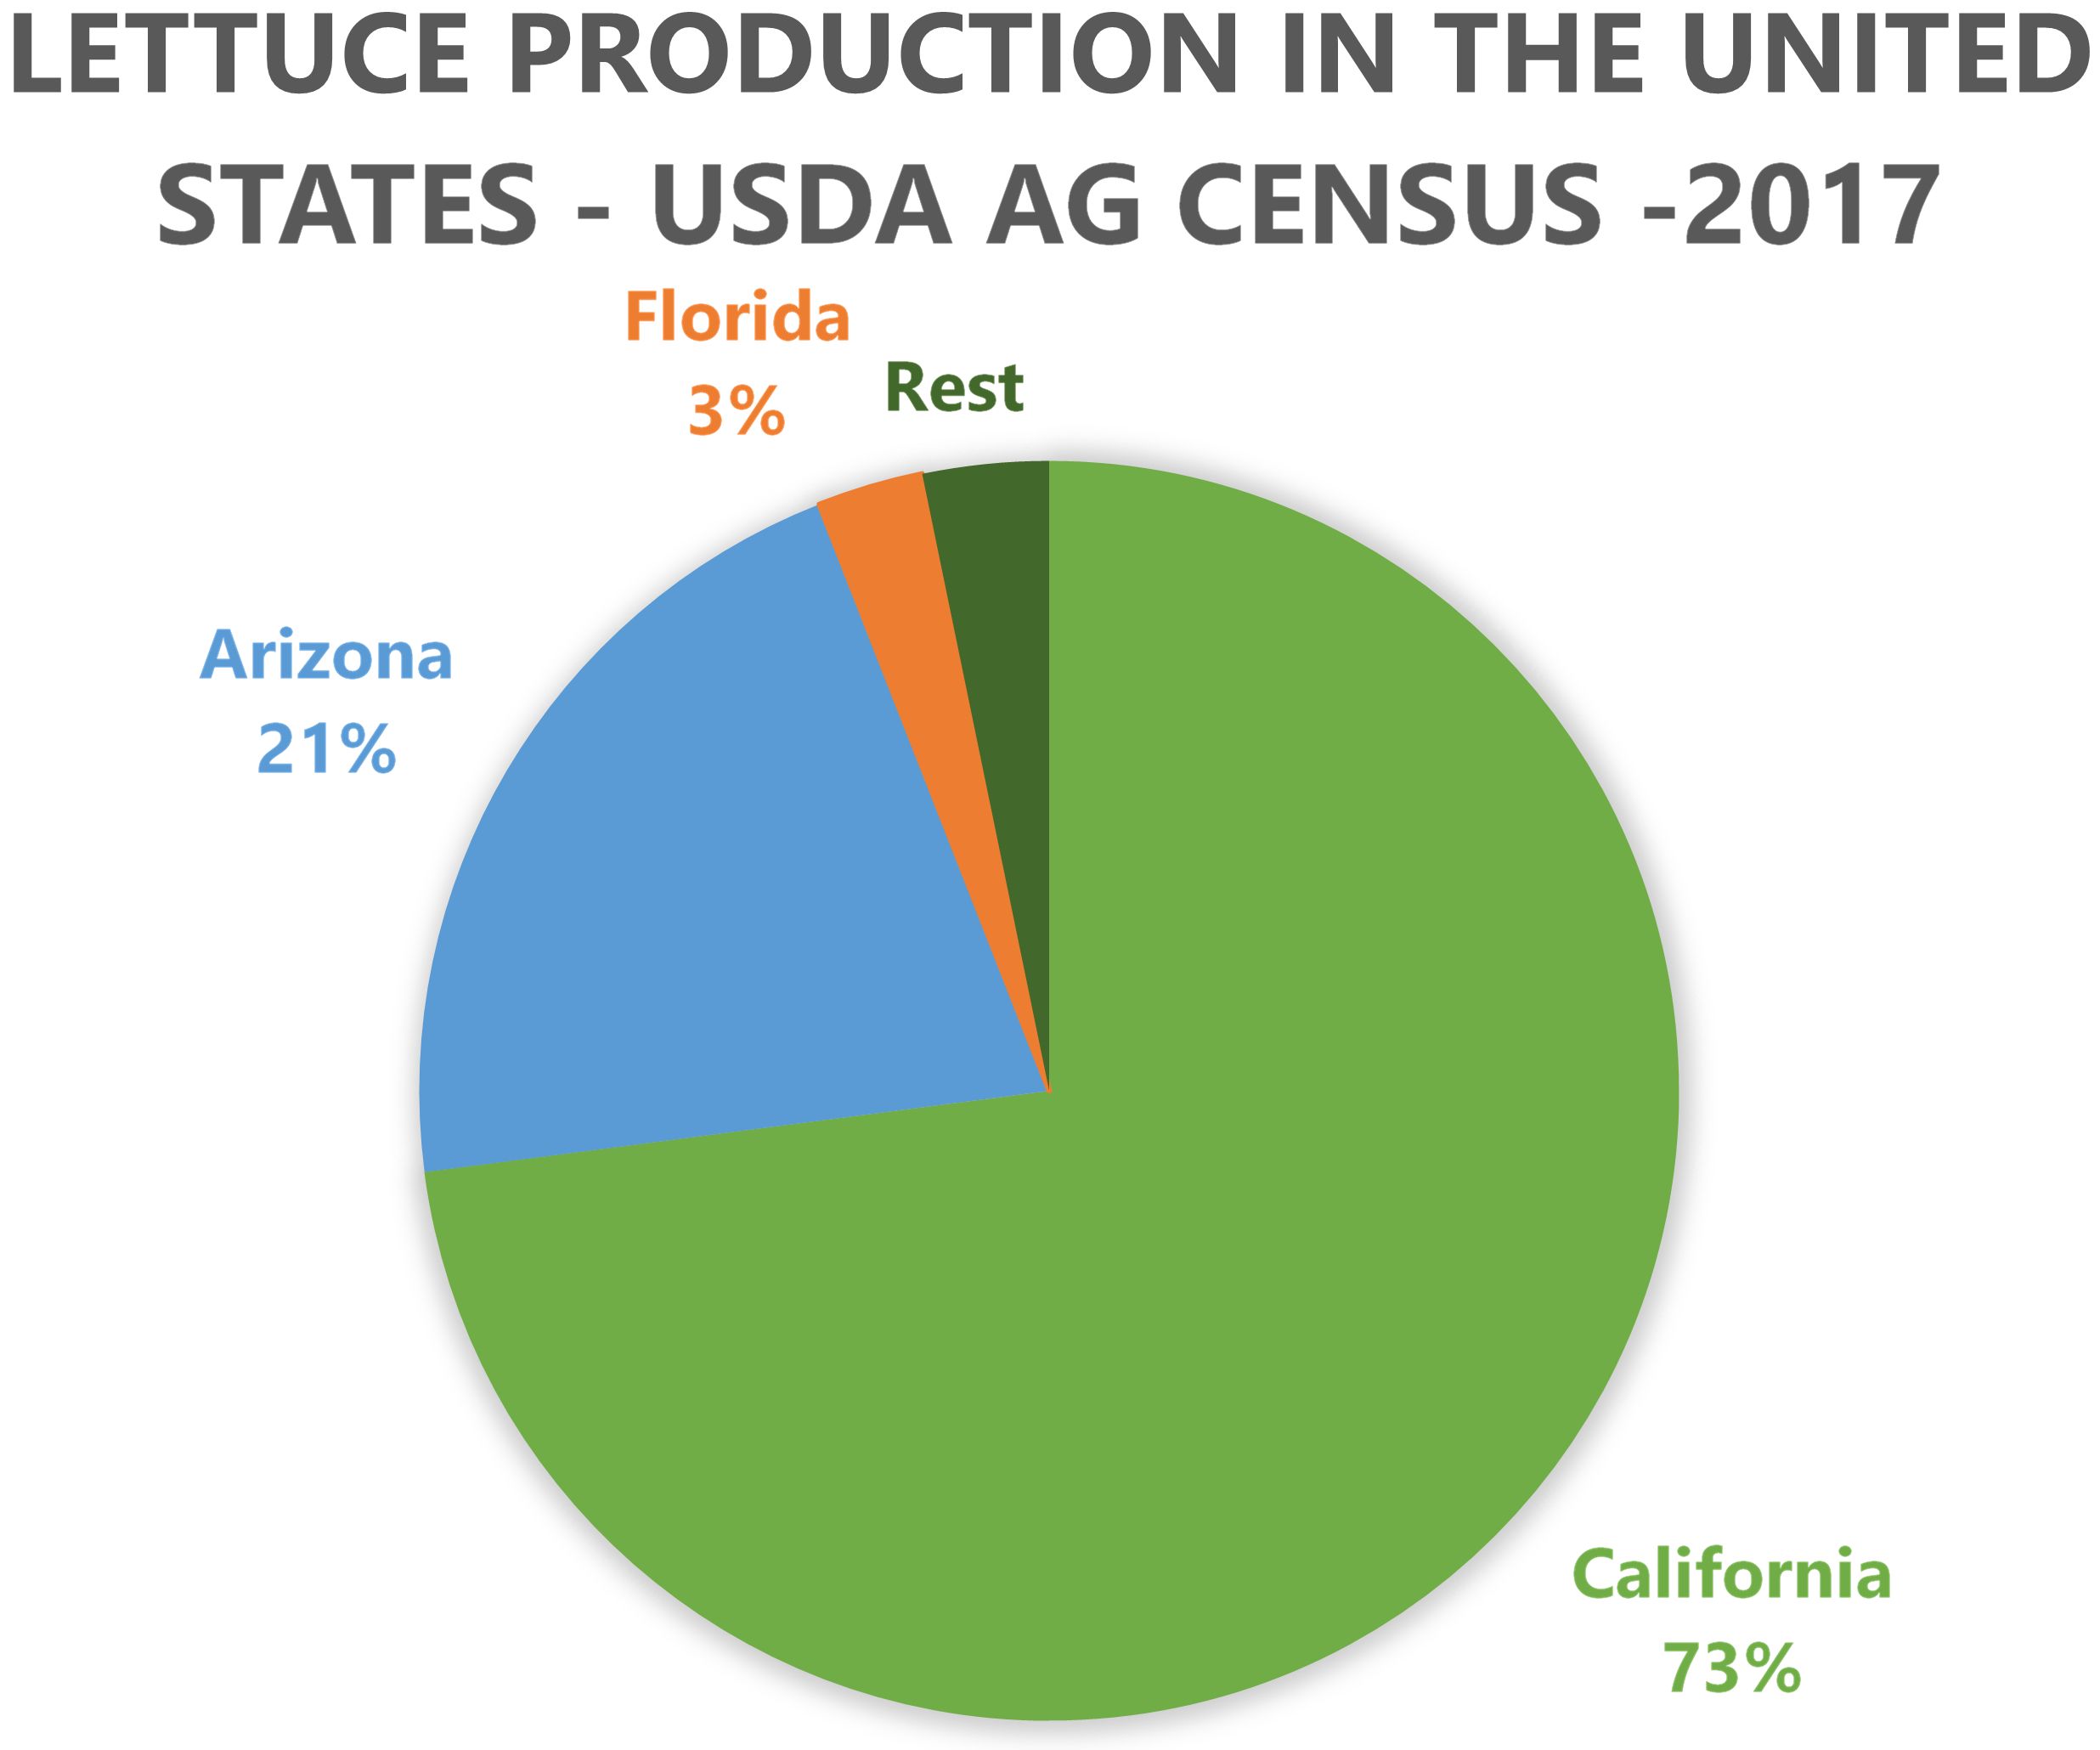
Credit: Source: https://www.nass.usda.gov/
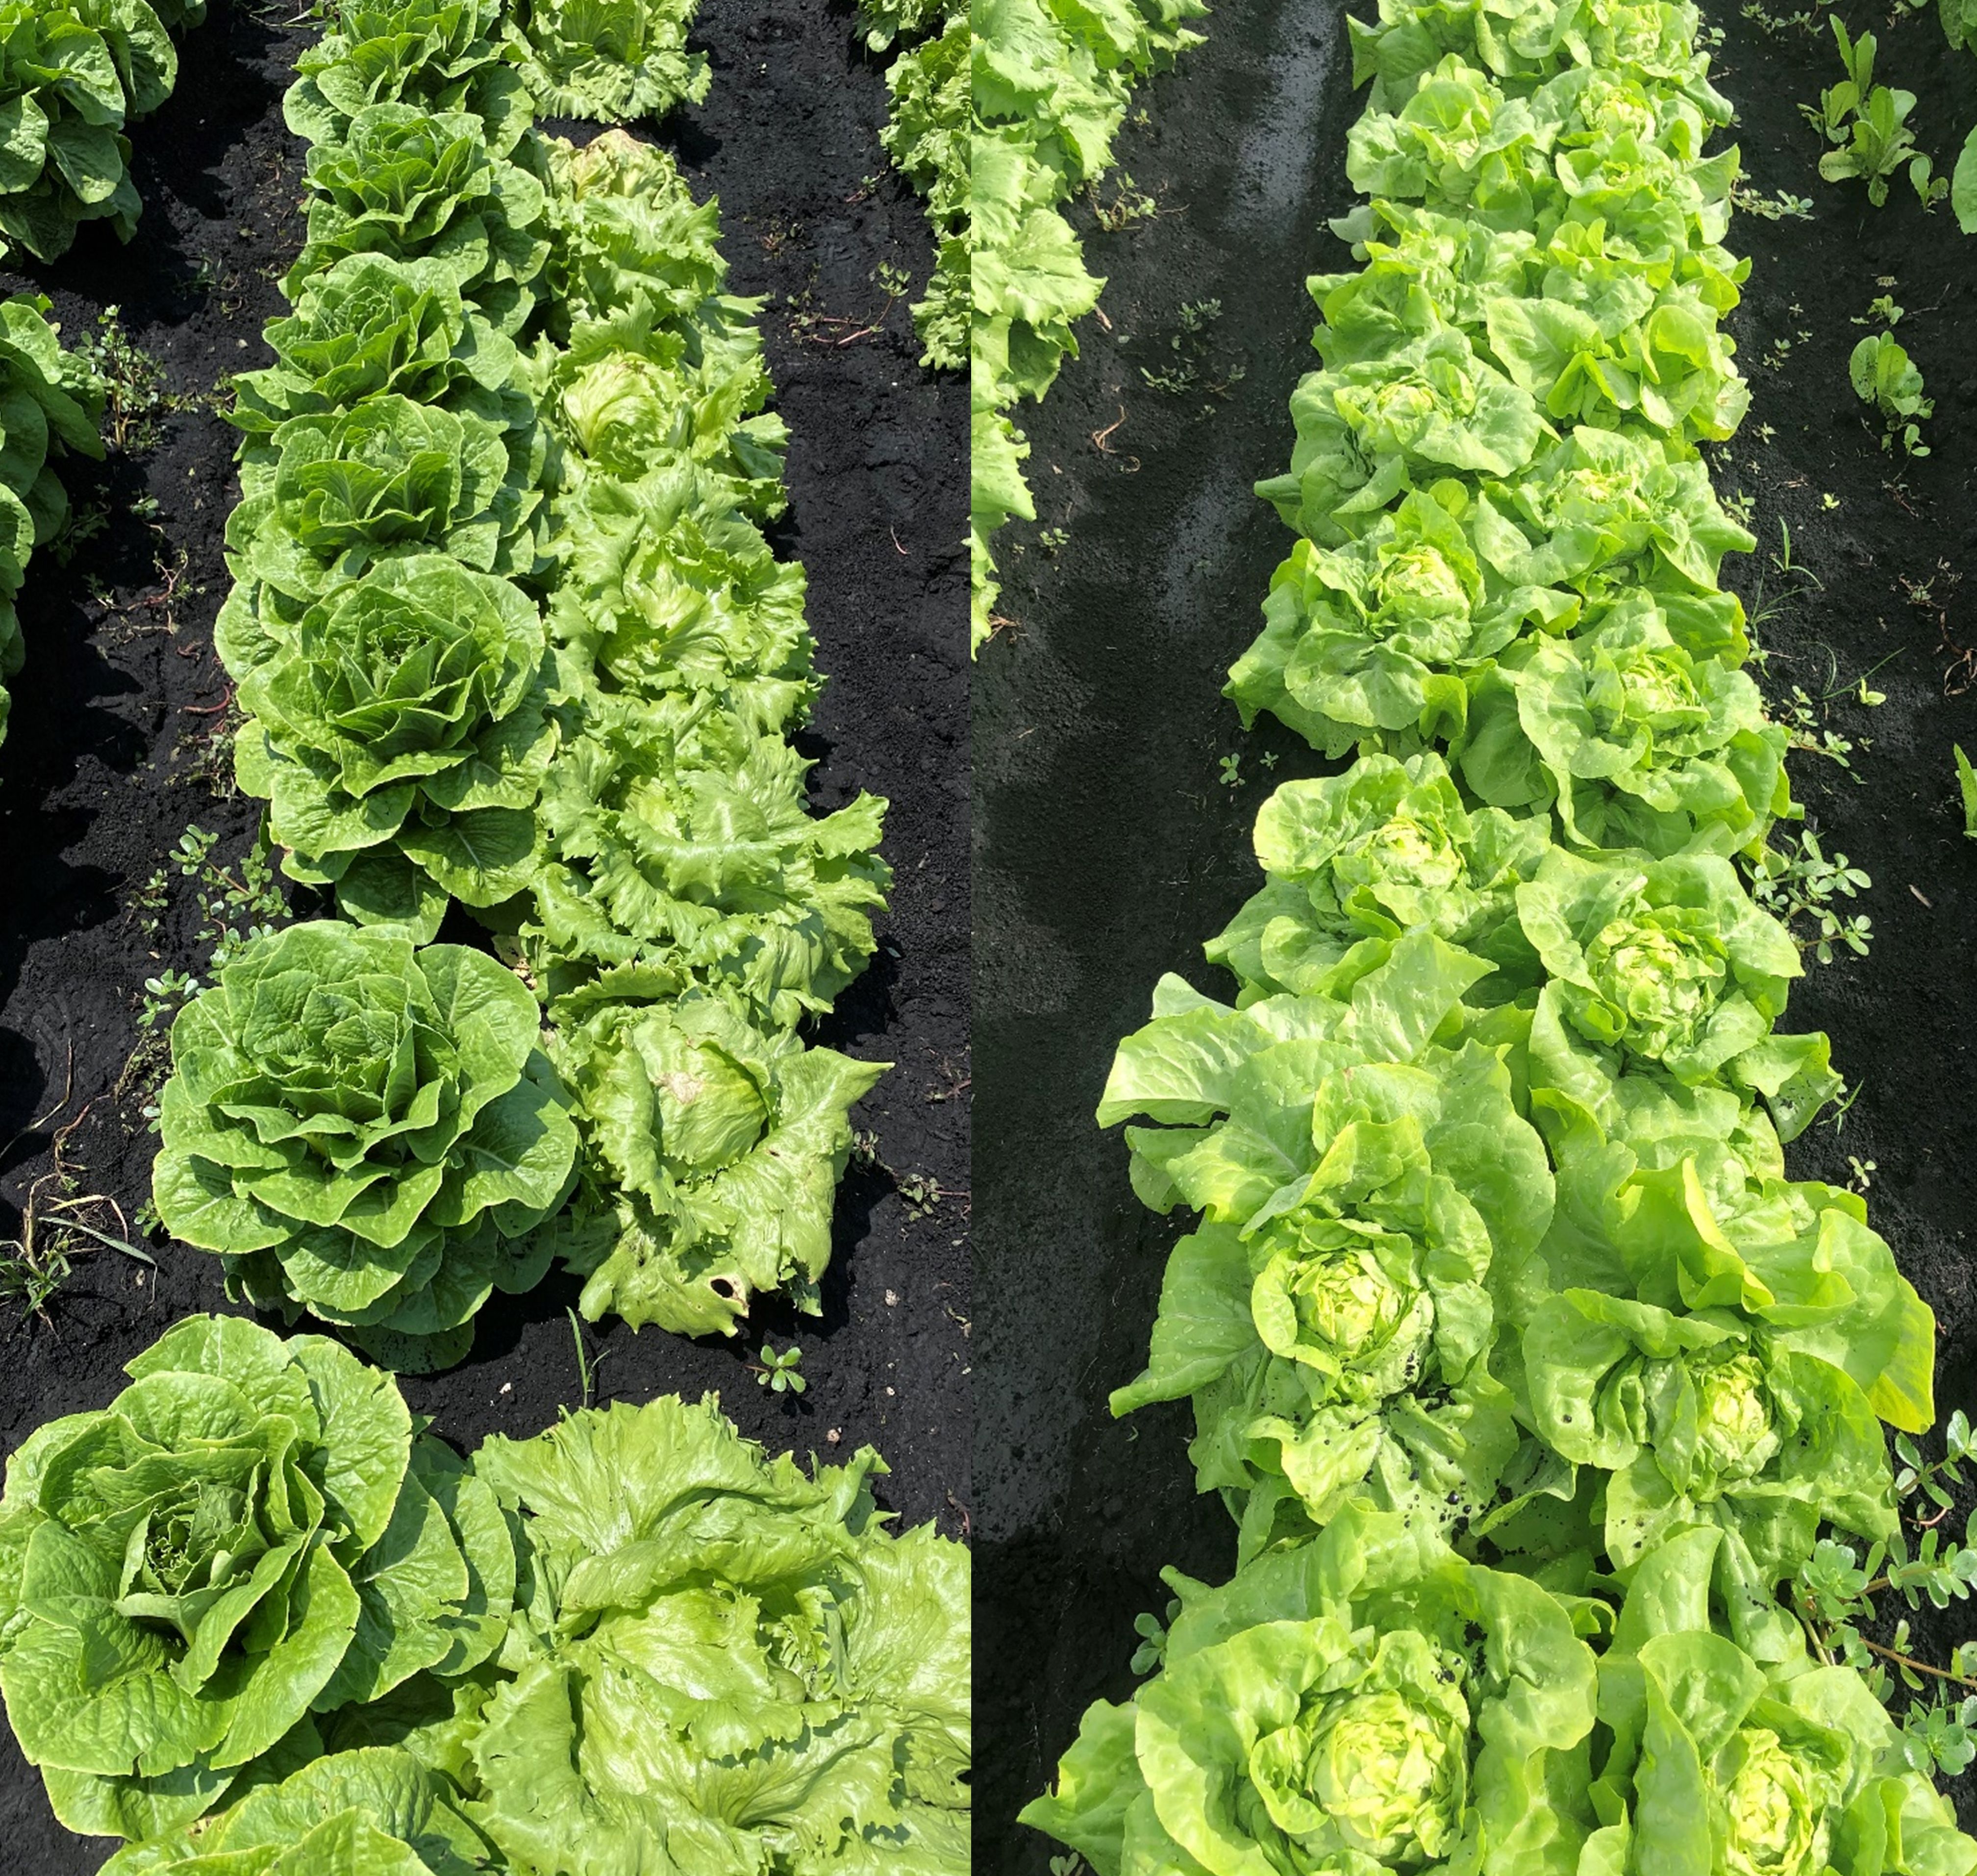
Credit: UF/IFAS Lettuce Breeding Program
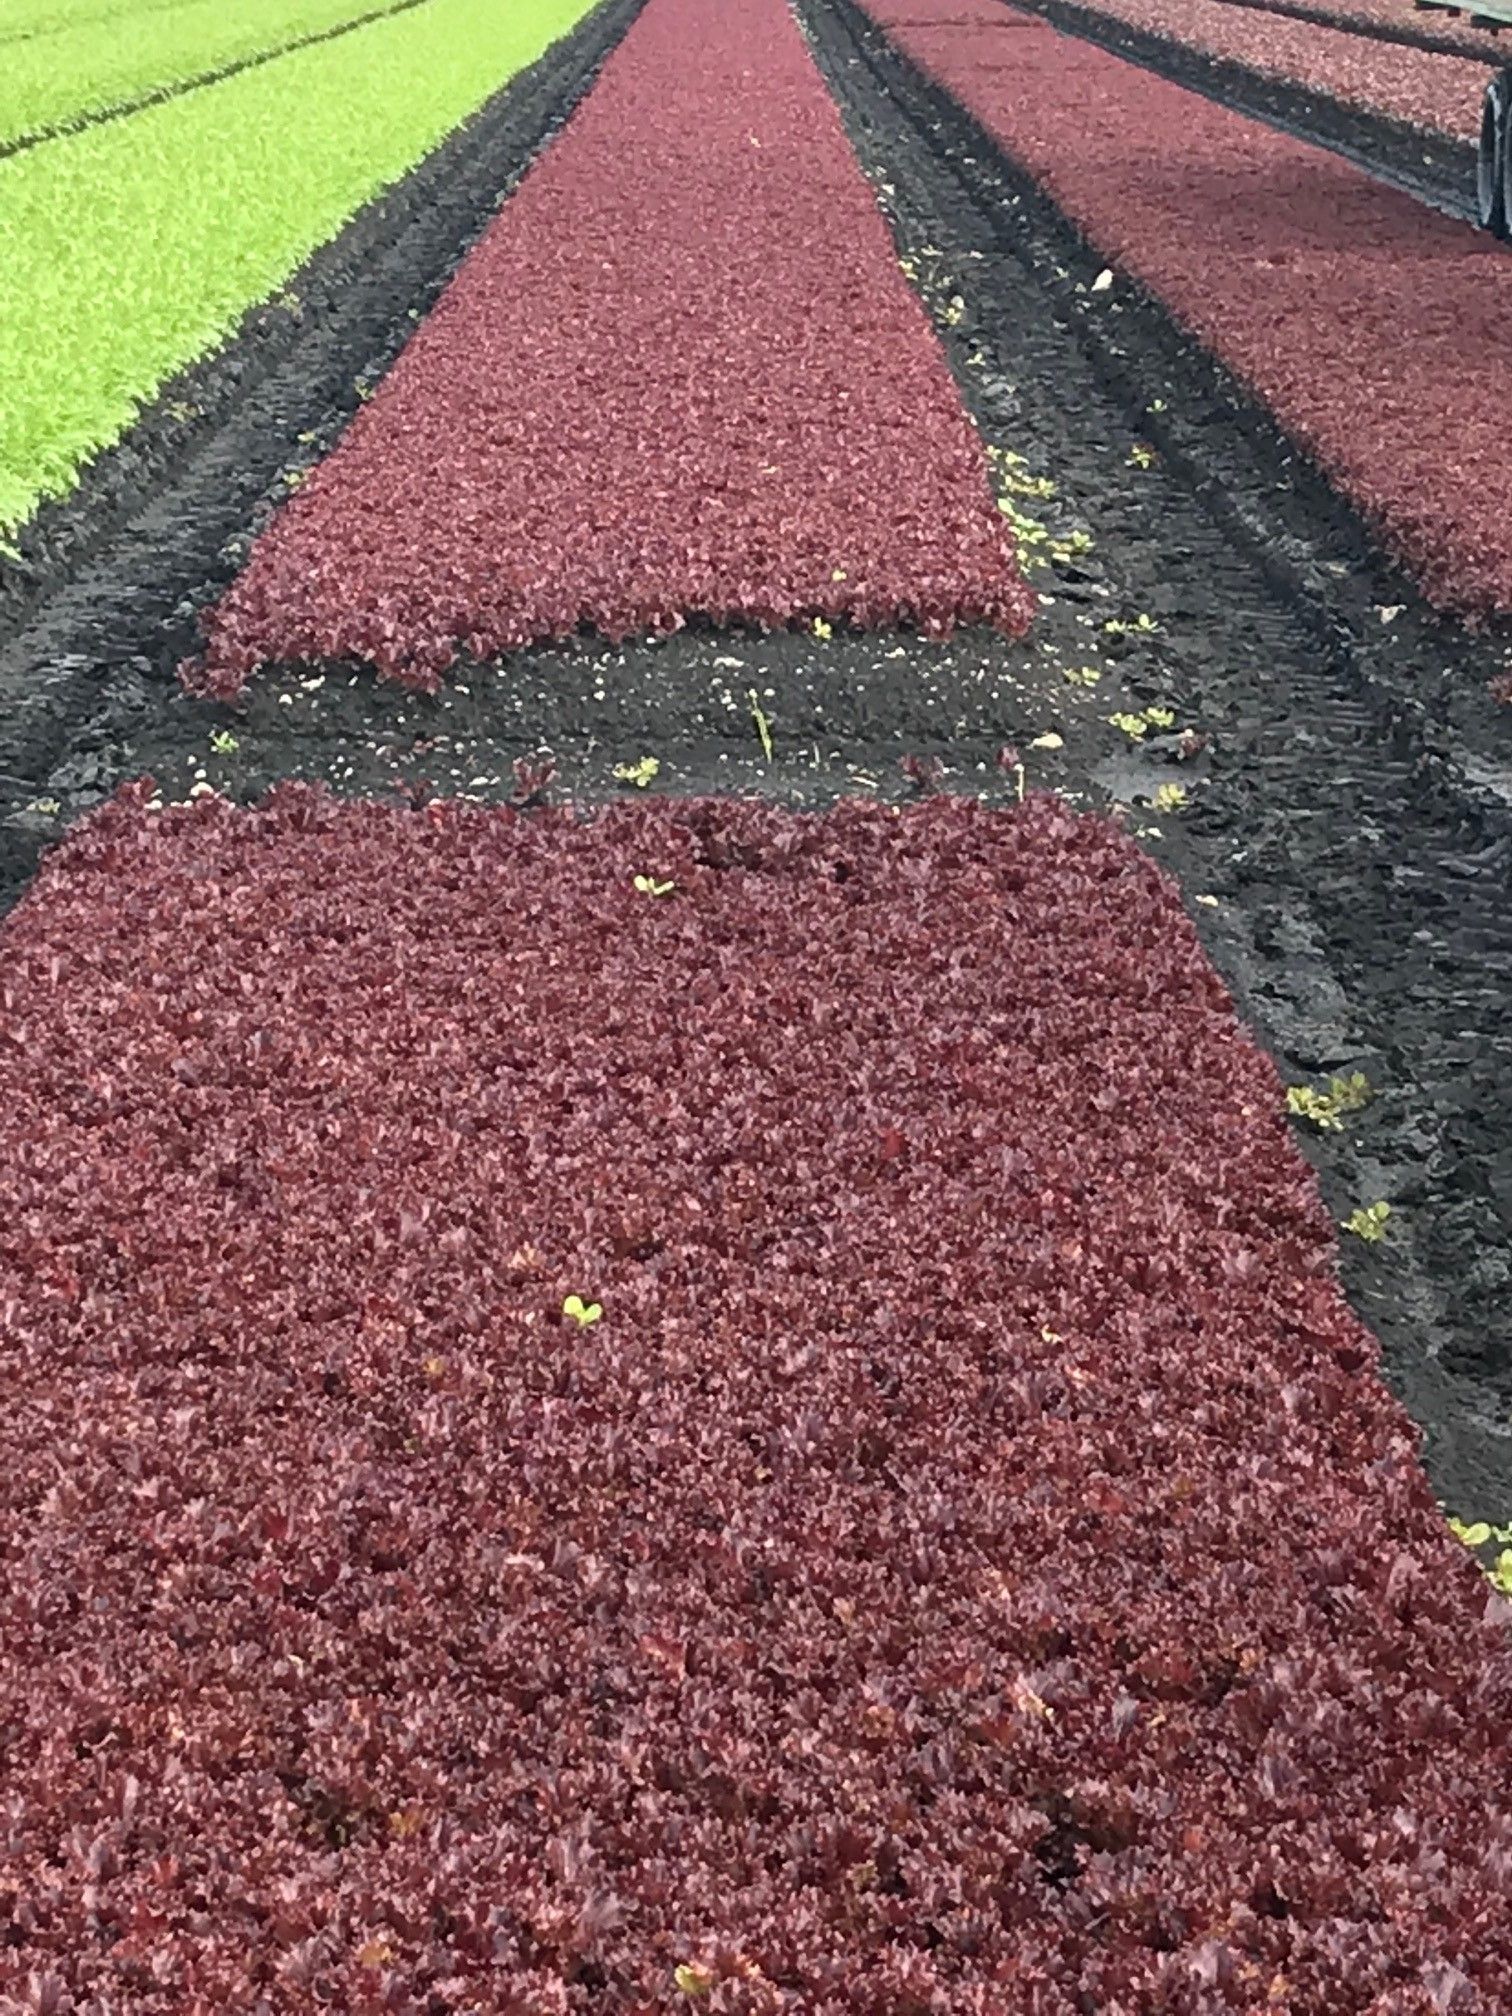
Credit: UF/IFAS Lettuce Breeding Program
While the Florida agriculture industry is recognized for supplying a substantial quantity of lettuce to nearby markets during winter months, its contribution to people’s diets may be underappreciated. Lettuce may often be portrayed as a garnish to cuisines, such as sandwiches, or even as simply a carrier for more nutritious or palatable foods in salads. However, lettuce is the second most consumed vegetable in the United States, averaging 32.8 lb per capita, and therefore contributes substantial amounts of several vitamins and minerals to our diets.
Comparison of Important Dietary Nutrients among Lettuce and Other Leafy Vegetables
Lettuce vitamin contents depend on the type of lettuce and growing conditions, but in general, many lettuces supply a significant amount of Vitamin A and Vitamin K to human diets (Table 2). Iceberg lettuce, however, is a relatively poor source of Vitamin A (Table 2). Romaine, butterhead, and stem lettuces also supply meaningful amounts of folic acid (Tables 1 and 2). Regarding minerals, romaine, iceberg, and stem lettuces supply a substantial portion of potassium; additionally, romaine and butterhead lettuces can include modest amounts of iron, especially when multiple servings are eaten (Tables 3 and 4). As shown in Tables 2 and 4, Vitamin C, calcium, and magnesium contents of lettuce are low as compared to those of spinach and kale. Furthermore, lettuce, spinach, and kale do not contribute a significant portion of Vitamin E and zinc to the diet (Tables 2 and 4).
Table 1. Recommended Dietary Allowances (RDA) (%) for men and women aged 19–50 for various vitamins among different lettuce types and leafy vegetables based on standard one-cup serving sizes. One cup is equivalent to 47 g romaine, 36 g green leaf, 28 g red leaf, 55 g butterhead, and 72 g iceberg lettuces, as well as 30 g spinach and 21 g kale. Sources: SR Legacy Data from USDA (2019) and IOM (2011).
Table 2. Content of important dietary vitamins for lettuce, spinach and kale expressed as milligrams per 1 cup fresh vegetable. Vitamin A is reported as IU per 1 cup fresh vegetable.
One cup is equivalent to 47 g romaine, 36 g green leaf, 28 g red leaf, 55 g butterhead, and 72 g iceberg lettuces, as well as 30 g spinach and 21 g kale.
Source: SR Legacy Data from USDA (2019).
Table 3. Recommended Dietary Allowances (RDA) (%) for men and women aged 19–50 for various minerals among different lettuce types and leafy vegetables based on standard one-cup serving sizes. One cup is equivalent to 47 g romaine, 36 g green leaf, 28 g red leaf, 55 g butterhead, and 72 g iceberg lettuces, as well as 30 g spinach and 21 g kale.
Sources: SR Legacy Data from USDA (2019) and National Academies of Sciences, Engineering, and Medicine (2019).
Table 4. Content of important dietary minerals for lettuce, spinach, and kale expressed as milligrams per 1 cup of fresh vegetable. Vitamin A is reported as IU per 1 cup fresh vegetable. One cup is equivalent to 47 g romaine, 36 g green leaf, 28 g red leaf, 55 g butterhead, and 72 g iceberg lettuces, as well as 30 g spinach and 21 g kale.
Source: Source: SR Legacy Data from USDA (2019).
Factors Contributing to an Underestimated Nutritional Value in Lettuce
Water Content in Lettuce
Lettuce contains around 95% water, compared to spinach’s approximately 91% and kale’s 85%. This means that the nutrients found in lettuce are distributed across a much greater volume of plant tissue because the nutrients are, in effect, diluted by the water content. In fact, many lettuce types are not nutrient poor, but rather the portion sizes of many salads and garnishes are too small to obtain adequate nutrition (Figure 4). This may also contribute to a lack of satiety after eating what appears to be a normal salad portion. In order to obtain adequate nutrition, the US Department of Health and Human Services recommends eating a minimum of 2.5 cups of vegetables each day. Therefore, eating larger quantities of lettuce may supply significant nutrition and may also offset the amount of other calorie-dense foods eaten at the same meal.
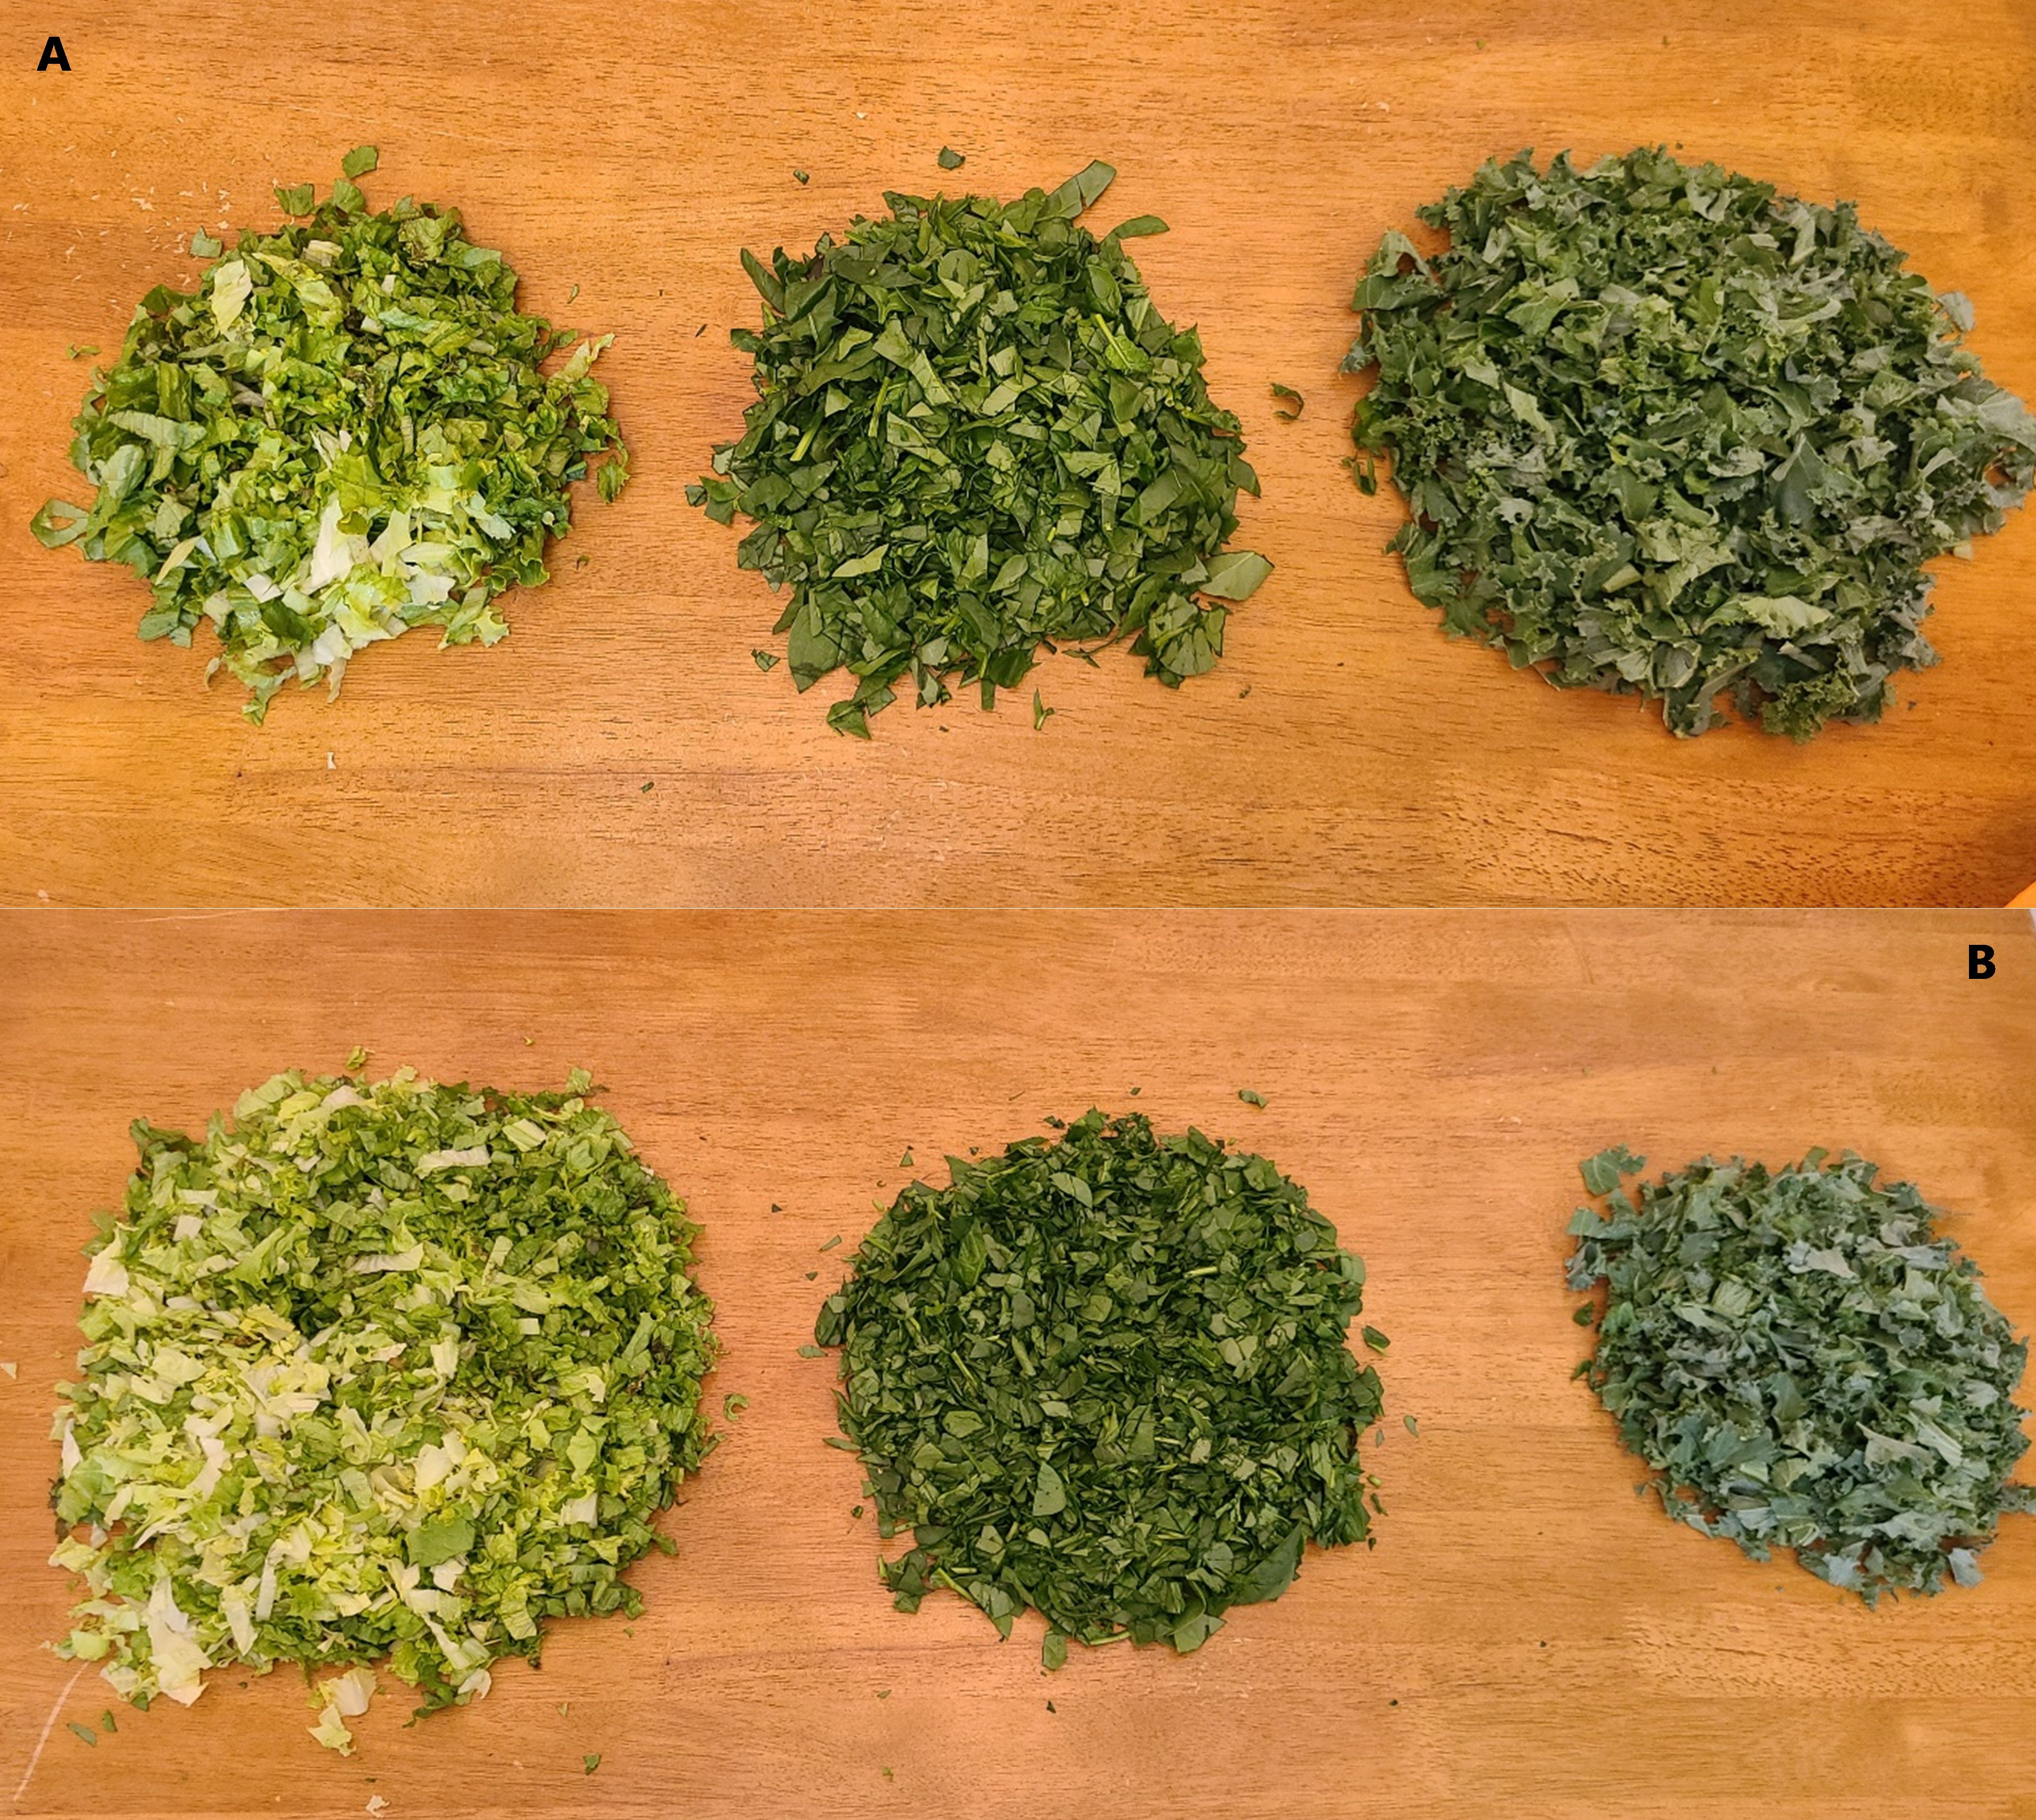
Credit: Jesse Murray, UF/IFAS
Raw versus Cooked Lettuce
Another factor that inhibits consumption of appropriate quantities of lettuce is that it is almost exclusively eaten raw, whereas many other dark leafy greens, for example kale and spinach, are amenable to cooking and juicing. While cooking reduces their volume substantially and allows for a greater quantity to be eaten, it also reduces the bioavailability of several common vitamins, such as Vitamin C and various B vitamins (Schönfeldt and Pretorius 2011; Selman 1994).
Lettuce does not benefit from this optical illusion, however, because it is rarely cooked in American cuisines. As a result, most people are not able to appreciate the fact that a large serving of lettuce is similarly reduced to a fraction of its fresh weight size upon digestion. Thus, an old adage is reversed: “your stomach is bigger than your eyes.” Allowing your stomach to do the work of a steamer or sauté pan also preserves many of the heat-sensitive nutrients contained in lettuce. Therefore, the fact remains that eating large portions of lettuce salads, in conjunction with other leafy vegetables, can greatly enhance modern diets. Combining leafy vegetables is most notable in current premixed packaged salads, such as those marketed as “baby leafy greens.”
Nutritional Limitations of Iceberg Lettuce
Consumer preferences for different lettuce types in the United States have changed over the last three decades. Prior to the 1990s, the predominant lettuce type produced was iceberg due to its ease of transportation and storage. Nowadays, romaine and leaf lettuce represent 35% and 22% of the national production, respectively. While head lettuce, including iceberg, still represents around 35% of US lettuce production, it is poorer in nutrients when compared to other lettuce types and leafy vegetables. Mou and Ryder (2002) have concluded that this nutrient deficiency marring iceberg lettuce is not due to a lack of genetic potential, but rather from its morphological development. As lettuce grows from the initial rosette structure, it produces outer leaves first, then initiates young leaves within its inner whorl. While the outer leaves of other lettuce types remain open and expose the inner developing leaves to sunlight, iceberg lettuces, by definition, develop a closed head in which the inner leaves are completely shielded by outer leaves and never exposed to sunlight. Lack of sunlight reaching the inner head blocks the environmental cues that turn on genes responsible for creating antioxidants and vitamins that protect the leaves’ photosystems from excessive UV light (Mou and Ryder 2002), consequently suppressing the amount of nutrients available to human diets. While potential exists for breeding iceberg lettuces with improved nutrition within these constraints, consumers have also increasingly elected to purchase the more nutritious lettuce types, as previously mentioned.
Stem Lettuce: A Richer Nutrient Lettuce Type Cultivated in China
It should also be noted that China is the world’s largest lettuce producer (more than four times the quantity of the United States), accounting for approximately 63% of global lettuce production in 2018, as compared to 15% for the United States (FAOSTAT 2020). The predominant type of Chinese lettuce is stem lettuce (also known as stalk lettuce or celtuce) (Figure 5), which is almost absent in other countries, including the United States. Stem lettuce is comparable to other lettuce types with respect to Vitamin A, folic acid, and calcium contents (Tables 2, 4, and 5); however, it contains roughly twice as much potassium and magnesium (Tables 4 and 5). More significantly, given adequate soil fertility, stem lettuce may contain up to five times the amount of Vitamin C as other lettuce types (Tables 2 and 5). Stem lettuce could provide an important addition to the US leafy vegetable market and help contribute several key nutrients to western diets.
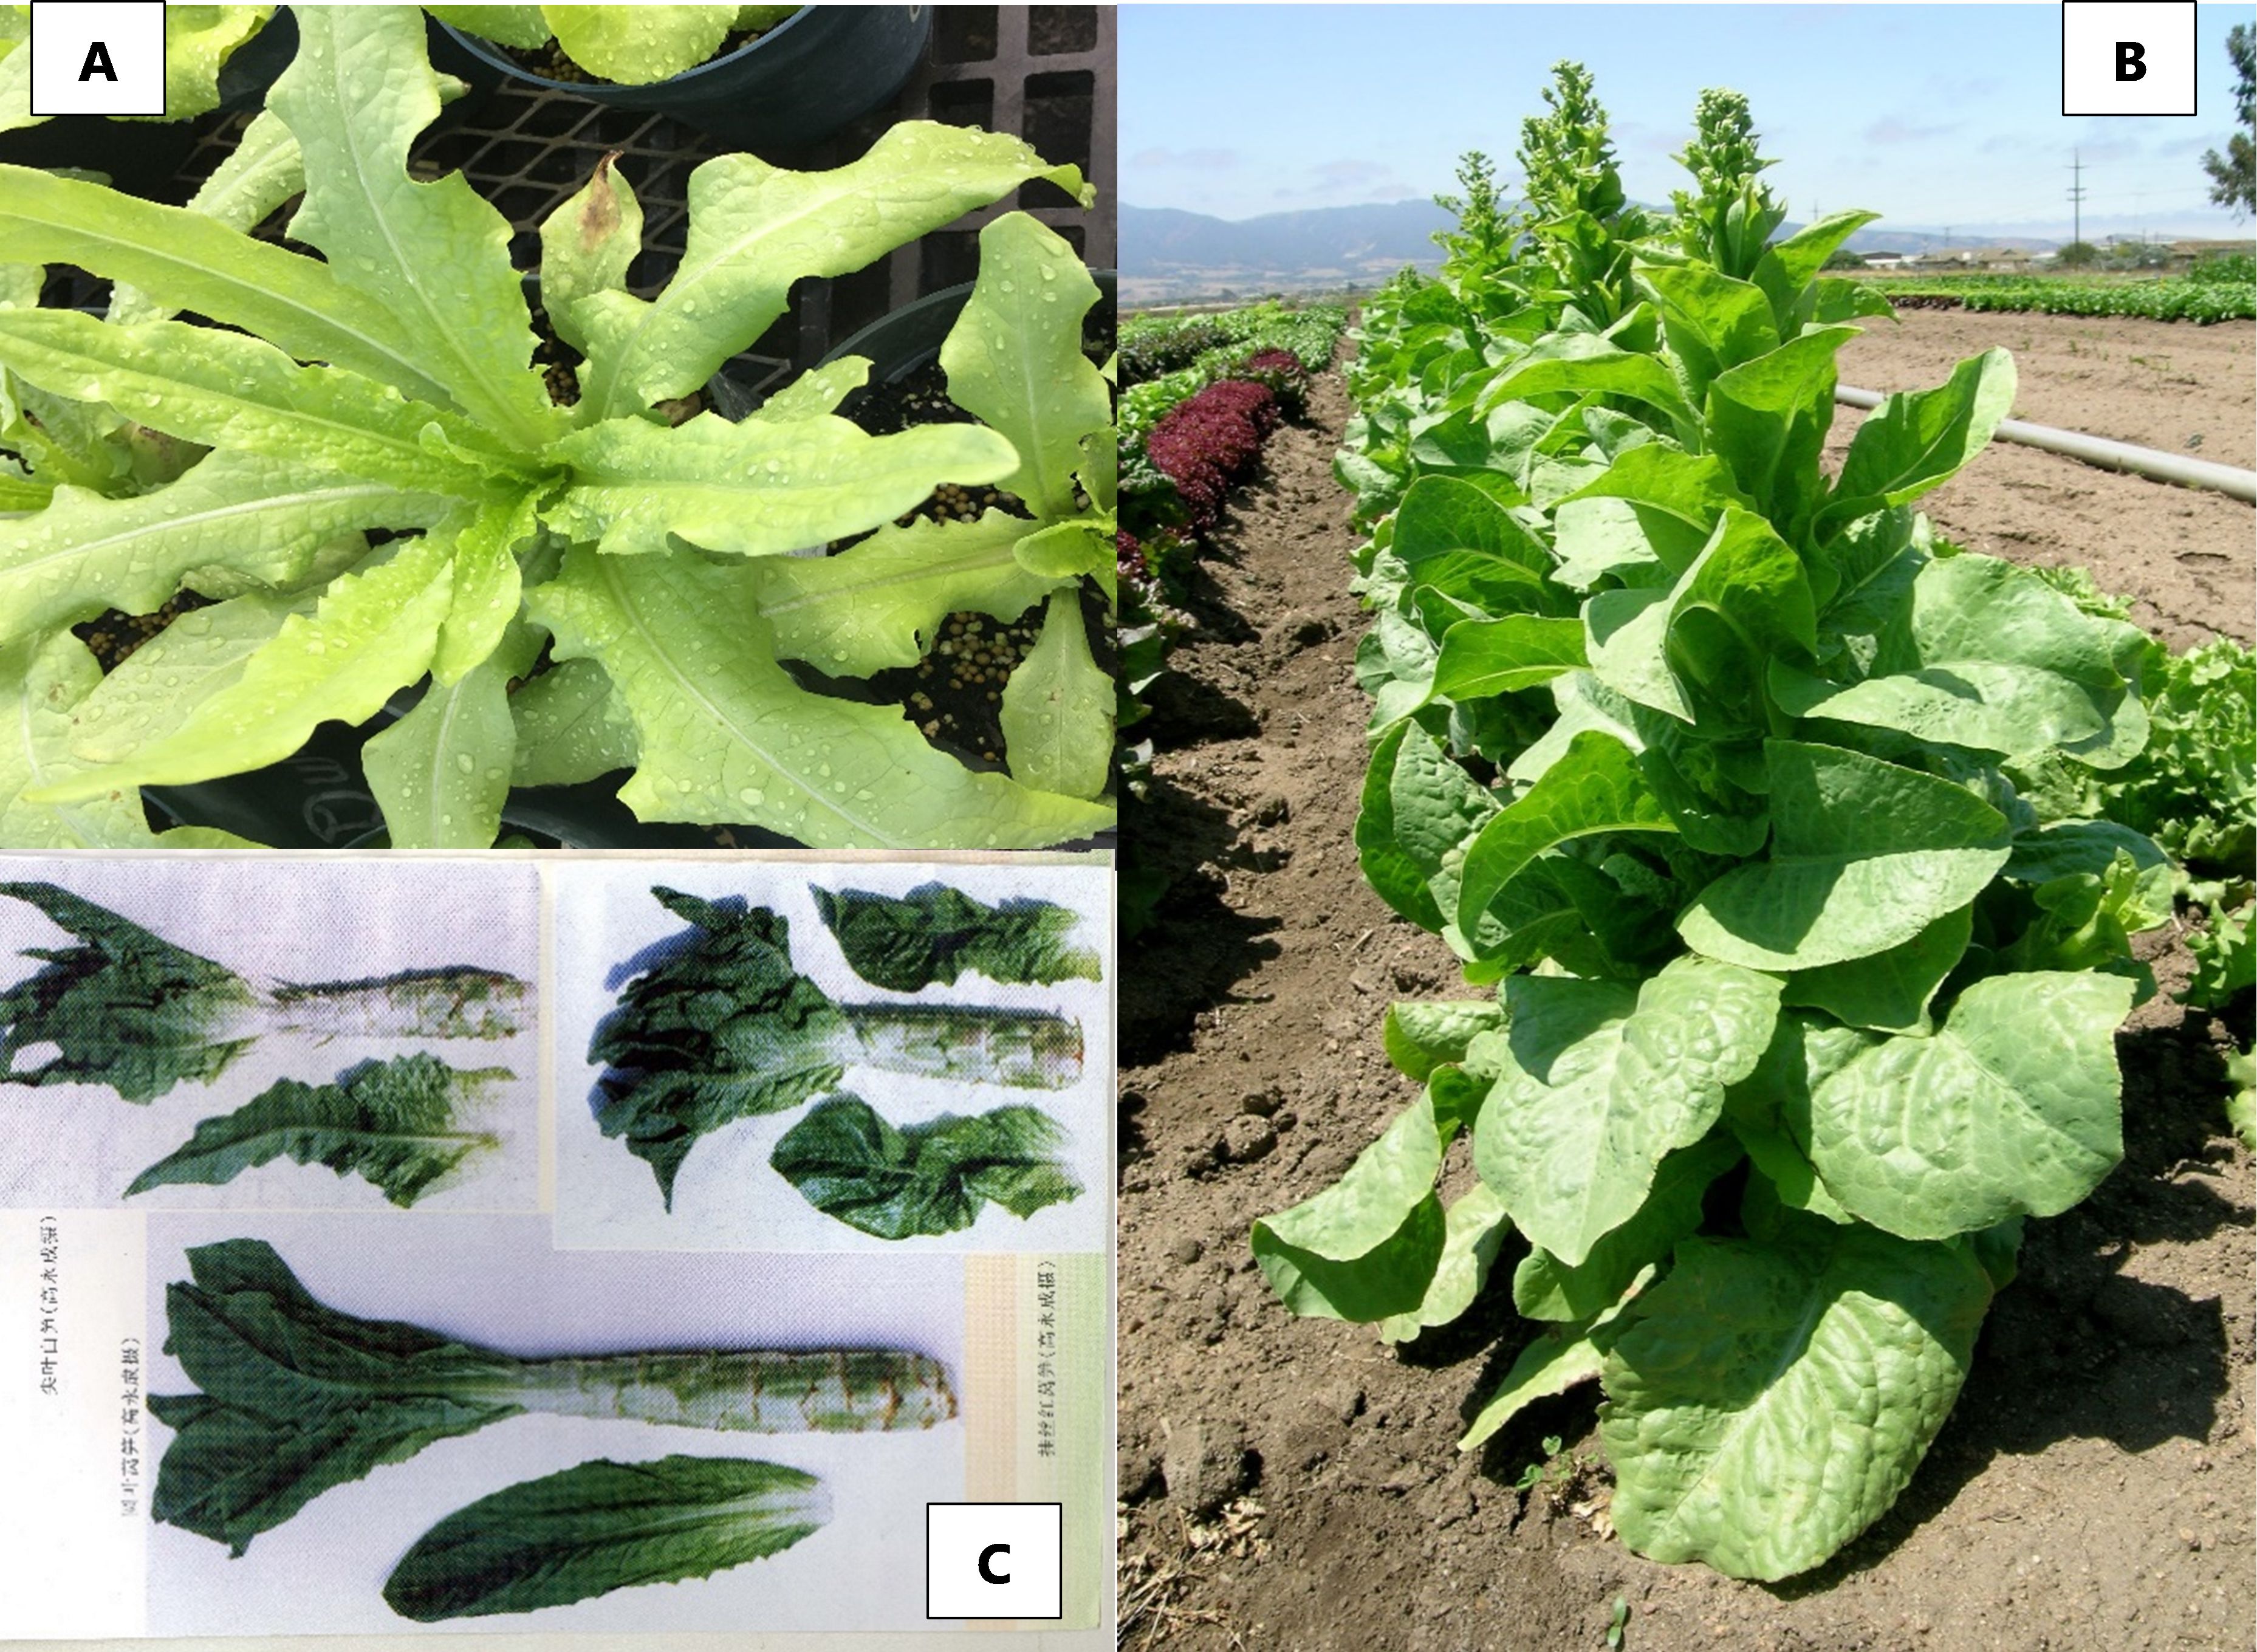
Credit: (A) UF/IFAS Lettuce Breeding Program. (B) Beiquan Mou, USDA-ARS Salinas, CA. (C) Reprinted with permission from Lu (2000)
Table 5. Content of important dietary vitamins and minerals for stem lettuce reported as milligrams per 100 grams fresh weight, except for Vitamin A, which is reported as IU.
Source: Still (2007)
Environmental Effects
Environmental conditions and management practices are another factor that influence the nutritional value of lettuces. In general, adopting practices that promote marketability (plants with acceptable color, shape, and uniformity) and high yield will tend to maximize nutritional value. For example, in order for healthy plants to obtain the correct amount of minerals required for growth, it is recommended that soil pH be maintained between 6.5 and 7.2 with the addition of soil amendments when necessary (Subbarao et al. 2017). Furthermore, when soils are maintained at an optimal, slightly acidic to neutral pH, soil types with a finer texture comprised of a combination of clay, silt, loam, and/or organic matter will have a greater potential to provide minerals to plants than coarser, sandier soils (Pinto et al. 2014). Adequate mineral nutrition enhances lettuce nutritional value and serves important roles in the structure and synthesis of many vitamins (Mou 2009). Muck soils in much of the Everglades Agricultural Area have a high, fine organic matter content and therefore may have an advantage in producing high-nutrient lettuce when compared to lettuce produced elsewhere in coarser soils.
Ultraviolet radiation and temperature are two other environmental factors that have a significant influence on lettuce nutrition, particularly Vitamin A and antioxidants. Together, these compounds have been demonstrated to reduce harmful free radicals in the body (Harsha et al. 2013), leading to reductions in cholesterol and diabetes markers in mice studies, as well as correlations to reduced incidences in colorectal and lung cancer in humans (Kim et al. 2016). Lettuce grown in open fields exposed to maximum amounts of ultraviolet sunlight tend to have higher quantities of Vitamin A and antioxidants as compared to lettuce grown under shelters or greenhouses (Sytar et al. 2018). Lettuce antioxidants tend to be reduced by temperatures outside lettuce’s optimal growing range of 65°F–77° F during the day and 50°F–60°F at night, regardless of growing environment (Subbarao et al. 2017; Sytar et al. 2018). Nevertheless, it remains to be studied whether heat-tolerant lettuces, such as those promoted in Florida and contained within the UF Lettuce Breeding Program might still possess comparable quantities of these compounds despite frequent exposure to temperatures at the upper limits of lettuce’s bolting tolerance.
Remarks
- Consuming large quantities of lettuce may be difficult to promote relative to the hyperpalatable foods advertised and promoted in our society. However, disseminating the substantial nutrient value of lettuce could help motivate people to increase and appreciate lettuce consumption, thus aiding in a reduction in nutrient deficiencies.
- The bioavailability of some vitamins in leafy greens are diminished when cooked or processed compared to lettuce consumed raw.
- Consumption of lettuce types has switched in the last three decades. Until the 1990s, lettuce production was mostly iceberg, but nowadays the more nutritious romaine and leaf types represent 35% and 22% of the national production.
- Other uses, as in the baby leaf industry, offer the possibility to mix lettuce with other leafy vegetables that are high in additional nutrients.
- Nontraditional types like stem lettuce offer the opportunity to provide more nutrients as presented in Table 3.
- Lettuce nutrient content is maximized by growing plants in fine-textured soils with a pH between 6.5 and 7.2, growing in direct sunlight, and under daytime temperatures of 65°F–77°F and 50°F–60°F at night.
The UF/IFAS Lettuce Breeding Program
The UF/IFAS lettuce breeding program started at the Everglades Research and Education Center (EREC) in the 1940s by adapting lettuce cultivars to Florida’s warm, humid growing conditions during the fall, winter, and spring growing seasons. Over several decades, the program was able to release a series of romaine, iceberg, and Bibb cultivars with improved bolting tolerance, resistance to several pests and diseases, and superior horticultural performance. These lettuce cultivars have also served as important parents in the pedigrees of other modern lettuce cultivars planted in the United States and abroad.
Several early studies indicated that these UF cultivars had substantial quantities of vitamins and minerals (Table 3). Compared to the general references in Table 1, Florida lettuces (Table 3) are within the expected nutrient value ranges for Vitamin A, Vitamin C, calcium, iron, magnesium, potassium, and zinc (Guzman 1986; Guzman and Zitter 1983; Guzman and Zitter 1984). In general, cultivars developed by the UF/IFAS Lettuce Breeding Program provide a significant serving of the aforementioned nutrients, similar to other lettuces that have been characterized when planted in the rich “muck” soils at the EAA. The rest of UF/IFAS’s lettuce breeding lines and cultivars currently deposited in the EREC germplasm bank remain to be characterized for nutritional content.
Table 6. Nutritional value of historically important lettuce cultivars released by the UF/IFAS Lettuce Breeding Program. All values are reported as milligrams/100 grams fresh weight, except Vitamin A, which is reported as IU.
Source: Guzman (1986); Guzman and Zitter (1983); Guzman and Zitter (1984).
References
FAOSTAT. 2020. Food and Agriculture Organization of the United Nations. Accessed June 7, 2020. http://www.fao.org/faostat/en/#data/QC
Guzman, V. L. 1986. ‘Short Guzmaine’, ‘Tall Guzmaine’, and ‘Floriglade’, Three Cos Lettuce Cultivars Resistant to Lettuce Mosaic Virus. Circ. S-326. Gainesville: University of Florida Institute of Food and Agricultural Sciences.
Guzman, V. L., and T. A. Zitter. 1983. ‘Floricos 83’, A Cos Lettuce Cultivar Resistant to Two Viruses, for Florida Organics Soils. Circ. S-305. Gainesville: University of Florida Institute of Food and Agricultural Sciences.
Guzman, V. L., and T. A. Zitter. 1984. ‘Floribibb’: A Gourmet Lettuce Resistant to Two Viruses, for Florida Organics Soils. Circ. S-313. Gainesville: University of Florida Institute of Food and Agricultural Sciences.
Harsha, S. N., K. R. Anilakumar, and M. V. Mithila. 2013. “Antioxidant Properties of Lactuca sativa Leaf Extract Involved in the Protection Of Biomolecules.” Biomedicine & Preventive Nutrition 3 (4): 367–373. https://doi.org/10.1016/j.bionut.2013.06.003
IOM (Institute of Medicine). 2011. Dietary Reference Intakes for Calcium and Vitamin D. Washington, DC: The National Academies Press.
Kim, M. J., Y. Moon, J. C. Tou, B. Mou, and N. L. Waterland. 2016. “Nutritional Value, Bioactive Compounds and Health Benefits of Lettuce (Lactuca sativa L.).” Journal of Food Composition and Analysis 49:19–34. https://doi.org/10.1016/j.jfca.2016.03.004
Lu, G. 2000. Lettuce Cultivation Techniques. Beijing: Jindun Publishing.
Mou, B. 2009. “Nutrient Content of Lettuce and Its Improvement.” Current Nutrition & Food Science 5 (4): 242–248. https://doi.org/10.2174/157340109790218030
Mou, B., and E. J. Ryder. 2002. “Relationship between the Nutritional Value and the Head Structure of Lettuce.” XXVI International Horticultural Congress: Advances in Vegetable Breeding 637:361–367. https://doi.org/10.17660/ActaHortic.2004.637.45
National Academies of Sciences, Engineering, and Medicine. 2019. Dietary Reference Intakes for Sodium and Potassium. Washington, DC: The National Academies Press. https://doi.org/10.17226/25353
Pinto, E., A. A. Almeida, A. A. Aguiar, and I. M. Ferreira. 2014. “Changes in Macrominerals, Trace Elements and Pigments Content during Lettuce (Lactuca sativa L.) Growth: Influence of Soil Composition.” Food Chemistry 152:603–611. https://doi.org/10.1016/j.foodchem.2013.12.023
Schönfeldt, H. C., and B. Pretorius. 2011. “The Nutrient Content of Five Traditional South African Dark Green Leafy Vegetables—A Preliminary Study.” Journal of Food Composition and Analysis 24 (8): 1141–1146. https://doi.org/10.1016/j.jfca.2011.04.004
Selman, J. D. 1994. “Vitamin Retention during Blanching of Vegetables.” Food Chemistry 49 (2): 137–147. https://doi.org/10.1016/0308-8146(94)90150-3
Still, D. W. 2007. “Lettuce.” In Genome Mapping and Molecular Breeding in Plants, Volume 5. Vegetables, edited by C. Kole, 127–140. Heidelberg: Springer. https://doi.org/10.1007/978-3-540-34536-7_2
Subbarao, K. V., R. M. Davis, R. L. Gilbertson, and R. N. Raid (Eds.). 2017. Compendium of Lettuce Diseases and Pests, Second Edition. St. Paul, MN: APS Press. https://doi.org/10.1094/9780890545782
Sytar, O., M. Zivcak, K. Bruckova, M. Brestic, I. Hemmerich, C. Rauh, and I. Simko. 2018. “Shift in Accumulation of Flavonoids and Phenolic Acids in Lettuce Attributable to Changes in Ultraviolet Radiation and Temperature.” Scientia Horticulturae 239:193–204. https://doi.org/10.1016/j.scienta.2018.05.020
USDA. 2019. FoodData Central. Accessed June 9, 2020. https://fdc.nal.usda.gov/index.html
US Department of Health and Human Services and US Department of Agriculture. 2015. 2015–2020 Dietary Guidelines for Americans, 8th Edition. https://health.gov/dietaryguidelines/2015/guidelines/