Objective
The objectives of this document are to provide readers with 1) an overview of dissolved oxygen (DO) from a chemical, physical, and ecological perspective, 2) summaries of some of the most common analytical methods for measuring DO, 3) the current state regulations for DO in public waters in Florida, and 4) opportunities for managing dissolved oxygen in aquatic systems. A glossary is provided at the end of this document for terms that are in bold in the text.
Description
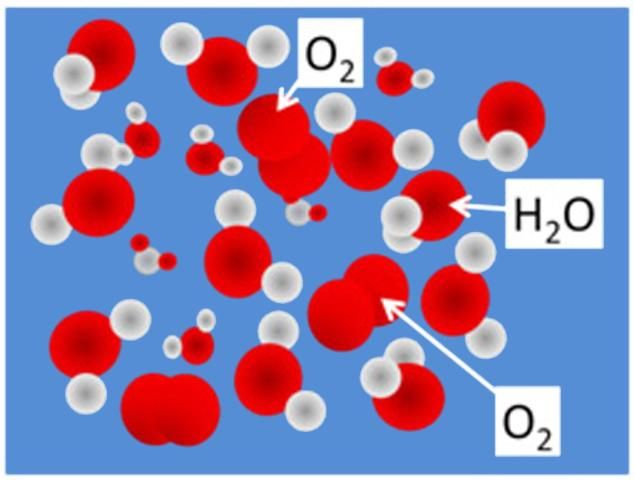
Fish and other aerobic aquatic organisms require oxygen to live and reproduce. For those that cannot obtain oxygen directly from the atmosphere, the amount dissolved in the water is critical. On the molecular scale, DO molecules can be illustrated as fitting in the spaces between adjacent water molecules (Figure 1). Dissolved oxygen is typically measured and reported as concentrations using either mg-DO/L of water (mg/L) or percent saturation as the units. Percent saturation refers to the amount of DO (percentage) dissolved in the water relative to the total amount possible.
Credit: Chris Wilson, UF/IFAS
Factors Affecting Dissolved Oxygen Concentrations in Water
Abiotic Factors
The amount of oxygen that can be dissolved in water depends on several factors, including water temperature, the amount of dissolved salts present in the water (salinity), and atmospheric pressure (Tables 1 and 2). On a relative scale, the amount of oxygen dissolved in saturated water will be greater in cooler waters than in warmer ones. Higher water temperatures result in increased molecular vibrations, essentially reducing the amount of space available between water molecules. The capacity of water to hold DO also decreases as the salinity increases. This results from more effective competition of the salts for intermolecular spaces due to their ionic charges. Altitude also affects the amount of DO in water due to differing densities of O2 available for dissolution. Because atmospheric O2 is less dense at higher altitudes, saturation DO concentrations will be lower than in water at sea level where atmospheric O2 is more dense.
Oxygen enters water bodies primarily by transfer from the atmosphere across the air-water interface and to a lesser extent by the action of photosynthetic organisms (See Biotic Factors for explanation). Transfer of oxygen across the air-water interface is facilitated by increasing the surface area exposed to the atmosphere. The surface area of a water body in contact with the atmosphere is increased by wind-driven waves and ripples as well as by forcing water into droplets by splashing over obstacles or forcing through a fountain. Given that atmospheric transfer is the dominant mechanism for infusing O2 into an aquatic system, the surface area to volume ratio is very important for establishing the baseline oxygen status for a given water body. Deep water bodies with relatively low surface area will have less opportunity for O2 transfer into the water compared to shallow water bodies with a larger surface area exposed to the atmosphere.
Biotic Factors
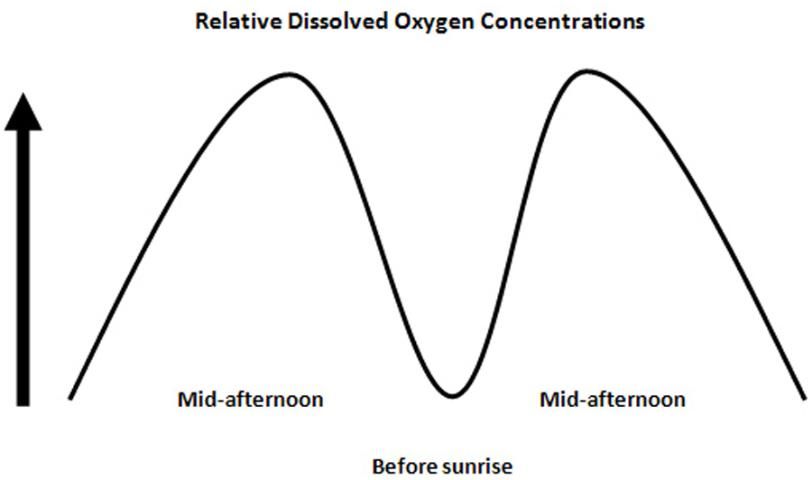
Aquatic plants and algae also contribute dissolved oxygen to water bodies during daylight hours through photosynthesis. The first step of photosynthesis splits two water molecules (H2O) into two hydrogen (H2) molecules and one oxygen (O2) molecule; the O2 is released into the water for underwater photosynthetic organisms. While this does represent O2 input into the water, the net effect on DO concentrations is usually very small or neutral because comparable amounts of DO are consumed by these same organisms at night through respiration, when photosynthesis is not actively occurring. Aerobic respiration consumes oxygen to extract energy from energy-rich carbon compounds needed for sustaining life, ultimately oxidizing the carbon to carbon dioxide (CO2) and reducing the O2 to H2O. Thus, dissolved oxygen concentrations will typically be highest in the mid-to-late afternoon when photosynthesis rates are greatest, and will reach the lowest concentrations just before the sun rises the next morning due to respiration needs. This fluctuation pattern is referred to as the "diurnal oxygen cycle" (Figure 2).
Credit: Chris Wilson, UF/IFAS
In addition to the respiration needs of photosynthetic organisms during darkness, oxygen within the system is also consumed through aerobic respiration by other organisms, including aquatic vertebrates and invertebrates and bacterial and fungal communities involved in degrading dead plants and animals. Biological Oxygen Demand (BOD) is a measure of the potential for DO within a water body to become depleted and possibly become anaerobic due to the biodegradation of organic matter by microbial organisms. BOD considerations are especially important when management activities will increase the available carbon within a system, such as with aquatic weed management using aquatic herbicides. The plants killed will become a source of BOD within the system as they are degraded by microbial organisms. Another indirect source of BOD to a water body is nutrient runoff from surrounding land and drainage systems. Nutrient enrichment often results in increased algae production, or algae blooms. Once these algal populations die, BOD will increase significantly as microbes degrade them.
Consequences of Low-DO Concentrations
DO requirements for maintenance of health and reproduction differ for different fish and invertebrate species. Prolonged exposure to low-DO levels may not directly kill an organism but may significantly increase its susceptibility to other environmental stresses and diseases. Most data related to low-DO tolerance are available from the aquaculture industry; less data are available for natural systems. Exposure to less than 2 mg/L oxygen for one to four days may kill most of the biota in a system, leaving behind low-DO-tolerant fish, air-breathing insects and anaerobic (not requiring oxygen) bacteria and fungi (microflora). Table 3 lists reported lethal minimum DO concentrations for several species common to the natural environment and the aquaculture industry. Generally, the lethal DO concentrations for fish are between 1 and 3 mg/L. At these levels, fish activity is minimal. For normal levels of activity, DO concentrations above 3 mg/L generally seem sufficient for many species.
Adaptations to Low-DO Conditions
The presence of aquatic organisms in a given water body may not be indicative of DO concentrations that are adequate for all aquatic life. Many aquatic organisms (vertebrates and invertebrates) require different amounts of DO for normal respiration. Survival of these organisms decreases when DO concentrations are depressed lower than organism-specific critical levels for extended periods of time. However, this generalization does not hold for all aquatic organisms. Some fish species such as gar and bowfin can live in low-DO environments by breathing at the surface. Other species such as the mosquito fish have upward-pointing mouths that are well adapted to obtain oxygen from the air-water interface. In addition, many fish species can physiologically acclimate to low-DO conditions by increasing the amount of water flowing over their gills, lowering metabolic oxygen demand, and by increasing hemoglobin (oxygen-carrying component of blood) and hematocrit levels. With the exception of increasing gill activity, these adaptations generally require long-term exposure to low, sublethal DO levels. Aside from the obvious presence of dead fish, one of the most common symptoms of low DO within a system before a fish kill occurs is the presence of fish gulping for air at the water surface.
Aquatic invertebrates also differ widely in where and how they obtain oxygen. Table 4 lists several common orders of aquatic insects and their sources of oxygen and respiratory options. Some aquatic insects are capable of obtaining oxygen directly from the atmosphere or from plants. Dissolved oxygen concentrations in water are of little consequence to these organisms. Others have cutaneous respiratory systems, gills, or hemoglobin that transfers dissolved oxygen from the water column into their bodies for respiration. The amount of oxygen dissolved in the water is important for these species. In addition, these organisms vary in their abilities to adapt to and their tolerance of low-DO conditions. Many of the sediment dwelling chironomid larvae and polycheate/oligocheate worms are commonly found in areas with very low DO concentrations.
Measurement Timing and Methods
Dissolved oxygen measurements are especially useful when fish kills are first detected or when fish are seen gulping for air at the water surface. Timely measurements of this type are often indispensible in determining the cause of death (e.g., lack of DO versus poisoning, etc.). In addition to helping define cause and effect associated with fish kills, monitoring of DO is often necessary for managing aquatic systems for their intended use. Dissolved oxygen concentrations taken at sporatic intervals of time are difficult to interpret due to the diurnal oxygen cycle. For this reason, a DO monitoring program should be tailored for individual needs. Because the lowest DO levels typically influence what species can live in a given water body, one might be interested in determining the lowest DO concentrations over a span of time by taking measurements before dawn every morning or over a series of mornings. Conversely, taking samples throughout the day will give an idea of the daily fluctuations in DO concentrations (minimum, maximum, mean, median), which are related to photosynthetic activity, respiration, and atmospheric transfer of oxygen. Measurements taken in the early afternoon will likely represent the highest achievable DO concentrations in a given water body with regard to photosynthetic organisms.
Dissolved oxygen can be measured by several common techniques, each with advantages and disadvantages. These methods include the iodometric method or Winkler titration method, amperometric measurements using gas-permeable membrane electrodes, and luminescence measurements using optical technologies. These methods are introduced in the following sections.
Iodometric Method
The description of this method was taken from Standard Methods for Examination of Water and Wastewater (APHA et al, 1995). This reference should be consulted for more detailed information when needed. The iodometric method can be one of the most precise and reliable procedures for DO analysis. This is a titration-based method based on the reaction of DO with divalent manganese (Mn++) ions. Briefly, after adding a known amount of dissolved divalent manganese ions and iodide to a known volume of sample, the pH is increased by adding base and the bottle is then stoppered. An insoluble precipitate of manganous hydroxide forms. Dissolved oxygen present in the sample oxidizes an equivalent amount of the manganous hydroxide precipitate, forming chemically different hydroxides. The sample is next acidified, which causes the precipitate to dissolve, releasing the iodide originally consumed in the solution. The amount of iodine released is then measured by titration with a standard solution of thiosulfate (Na2S2O3) and a starch indicator. The solution is blue as long as I2 is present. When all of the I2 has been removed from solution by thiosulfate, the solution clears. The volume of thiosulfate used to clear the solution is then used to calculate the concentration of DO in the sample (1 mL of 0.025M Na2S2O3 = 1 mg-DO/L for a 200 mL sample). The DO concentration can also be determined directly using an absorption spectrophotometer.
Advantages
- Can be very accurate and precise.
- Relatively inexpensive (only requiring titration burets, sample bottles, and chemicals)
- Available in kits from several manufacturers.
Disadvantages
- Cannot monitor DO instantaneously or continuously.
- More time consuming than membrane electrode methods.
- Nitrite, iron (ferrous and ferric), suspended solids, and color in the sample can interfere with accurate measurement. Modifications to the method can be made to remove these interferences.
Amperometric Membrane Electrode Methods
The amperometric electrode method uses a submersible, membrane-covered electrode that is attached to a meter that gives direct readings in mg/L (parts- per million, PPM) or percent saturation. There are a variety of membrane electrodes that are commercially available and that provide an excellent method for DO measurement in highly polluted and/or highly colored waters, as well as in strong waste effluents. They are especially useful under conditions that are not favorable for use of the iodometric methods and for in situ measurements in the field. Two basic types of membrane electrodes exist, polarographic and galvanic. The following description is for the more common polarographic models.
The electrode itself is composed of a physically separated metal anode and cathode (Figure 3). An electrolyte solution provides connectivity between the two. A thin, oxygen-permeable membrane is stretched over the sensor isolating the anode, cathode, and electrolyte solution from the environment, while allowing oxygen to enter. This membrane is typically composed of polyethylene or fluorocarbon materials because of their relative ruggedness and permeability to molecular oxygen.
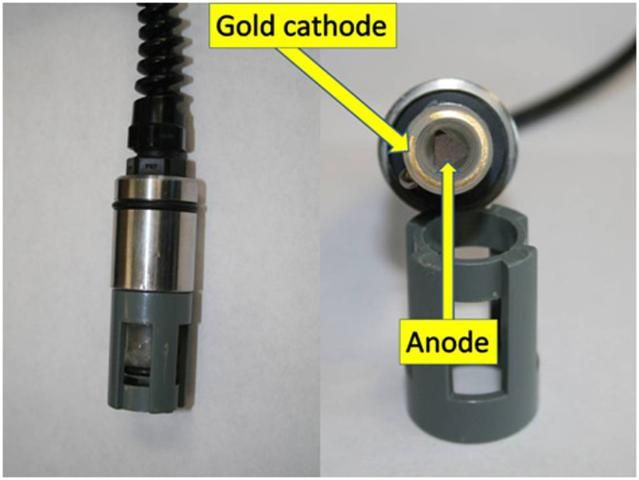
When this type of meter is switched on, a background electrical current is established through the anode-electrolyte-cathode-meter circuit. Oxygen passes through the membrane at a rate proportional to its concentration in the water. Oxygen, which has passed through the membrane, reacts at the cathode causing a change in the current flow in the anode-electrolyte-cathode-meter circuit when the meter is turned on. The probe current (reading) changes proportionally to the amount of O2 diffusing through the membrane and reacting at the cathode. The oxygen concentration inside the membrane can be assumed to be zero because it is readily consumed at the cathode.
Advantages
- Field portable.
- Easy to calibrate and use.
- Can instantaneously and continuously monitor DO concentrations.
- Does not need sampling equipment, bottles, or storage facilities.
Disadvantages
- Relatively expensive to maintain.
- Relatively expensive initial costs. Typical DO meters cost $250 or more.
- Hydrogen sulfide gases tend to reduce the sensitivity of membrane electrodes. Frequent use in environments where these gases are common will require more frequent cleaning of electrodes and replacement of membranes.
- Requires stirring for accurate measurements because oxygen is consumed.
- Measurements may be affected by wrinkled, loose, and damaged membranes, or by calibration drift.
Optical Sensor Electrode Technology
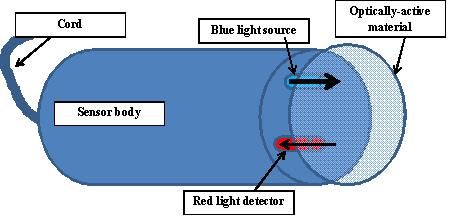
Optical sensor technology has recently become more commercially available and accepted. These systems are based on optical fluorescence/luminescence principles. In short, light of a specific wavelength interacts with optically active molecules, which absorb the light energy and become molecularly excited. When the excited molecules return to their ground state, excess energy is released in the form of light of a longer wavelength than originally absorbed. In this case, blue light is directed towards an optically active material, which in turn emits red light that is detected by a sensor in the electrode (Figure 4). The amount of red light emitted is influenced by dissolved oxygen. The emission of red light is reduced as the concentration of DO in the sample increases. These electrodes do not use semi-permeable membranes.
Advantages
- Measurements are stable.
- Field portable.
- Easy to calibrate, maintain, and use.
- Can instantaneously and continuously monitor DO concentrations.
- Does not need sampling equipment, bottles, or storage facilities.
- No membranes or filling solutions to maintain.
- No stirring required because oxygen is not consumed.
- No known interferences in natural aquatic systems.
Disadvantages
- Relatively expensive to maintain.
- Relatively expensive initial costs. Typical optical DO meters cost $750 or more.
- Experience base is limited due to the more recent introduction of this technology in commercially available meters.
State Surface Water Quality Criteria
The Florida Department of Environmental Protection (FDEP) is charged with protecting water quality within state-owned surface water bodies. Acceptability threshold criteria were developed for DO to preserve and protect each water body's designated uses and wildlife. Given the diversity of Florida (temperate to subtropical regions), the state was divided into five bioregions based on similarities in biological organism (aquatic) assemblages using data from monitoring surveys (Figure 5). Water bodies within each bioregion contain similar groups of plants and animals, whereas organism assemblages differ significantly between bioregions. The bioregions identified include the 1) Panhandle, 2) Big Bend, 3) Northeast, 4) Peninsula, and 5) Everglades. The criteria are targeted towards preserving, maintaining, and/or helping recover well-balanced aquatic plant and animal communities. The actual criteria were based on relationships between percent DO saturation and the presence of well-balanced aquatic communities identified from intensive biomonitoring studies within each bioregion. The DO criteria are based on percent saturation, not concentrations, because it accounts for the effects of temperature and salinity and is better correlated with the biometrics used to develop the criteria. Additionally, provisions are allowed for development of site-specific criteria for protection of endangered and threatened species as well as for water bodies that have naturally lower background DO levels but that support their intended uses and biota. More details on how the criteria were derived can be found in DEP-SAS-001/10 (March 2013), Technical Support Document: Derivation of Dissolved Oxygen Criteria to Protect Life in Florida's Fresh and Marine Waters. The designated uses for each surface water classification group are shown in Table 5. Water quality restrictions are greater for numerically lower classes of water (i.e., I > II > III > IV > V). Water flowing from a numerically higher class of water (for example class IV) into a more restrictive class (i.e. a numerically lower class) may be required to meet standards for the lower class. A listing of the FDEP guidelines for surface-water DO concentrations is also shown in Table 5.
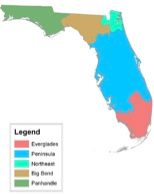
Credit: FDEP 2013
Dissolved Oxygen Management Opportunities
- When designing and constructing ponds, maximize the surface area exposed to the atmosphere and limit the depth to facilitate atmospheric transfer and to encourage natural mixing by wind and wave action.
- While not as environmentally sustainable as natural atmospheric transfer, blowers and fountains can be used to increase DO levels.
- Minimize input of additional biological oxygen demand into aquatic systems. Always follow the instructions on the herbicide label when controlling weeds within an aquatic system. If allowed, consider treating large water bodies in sections over time to prevent the entire water body from becoming anaerobic when the plant material begins to degrade by microbial action.
- Minimize nutrient inputs into the aquatic systems from surrounding land and drainage systems to reduce risks of stimulating algal blooms. Limitation of all nutrients may not be necessary since algal blooms are often limited by a single nutrient (typically nitrogen or phosphorus). Determine the limiting nutrient and target best management practices that minimize export of that nutrient into the aquatic system.
References for More Information
American Public Health Association (APHA), American Water Works Association (AWWA), and the Water Environment Federation (WEF). Standard Methods for Examination of Water and Wastewater. United Book Press, Inc. Baltimore, MD.
Avault, J. W., Jr. 1996. Fundamentals of Aquaculture. AVA Publishing Co. Inc, Baton Rouge, LA.
Bachmann, M., M. Hoyer, and D. Canfield, Jr. 1999. Living at the Lake. Gainesville: University of Florida Institute of Food and Agricultural Sciences.
Florida Department of Environmental Protection (FDEP). 2013. Technical Support Document: Derivation of Dissolved Oxygen Criteria to Protect Aquatic Life in Florida's Fresh and Marine Waters (DEP-SAS-001/13). Florida Department of Environmental Protection, Division of Environmental Assessment and Restoration, Tallahassee, FL. https://www.flrules.org/gateway/RuleNo.asp?title=SURFACE%20WATER%20QUALITY%20STANDARDS&ID=62-302.533.
Florida Statute 62-302.530. Criteria for Surface Water Classifications and Water Quality Standards: https://www.flrules.org/gateway/ChapterHome.asp?Chapter=62-302.
Kotz, J. C. and K. F. Purcell. 1987. Chemistry & Chemical Reactivity. Saunders College Publishing, New York.
Merrit, R. W. and K. W. Cummins (eds). 1996. An Introduction to the Aquatic Insects of North America, (Third Edition). Kendall/Hunt Publishing Co., IW.
Timmons, M. B., J. M. Ebeling, F. W. Wheaton, S. T. Summerfelt, and B. J. Vinci. 2002. Recirculating Aquaculture Systems, (2 ed.) Cayuga Aqua Ventures, Ithaca, N.Y.
U.S. Geological Survey (USGS). 2006. 6.2 "Dissolved Oxygen V2.1," M.E. Lewis (ed). In National Field Manual for the Collection of Water-Quality Data (TWRI Book 9) water.usgs.gov/owq/FieldManual/Chapter6/6.2_v2.1.pdf, accessed 7/16/2013
Yellow Springs Instruments, Inc. (YSI). 1997. YSI Model 55 Handheld Dissolved Oxygen and Temperature System Operations Manual. YSI Inc., Yellow Springs OH. p. 19.
Glossary
Anode—Within the context of oxidation-reduction reactions, electrons are produced at the anode (- terminal) where oxidation occurs.
Bioregion—A place, locale, or area that constitutes a natural ecological community (dictionary.reference.com).
Cathode—Within the context of oxidation-reduction reactions, electrons produced at the anode move toward the cathode (+ terminal) where reduction occurs.
Cutaneous—Of the skin, pertaining to the skin, or affecting the skin.
Diel—Refers to a 24-hour period or cycle.
Electrolyte—A substance that dissolves in water to form an electrically conducting solution (Kotz and Purcell 1987).
Gills—Respiratory organs present in many aquatic animals. Gills are the structures used to transfer dissolved oxygen from the water into the organism for aerobic metabolism.
Hemoglobin—Component of blood responsible for transport of O2 from respiratory gas exchange organs to respiring cells, and transport of CO2 from respiring cells to gas-exchange organs.
Invertebrate—Animals not possessing a distinct cartilaginous or bony axial endoskeleton.
Photosynthesis—The assimilation of carbon dioxide by green plants and by pigmented, photosynthetically active prokaryotes, and its conversion into carbohydrate, using energy from the sun. This conversion can be described by the following equation:
6CO2 + 12 H2O +energy?C6H12O6 + 6O2 + 6H2O
Precipitate—An insoluble salt (Kotz and Purcell 1987).
Respiration—Metabolic process in which stored energy is released with the oxidation of reduced organic carbon compounds. The ultimate by-products of respiration are often carbon dioxide (CO2) and water (H2O).
Titration—Procedure used to quantitatively analyze the amount of a substance by means of an essentially complete reaction in a solution with a reagent of known concentration (Kotz and Purcell 1987).
Vertebrate—Organism possessing a distinct cartilaginous or bony axial endoskeleton, consisting of a skull and vertebral column.
Influence of temperature and salinity on saturated dissolved oxygen concentrations (mg/L) in water. PPT = parts per thousand (YSI 1997).
Influence of temperature and elevation on saturated dissolved oxygen concentrations in water (USGS 2006).
Minimum dissolved oxygen concentrations for sustaining life of several aquatic species. LC50 is the concentration at which 50% of the organisms die. Data adapted from Avault, Jr. 1996.
Several common orders of aquatic insects and their modes of obtaining—and sources of—oxygen for respiration (Merritt and Cummins 1996).
Surface water class, designated water-use groups, and dissolved oxygen (DO) criteria for surface waters of the State of Florida. Source: Florida Department of Environmental Protection; https://www.flrules.org/gateway/RuleNo.asp?title=SURFACE%20WATER%20QUALITY%20STANDARDS&ID=62-302.530.