This publication is part of a series titled Soil Phosphorus Storage Capacity (SPSC) for Phosphorus Risk Assessment and Management. The series is intended for use by soil scientists, environmental consultants, state agency personnel, Extension faculty, and others who are interested in management practices and policies that minimize the risk of phosphorus loss from soils.
Introduction
The purpose of this publication is to present an approach to assessing sandy soil phosphorus (P) assimilation capacity prior to reaching a threshold of environmental concern. We will refer to this approach as the "soil P storage capacity" (SPSC). It could be used by soil scientists, environmental consultants, state agency personnel, Extension faculty, and others with an interest in the potential of P loss from soils. Its advantage over the use of soil test P (STP; e.g., Mehlich 1 or Mehlich 3) values as risk indicators is that SPSC accounts for differences in P retention capacity, whereas STP does not. For example, some sandy soils (e.g., Spodosols of the Lake Okeechobee Watershed) with negligible P retention capacity can have low Mehlich 1 STP values at the outset. These soils, however, can quickly reach high-risk concentrations with P loading due to low capacities to hold P.
The SPSC is based on a well-documented tendency for sandy soils to retain P effectively up to a threshold ratio of P / (iron + aluminum)—above which P release to solution can become problematic. This ratio is referred to as the "P saturation ratio" (PSR). It is calculated as:
PSR = (Extractable-P/31) / [(Extractable-Fe/56) + (Extractable-Al/27)] Equation 1
Details of the PSR concept can be obtained from SL333/SS539 and Nair et al. 2004.
The PSR is a more precise indicator of P loss risk than STP, but it also fails to index P retention capacity of a soil. The nutrient management scheme should be designed to keep the STP or the PSR value from rising appreciably so as to minimize risk of P loss from the soil. The SPSC adds a capacity dimension that enables the prediction of how much P can be loaded prior to the onset of significant risk.
What Is SPSC?
The SPSC is a calculation that accounts for P loss risks arising from previous loading as well as inherently low P sorption capacity. It provides a direct estimate of the amount of P a soil can hold before exceeding a threshold soil equilibrium concentration, i.e., before the soil becomes an environmental risk. Hence it captures the high risk for soils with very low inherent P retention capacity but that have low STP and PSR. It also distinguishes situations where soils with elevated STP can still have some remaining capacity to safely retain P due to relatively high P retention capacity.
How Is SPSC Determined?
SPSC can be determined using the following formula (Nair and Harris 2004):
SPSC = (Threshold PSROx – Soil PSROx) * Oxalate-[(Fe/56) + (Al/27)] * 31 (mg/kg)
where
PSROx = (Oxalate-P/31) / [(Oxalate-Fe/56) + (Oxalate-Al/27)] Equation 2
SPSC can also be determined using P, Fe, and Al from a soil test solution such as Mehlich 1 solution.
The PSR is calculated for each sample as the molar ratio of Mehlich 1-extractable P to Mehlich 1-extractable [Fe + Al].
PSRM1 = (Mehlich 1-P/31) / [(Mehlich 1-Fe/56) + (Mehlich 1-Al/27)] Equation 3
SPSC = (Threshold PSRM1 – Soil PSR M1) * Mehlich 1-[(Fe/56) + (Al/27)] * 31 * X (mg/kg) Equation 4
X is the conversion factor needed when calculating SPSC using Mehlich 1 parameters. When X is not included in the equation, SPSC is replaced by the term "Capacity Factor" (CF).
CF = (Threshold PSRM1 – Soil PSR M1) * Mehlich 1-[(Fe/56) + (Al/27)] * 31 (mg/kg) Equation 5
A soil can have only one soil P storage capacity or SPSC. Mehlich 1 solution does not extract P, Fe, and Al with the same efficiency as the oxalate solution. The conversion factor, X, is determined by a simple regression between SPSC calculated using oxalate and Mehlich 1 parameters. The X value is likely different for surface (A) horizons, subsurface (E) horizons, and for spodic (Bh) horizons. For the surface horizons, SPSC = (1.3 x CF) - 0.33; R2 = 0.90. Therefore X = 1.3. This value may be used for all A and E horizon soils in Florida as the relationship was created from data for the surface and subsurface soils representing Alfisols, Entisols, and Ultisols of the Suwannee River Basin (Chrysostome et al. 2007) and Spodosols of the Lake Okeechobee Basin.
The conversion factor (X) is 1.8 for the Bh horizons of Spodosols using P, Fe, and Al in a Mehlich 1 solution; i.e., SPSC = (1.8 x CF) - 15; R2 = 0.87 for dairy and beef manure and inorganically fertilized soils of the Lake Okeechobee Watershed.
What Is the Relationship between SPSC and Water-soluble P?
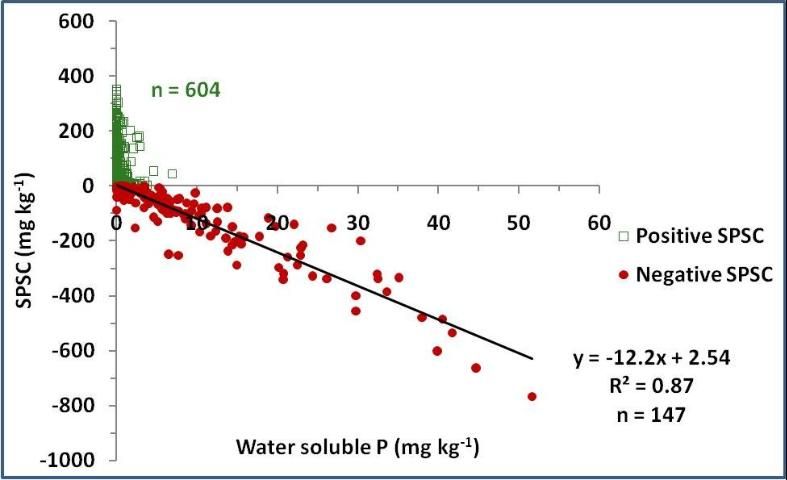
Water-soluble P (WSP) is an indicator of the amount of P that will be released from a soil when in contact with water (rain). Therefore, it is important to look into the relationship of SPSC and WSP. A relationship between the two parameters for the A and E horizons shows that as long as SPSC is positive, WSP is at a minimum; but when SPSC is negative, the release of P from the soil increases linearly (Figure 1). These relationships are applicable to Bh horizons as well.

Credit: Nair et al. 2007
How Can SPSC Be Used to Evaluate the Risk of P Loss from a Soil?
The following are some potential uses of the SPSC concept for routine purposes:
- Predicting P release from a soil can be used to project consequences of water-table manipulation for P control.
- Evaluating the amount of P that can be safely applied to a soil before the soil becomes an environmental risk if manure application is based on nitrogen requirements of a crop instead of P requirements.
- Calculating the amount of an iron- or aluminum-based amendment to be added to a soil as a best management practice (BMP) since iron + aluminum is used as a surrogate for P retention in acid soils.
- Predicting reduction in P storage capacity of a soil in time if the P loading to a soil is known.
- Identifying suitable areas for location of animal-based agriculture by selecting soils that have a greater capacity to retain P.
- Verifying the suitability of potential locations for constructing stormwater treatment areas.
SPSC can be calculated to any desired soil depth (including A, E, and Bh horizons) that would allow the implementation of the above-mentioned uses of the parameter. The concept will allow determination of the P storage capacity of a soil on a site-specific basis and allow selection of appropriate BMPs for a given site. It will be easy for anyone to use the SPSC tool since the needed parameters, P, Fe, and Al in a Mehlich 1 solution, will be available from any soil testing laboratory.
Equations for SPSC Determinations
The threshold PSR values (when using Mehlich 1-P, Fe, and Al) is 0.1 for A and E horizons and 0.08 for Bh horizons (SL333/SS539).
Surface and Subsurface Soils (A and E Horizons)
SPSC = (0.1 – Soil PSR M1) * Mehlich 1-[(Fe/56) + (Al/27)] * 31 * 1.3 (mg/kg) Equation 6
Spodic (Bh) Horizon
SPSC = (0.08 – Soil PSR M1) * Mehlich 1-[(Fe/56) + (Al/27)] * 31 * 1.8 (mg/kg) Equation 7
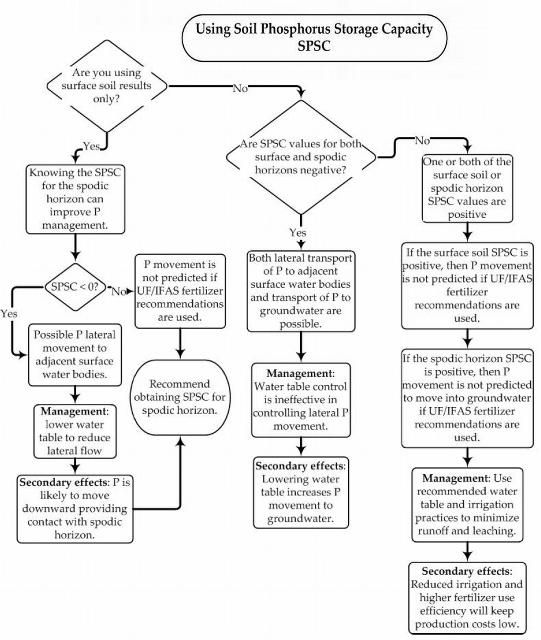
A flowchart illustrating the use of SPSC for P management is provided (Figure 2).

References
Chrysostome, M., V. D. Nair, W. G. Harris, and R. D. Rhue. 2007. "Laboratory Validation of Soil Phosphorus Storage Capacity Predictions for Use in Risk Assessment." Soil Sci. Soc. Am. J. 71:1564–1569.
Nair, V. D., and W. G. Harris. 2004. "A Capacity Factor as an Alternative to Soil Test Phosphorus in Phosphorus Risk Assessment." New Zealand J. Agri. Res. 47:491–497.
Nair, V. D., K. M. Portier, D. A. Graetz, and M. L. Walker. 2004. "An Environmental Threshold for Degree of Phosphorus Saturation in Sandy Soils." J. Environ. Qual. 33:107–113.
Nair, V. D., W. G. Harris, M. Chrysostome, and R. D. Rhue. 2007. "A New Approach to Predicting Safe Phosphorus Loading in Soils." Annual meetings abstracts [CD-ROM]. ASA, CSSA, and SSSA, Madison, WI.
Nair, V. D., W. G. Harris, and D. Chakraborty. 2010. An Indicator for Risk of Phosphorus Loss from Sandy Soils. SL333/SS539. Gainesville: University of Florida Institute of Food and Agricultural Sciences. https://edis.ifas.ufl.edu/ss539
Acknowledgments
This study was supported in part by a grant from the Florida Department of Agriculture and Consumer Services. The authors thank Tom Obreza for his valuable comments on the draft version of this publication and Ed Hanlon for his contribution to the flowchart (Figure 2).