
This publication is part of SL253, Nutrition of Florida Citrus Trees, 3rd Edition. For references, a glossary, and appendices, please refer to the full document at https://edis.ifas.ufl.edu/ss478.
Introduction
Nutrient deficiency or excess will cause citrus trees to grow poorly and produce suboptimal yield and/or fruit quality. Diagnosis of potential nutritional problems should be a routine citrus-growing practice. Quantifying nutrients in soils and trees eliminates guesswork in adjusting a fertilizer program (Figure 1).
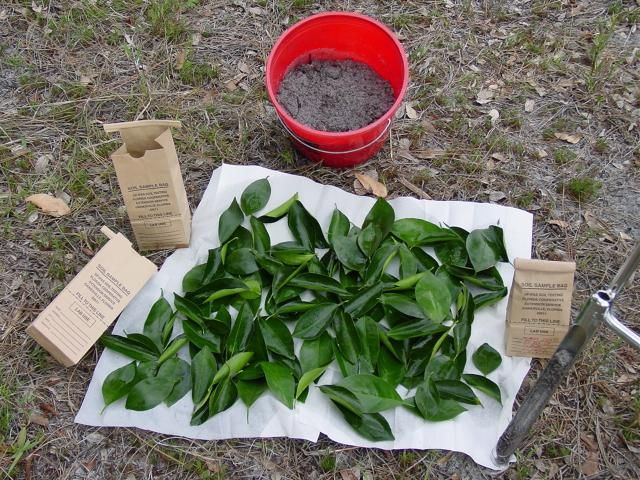
Credit: Mongi Zekri, UF/IFAS
This chapter explains the value of leaf and soil analysis in determining fertilizer programs that increase fertilizer efficiency while maintaining maximum yield and desirable fruit quality. Soil testing and leaf tissue testing have different uses or purposes depending on the property or nutrient, so care must be taken to use the correct test when diagnosing citrus nutrition (Table 1).
Summary of the usefulness of soil testing and leaf tissue testing as citrus nutrient management tools.
Benefits of Leaf Analysis
Leaf tissue analysis is the quantitative determination of the total mineral nutrient concentrations in the leaf. Tissue testing includes analysis for N, P, K, Ca, Mg, S, Mn, Zn, Cu, Fe, and B. Chlorine concentration is usually sufficient given most field conditions, but Cl may become excessive where soil or irrigation water is saline. Similarly, Mo deficiency or toxicity is rare. The goal in tissue analysis is to adjust fertilization programs such that nutritional problems and their costly consequences are prevented.
Leaf analysis is a useful tool to detect problems and adjust fertilizer programs for citrus trees because leaf nutrient concentrations are the most accurate indicator of fruit crop nutritional status. Because citrus is a perennial plant, it is its own best indicator of appropriate fertilization. Leaves reflect nutrient accumulation and redistribution throughout the plant, so the deficiency or excess of an element in the soil is often reflected in the leaf. Considerable research involving citrus leaf testing has established its reliability as a management tool, but sampling guidelines should be followed precisely to ensure that analytical results are meaningful.
Tissue analysis:
- Determines if the tree has had a sufficient supply of essential nutrients.
- Confirms nutritional deficiencies, toxicities, or imbalances.
- Identifies hidden toxicities and deficiencies when visible symptoms do not appear.
- Evaluates the effectiveness of fertilizer programs.
- Provides a way to compare several fertilizer treatments.
- Determines the availability of elements not tested for by other methods.
Leaf analysis integrates all the factors that might influence nutrient availability and uptake. Tissue analysis shows the relationship of nutrients to each other. For example, K deficiency may result from a lack of K in the soil or from excessive Ca, Mg, and/or Na. Similarly, adding N when K is low may result in K deficiency because the increased growth requires more K.
Steps in Leaf Sampling
Procedures for proper sampling, preparation, and analysis of leaves have been standardized to achieve meaningful comparisons and interpretations. If done correctly, the reliability of the chemical analysis, data interpretation, fertilization recommendations, and adjustment of fertilizer programs will be sound. Therefore, considerable care should be taken from the time leaves are selected for sampling to the time they are received at the laboratory for analysis.
Leaf Sample Timing
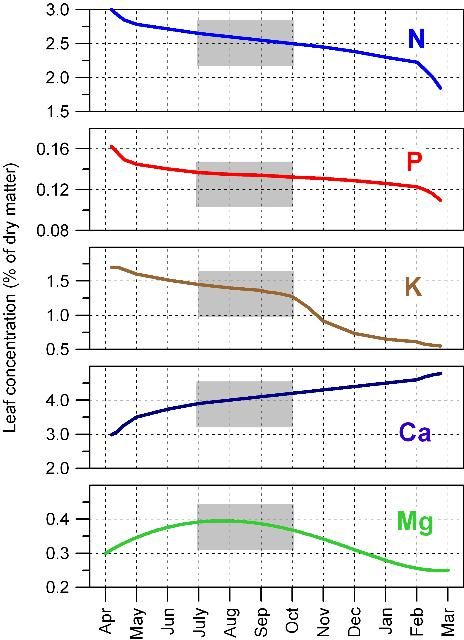
- Leaf samples must be taken at the correct time of year because nutrient concentrations within leaves continuously change. As leaves age from spring through fall, N, P, and K concentrations decrease, Ca increases, and Mg first increases and then decreases (Figure 2). However, leaf mineral concentrations are relatively stable from 4 to 6 months after emergence in the spring.
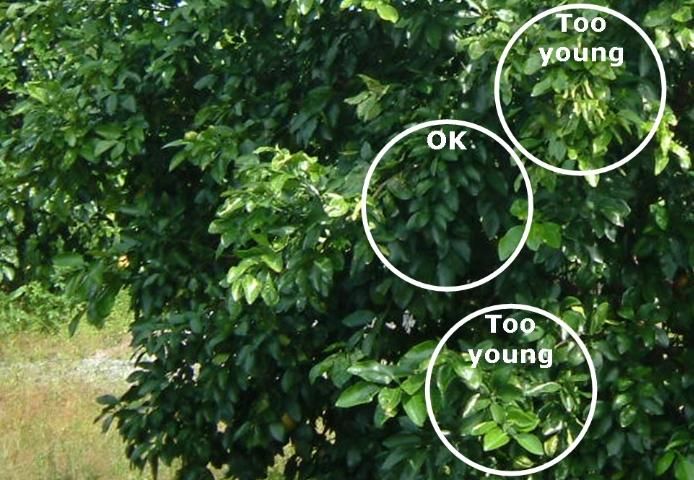
- The best time to collect 4-to-6-month-old spring flush leaves is July and August (Figure 3). If leaves are sampled later in the season, summer leaf growth can easily be confused with spring growth.
Credit: Thomas Obreza, UF/IFAS
Leaf Sampling Technique
- A sampled citrus grove block or management unit should be no larger than 20 acres. The sampler should make sure that the selected leaves represent the block being sampled.
- Each leaf sample should consist of about 100 leaves taken from nonfruiting twigs of 15 to 20 uniform trees of the same variety and rootstock that have received the same fertilizer program.
- Use clean paper bags to store the sample. Label the bags with an identification number that can be referenced when the analytical results are received.
- Avoid immature leaves due to their rapidly changing composition.
- Do not sample abnormal-appearing trees, trees at the edge of the block, or trees at the end of rows because they may be coated with soil particles and dust.
- Do not include diseased, insect-damaged, or dead leaves in a sample.
- Select only one leaf from a shoot and remove it with its petiole (leaf stem).
Special Case: Diagnosing Growth Disorders
- Collect samples from both affected trees as well as normal trees.
- Trees selected for comparison sampling should be of the same age, scion type, and rootstock.
- If possible, confine the sampling area to trees that are close to each other.
Handling of Leaf Samples
- Protect leaves from heat and keep them dry. Place them in a refrigerator for overnight storage if they cannot be washed and oven-dried the day of collection.
- For macronutrient analysis, leaves do not need to be washed.
- If accurate micronutrient analysis is desired, the leaves will need to be washed (see below).
- Dry the leaves in a ventilated oven at about 140°F.
Preparation for Analysis
- Leaves that have been sprayed with micronutrients for fungicidal (Cu) or nutritional (Mn, Zn) purposes should not be analyzed for those elements because it is almost impossible to remove all surface contamination from sprayed leaves.
- For accurate Fe and B or other micronutrient determinations, leaf samples require hand washing, which is best done shortly after collection before they dehydrate.
- For micronutrient determinations, rub the leaves between the thumb and forefinger while soaking them in a mild detergent solution, then thoroughly rinse with pure water. It is difficult to remove all surface residues, but this procedure removes most of them.
Analysis and Interpretation
- The laboratory determines the total concentration of each nutrient in the leaf sample. Because total concentration is determined, there should be no difference in leaf analysis results between different laboratories.
- To interpret laboratory results, compare the values with the leaf analysis standards in Table 2. These standards are based on long-term field observations and experiments conducted in different countries with different citrus varieties, rootstocks, and management practices, and they are used to gauge citrus tree nutrition throughout the world.
- The goal in nutrition management is to maintain leaf nutrient concentrations within the optimum range (Table 2) every year. If the interpretation for a particular nutrient is not optimum, various strategies can be used to address the situation (Table 3).
Benefits of Soil Analysis
Soil analysis measures organic matter content, pH, and extractable nutrients, which are useful in formulating and improving a fertilization program. Soil analysis is particularly useful when conducted for several consecutive years so that trends can be observed. However, a citrus grower cannot rely on soil analysis alone to formulate a fertilizer program or diagnose a nutritional problem in a grove.
Similar to leaf analysis, methods to determine organic matter and soil pH are universal, so results should not differ between laboratories. However, soil nutrient extraction procedures vary from lab to lab. Several accepted chemical procedures exist that remove different amounts of nutrients from the soil because the extractants vary in strength. To draw useful information from soil tests, consistency in use of a single extraction procedure from year to year is important to avoid confusion when interpreting the amount of nutrients extracted.
A soil extraction procedure does not measure the total amount of nutrients present, nor does it measure the quantity actually available to citrus trees. A perfect extractant would remove nutrients from the soil in amounts that are exactly correlated with the amount available to the plant. Therefore, the utility of a soil testing procedure is how well the extractable values correlate with the amount of nutrient a plant can take up. The process of relating these two quantities is called calibration.
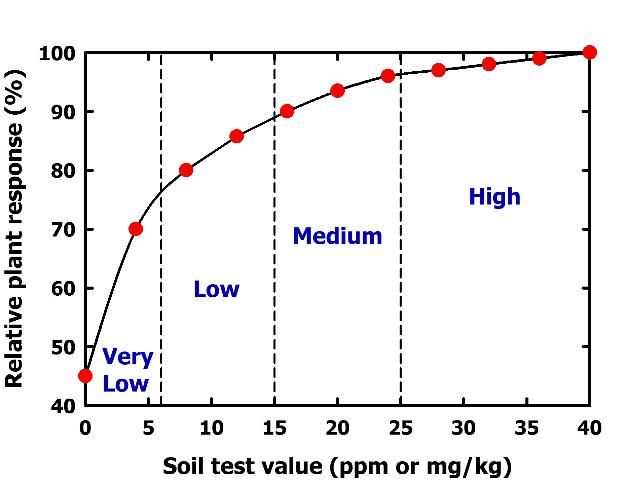
A soil test is only useful if it is calibrated with plant response. Calibration means that as a soil test value increases, nutrient availability to plants increases in a predictable way (Figure 4). Low soil test values imply that a crop will respond to fertilization with the particular nutrient in question. High soil test values indicate the soil can supply all the plant needs, so no fertilization is required. The soil test value that separates predicted fertilizer response from nonresponse is called the critical or sufficiency soil test value (Figure 5).
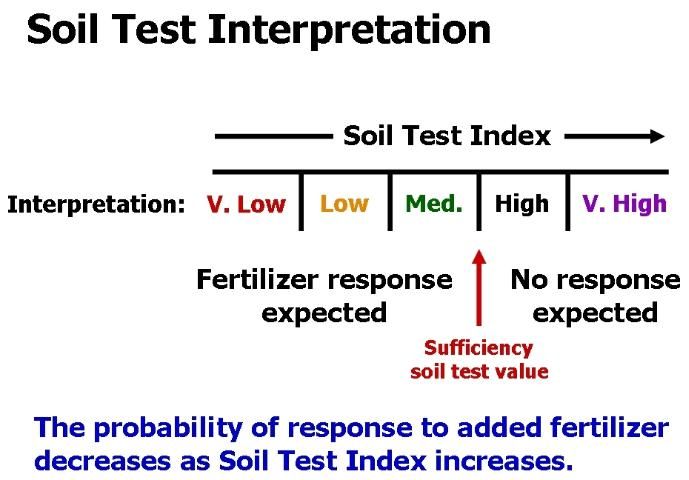
In Florida, soil testing for mobile, readily leached elements like N and K has no practical value. In addition to organic matter and pH, soil testing is important for P, Mg, Ca, and Cu. The UF/IFAS Extension Soil Testing Laboratory (ESTL) has used the Mehlich 1 (double acid) extraction procedure since 1977. The Mehlich 1 test was developed for sandy soils with pH < 6.5, CEC < 10 meq/100 g, and organic matter < 5%. Most of the soils used to produce citrus in Florida meet these criteria. The exceptions are the calcareous soils of the Indian River production area that do not meet the pH requirement.
UF/IFAS soil test interpretations for P, K, and Mg (Table 4) were established from experiments with annual field and vegetable crops conducted for many years. Limited soil test calibration work with Florida citrus trees suggests that the interpretations in Table 4 are suitable for citrus.
Some commercial agricultural laboratories use the Mehlich 1 extraction procedure, but others use procedures different from Mehlich 1 as their preferred soil test method. Additional extractants used to determine P include Mehlich 3, ammonium acetate buffered at pH 4.8, and Bray P1. Other extractants for Ca and Mg include Mehlich 3 and ammonium acetate buffered at either pH 4.8 or pH 7.0. Some interpretations for these extractants were developed by Koo et al. (1984) through experimentation, field observation, and best professional judgment (Table 5). Others were derived from correlations with the Mehlich 1 extractant (Alva 1993; Sartain 1978).
The single most useful soil test in a citrus grove is for pH. Soil pH greatly influences nutrient availability (Chapter 3, Figure 2). Some nutrient deficiencies can be avoided by maintaining soil pH between 6.0 and 6.5. Deficiencies or toxicities are more likely when the pH is outside this range. If soil pH is too low, the soil test laboratory runs a buffer test to determine the rate of lime needed to raise the top 6 inches of soil to pH 6.5.
In some cases, soil tests can determine the best way to correct a deficiency identified by leaf analysis. For example, Mg deficiency may result from low soil pH or excessively high soil Ca. Dolomitic lime applications are advised if the pH is too low, but magnesium sulfate is preferred if soil Ca is very high and the soil pH is in the desirable range. If soil Ca is excessive and soil pH is relatively high, then foliar application of magnesium nitrate is recommended.
A poor relationship may exist between soil test values and leaf nutrient concentrations in perennial crops like citrus. Often fruit trees contain sufficient levels of a nutrient even though the soil test is low. On the other hand, a high soil test does not assure a sufficient supply to the trees. Tree nutrient uptake can be hindered by problems like drought or flooding stress, root damage, and cool weather. Tissue analysis combined with soil tests can help identify the problem.
Steps in Soil Sampling
Standard procedures for sampling, preparing, and analyzing soil should be followed for meaningful interpretations of the test results and accurate recommendations.
Soil Sample Timing
- In Florida, soil samples should be collected once per year at the end of the summer rainy season and before fall fertilization (August to October).
- It is convenient to take annual soil samples when collecting leaf samples to save time and reduce cost.
- The accuracy of soil test interpretations depends on how well the soil sample represents the grove block or management unit in question.
Soil Sampling Technique
- Each soil sample should consist of one soil core taken about 8 inches deep at the dripline of 15 to 20 trees within the area wetted by the irrigation system in the zone of maximum root activity (Figure 6).
- Sampled areas should correspond with grove blocks where leaf samples were collected. The area should contain similar soil types with trees of roughly uniform size and vigor.
- Thoroughly mix the cores in a nonmetal bucket to form a composite sample. Take a subsample from this mixture and place it into a labeled paper bag.
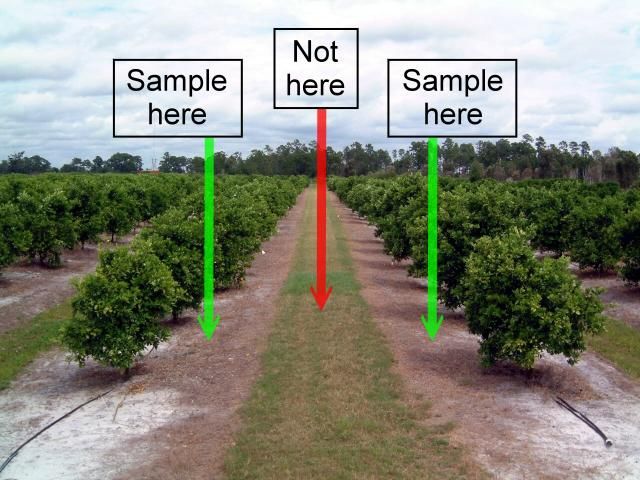
Credit: Thomas Obreza, UF/IFAS
Special Case: Diagnosing Growth Disorders
- Collect soil samples from beneath affected trees as well as normal trees and analyze them separately.
- If possible, confine the sampling area to trees that are close to each other.
Preparation for Analysis
- Soil samples should be air-dried before shipping to the laboratory for analysis.
Analysis and Interpretation
- The basic soil analysis package run by most agricultural laboratories includes soil pH and extractable P, K, Ca, and Mg. Organic matter is sometimes part of the basic package or it may be a separate analysis. Extractable Cu is normally determined upon request.
- Because extractable nutrients are measured, the magnitude of soil test values may differ between different laboratories, but this difference is not a concern as long as the extraction method is calibrated for citrus.
- The laboratory interprets each soil test result as very low, low, medium, high, or very high, and it may also provide fertilizer recommendations accordingly. Citrus growers can independently interpret the numerical results according to UF/IFAS guidelines based on the extractant used (Tables 4 and 5).
- The interpretations should be used to make management decisions regarding soil pH adjustment or fertilizer application (Table 6).
Traditional vs. Alternative Sampling Strategies
A practical nutrient management strategy uses tissue and soil analysis results as tools to help determine nutrient requirements for large grove blocks, followed by uniform fertilizer application across the entire area. An inherent problem with this approach is that some trees may be overfertilized and others may be underfertilized. Citrus grove variability is common, especially on Flatwoods soils. It is important to take this variability into consideration so the grove can be managed more efficiently.
A basic principle of traditional sampling is to return to roughly the same sampling locations from year to year. This technique assumes that the selected area is less variable but also representative of the entire grove or major portion of the block. Representative sites are selected based on tree observation, past experience, crop yield, soil type, and/or remotely sensed images. Traditional sampling minimizes sampling errors, the number of samples taken, cost, and time required, but it does not fully indicate field variability.
With technological advances, the popularity of grid sampling for precision agriculture has increased in Florida's citrus industry. The first step in this strategy is to place a 1- to 5-acre grid over a grove map. The second step is to take soil and/or leaf samples either at the center of each grid section or at the point where the grid lines intersect (Figure 7). The individual taking the samples records the geographic location of each point with a Global Positioning System (GPS) instrument. The third step is to match the analysis results with the geographic data and construct variability maps using Geographic Information System (GIS) software. If appropriate, fertilizer or lime may be custom-applied using an applicator equipped with variable rate technology (VRT).
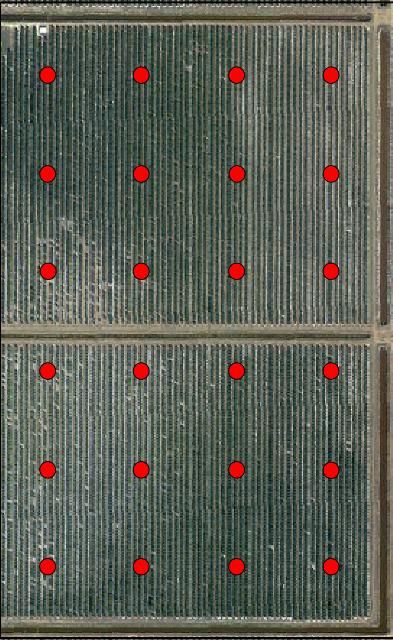
Nutrient management using grid sampling information is still in development, and more research is needed before VRT becomes widely used to manage Florida citrus tree nutrition. Dense grid sampling can be quite expensive and has limited practicality. Growers should carefully compare the potential for a positive return with the cost of the program before employing this method.
Between traditional and grid sampling strategies lies the "management zone" method (Figure 8). Knowledge of grove characteristics such as soil types, high- and low-yielding areas, soil water- and nutrient-holding capacities, and depth to the water table allows a grower to delineate management zones. The zone concept requires less sampling than the grid method, but it is more targeted than the traditional strategy. With this technique, different fertilizer rates can be applied to a smaller number of zones without VRT equipment.
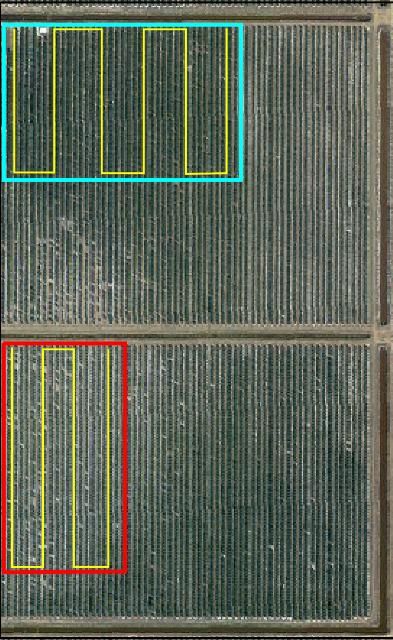
Growers should remain flexible and prepared to adjust sampling and management strategies. Emerging technology will continue to refine sampling systems and integrate information such as yield, tree age, tree size, and soil maps, aerial photographs, and satellite images into nutrient management decision-making.
Summary
Tissue and soil analysis are powerful tools to confirm nutrient deficiencies and toxicities, identify "hidden hunger," evaluate fertilizer programs, study nutrient interactions, and determine fertilizer rates. However, if any steps in site selection, sampling, or analysis are faulty, the results may be misleading.
Experience interpreting sample results is essential due to the many interacting factors that influence the concentrations of elements in soil and leaf tissue. Tree age, cropping history, sampling techniques, soil test interpretations, and leaf analysis standards all must be considered before making a final diagnosis. If done properly, tissue and soil analysis will lead to more economical and efficient use of fertilizers because excessive or insufficient application rates will be avoided.
Soil and Leaf Tissue Analysis Checklist
Use this checklist as a guide for starting a soil and leaf tissue testing program:
- A sampling program is most effective if it is done annually.
- Leaf tissue testing is valuable for all elements.
- Soil testing is most useful for pH, P, Ca, Mg, and Cu.
- Use the standard sampling procedures for soil and leaves described in this chapter.
- Be aware that spray residues or dust on leaf surfaces affect sample results; wash leaves for accurate micronutrient analysis. Avoid sampling recently sprayed trees.
- Be aware that a number of different soil extracting solutions exist, and they can differ in their ability to extract plant nutrients, especially P.
- Interpretation of leaf and soil tests should be used to make fertilizer or liming decisions. Wise use of the results allows optimal citrus production and minimizes fertilizer loss.
Guidelines for interpretation of orange tree leaf analysis based on 4-to-6-month-old spring flush leaves from nonfruiting twigs (Koo et al. 1984).