Introduction
Florida climate is characterized by wet and dry seasons, with rainfall predominantly occurring between June and October. Annual rainfall amounts range from 40 to 60 inches per year depending on the location (Florida Climate Center 2016). Florida rainfall is also spatially variable, meaning rainfall may occur on one side of the street but not on the other side. This is particularly true during the rainy season when weather patterns are driven by thunderstorms (McCollum et al. 2002; Krajewski et al. 2003; Baigorria et al. 2007; Dzotsi et al. 2014).
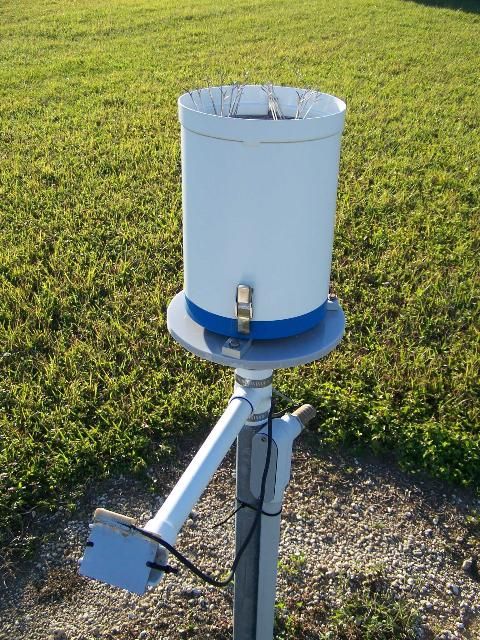
Rainfall is generally measured at weather stations using rain gauges such as tipping buckets (Figure 1). Tipping buckets measure rainfall using a tipping mechanism. Each tip is recorded by a data logger, and tips are totaled on timed intervals.
Credit: K. W. Migliaccio, UF/IFAS
Rainfall may be estimated between rain gauge locations using a combination of rain gauges, interpolation techniques, radar technology, and satellite imagery. Interpolation techniques are statistics procedures that estimate rainfall between gauge points. Radar and satellite data use different approaches to convert information collected by radar or satellite images into rainfall estimates over a spatial surface (Yilmaz et al. 2005).
This document introduces the sources, providers, and types of rainfall data available to Florida researchers and residents to promote understanding of the rainfall data and their application in studies and daily life.
Gauge Rainfall Data Sources
Gauge data are typically collected at a weather station and represent rainfall at that specific location. The following sources of data provide gauge rainfall information on a website or mobile app in near real-time.
Florida Automated Weather Network (FAWN)
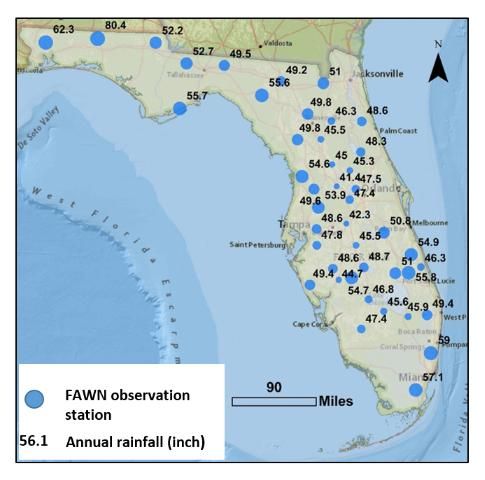
The Florida Automated Weather Network measures and stores weather information from over 40 weather stations in Florida (http://fawn.ifas.ufl.edu/). The FAWN website provides real-time data and historical data for download. FAWN also provides tools for graphing previous rainfall amounts and mapping weekly and daily totals of rainfall. The distribution of annual rainfall amount over the 40 FAWN weather stations was mapped to show annual variation throughout the state (Figure 2).
Credit: FAWN 2016
My Florida Farm Weather (MFFW) App
FAWN also hosts the My Florida Farm Weather app (http://fawn.ifas.ufl.edu/mffw/). This app includes rainfall from FAWN stations, National Oceanic and Atmospheric Administration (NOAA) Meteorological Assimilation Data Ingest System (MADIS) weather stations, and farmer stations that are participating in the Florida Department of Agriculture and Consumer Services (FDACS) cost-share program. The MFFW app is available as a web tool and as a mobile phone app.
AgroClimate App
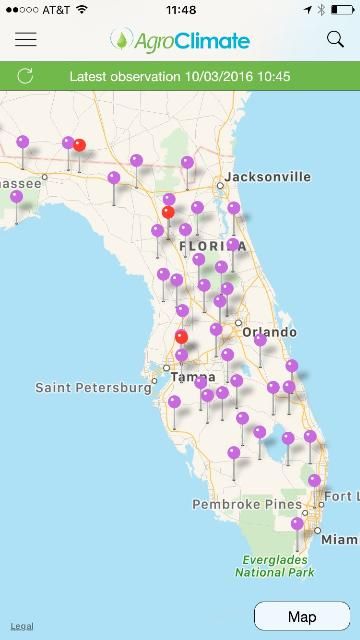
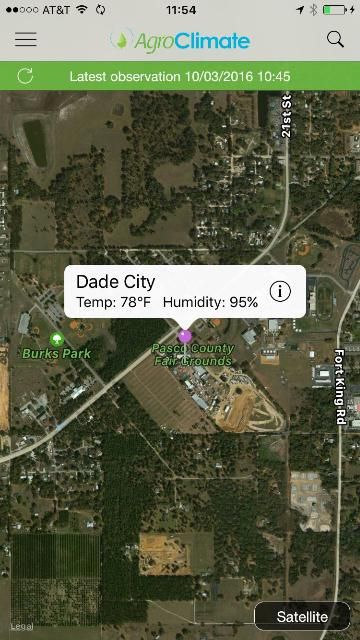
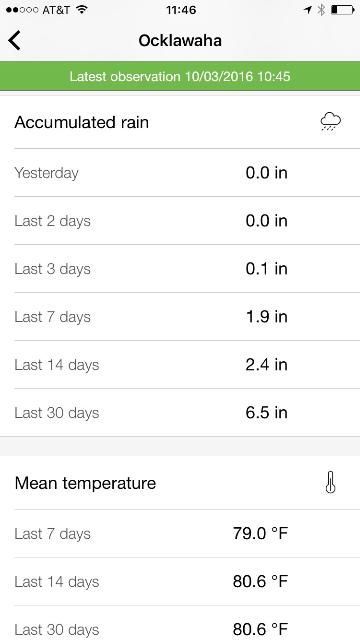
The AgroClimate Mobile app also uses FAWN data but has additional features and a visually appealing format. The app provides summary information for rainfall and other weather measurements. The AgroClimate app also allows users to add a field and associate the field with a weather station, providing customized reports during the cropping season. The app is available in iOS and Android formats in the iTunes and Google Play stores.
Credit: K. W. Migliaccio, UF/IFAS
Credit: K. W. Migliaccio, UF/IFAS
Credit: K. W. Migliaccio, UF/IFAS
Water Management District Gauge Data
Florida's five water management districts have online systems to share rainfall measurements from their jurisdictions. The South Florida Water Management District (SFWMD) operates a database system, DBHYDRO, which provides rainfall data by station, site, basin, county, geographic location coordinates, and agency as well as other data features: http://my.sfwmd.gov/dbhydroplsql/show_dbkey_info.main_menu. The Southwest Florida Water Management District (SWFWMD) also has an online system for hydrologic data sharing, Water Management Information System (WMIS), where a user can find and download rainfall data by county, basin, region, township, and site name and/or identification number: http://www18.swfwmd.state.fl.us/ResData/Search/ExtDefault.aspx.
The St. Johns River Water Management District (SJRWMD) provides an interactive map, Hydrologic Data, showing the locations of weather stations and allowing users to select a station of interest on the map: http://webapub.sjrwmd.com/agws10/hdsnew/map.html. The Suwannee River Water Management District (SRWMD) has an interactive map called Rainfall Stations, which is similar to that of SJRWMD. On the map, a user can identify rainfall gauge stations by county and download a complete rainfall data set of a selected station: http://www.mysuwanneeriver.org/portal/rainfall.htm.
Global Historical Climatology Network (GHCN)
The Global Historical Climatology Network (GHCN) is a database of daily and monthly weather observations made at over 80,000 land stations in 180 countries (Menneet al. 2012). The database is open to the public and downloadable at NOAA: https://www.ncei.noaa.gov/products/land-based-station/global-historical-climatology-network-daily. Historical climate data collected from a variety of sources, including the National Oceanic and Atmospheric Administration (NOAA), European Climate Assessment and Dataset (ECAD), and National Center for Atmospheric Research (NCAR), are merged to the existing GHCN database on a weekly basis, generally after screening and classification processes. The screening eliminates source data for unknown or questionable locations, and the classification identifies new weather sites.
Gridded Rainfall Data Sources
Gridded rainfall data provide a spatial representation of data over a larger area. Data layers may be created in a variety of ways but typically include some radar or satellite information combined with gauge data. Gridded data provide rainfall estimates for locations where rainfall gauges are not present.
Water Management Districts—NEXRAD Data
Next-Generation Radar (NEXRAD) is a network of Weather Surveillance Radar, 1988 Doppler (WSR-88D), operated by the National Weather Service (NWS) of NOAA. The motion of the raindrops and air detected by NEXRAD are processed to a grid map that shows the spatial distributions of rainfall estimates using mathematical algorithms (Stout and Mueller 1968; Skinner et al. 2009). NEXRAD is placed at seven locations in Florida (i.e., Eglin Air Force Base, Tallahassee, Jacksonville, Melbourne, Tampa, Miami, and Key West), covering the entire state (http://www.ncdc.noaa.gov/nexradinv/map.jsp). The SFWMD provides NEXRAD rainfall estimates for its region through DBHYDRO. The SJRWMD operates a website that allows users to view and download daily, monthly, and annual NEXRAD rainfall estimates: http://webapub.sjrwmd.com/agws10/radrain/.
PRISM
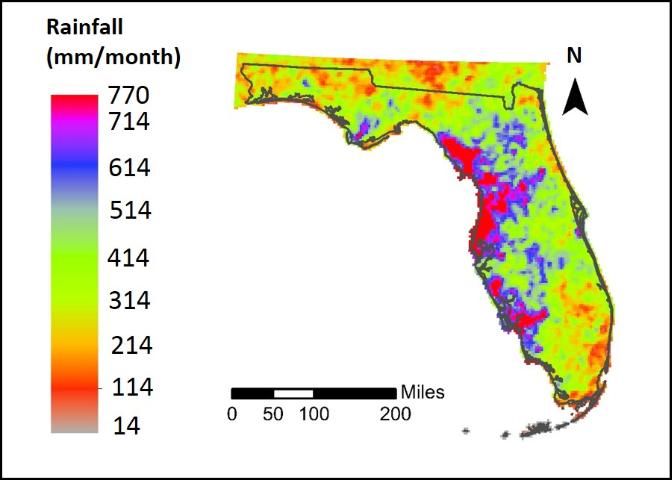
PRISM data originate from the PRISM Climate Group at Oregon State University (http://www.prism.oregonstate.edu/). Daily rainfall data at 4-km grid cell resolution are provided free of charge by PRISM. The PRISM system (Dalyet al. 1994; Dalyet al. 2000; Daly et al. 2002; Daly 2006) was developed to interpolate climate data in complex landscapes. PRISM is a regression model with the assumption that elevation is the primary factor in determining the distribution of rainfall and other climate parameters such as temperature. PRISM data were used to create a spatially distributed rainfall map for Florida considering rainfall in July 2015 (wet season; Figure 3). PRISM rainfall data are also available on AgroClimate: http://agroclimate.org/tools-old/climatology/.
RTMA
RTMA (Real-Time Mesoscale Analysis) data originate from the NOAA-NWS gridded surface analysis system. RTMA products are available for download at https://www.nco.ncep.noaa.gov/pmb/products/rtma/. Hourly rainfall data at 2.5-km grid cell resolution are produced by the RTMA system (De Pondecaet al. 2011). The RTMA hourly rainfall amount is obtained by bilinearly interpolating hourly precipitation analysis from the 4-km Hydrologic Rainfall Analysis Project grid (Lin and Mitchell 2005) to the 2.5-km grid cell used by RTMA.
Credit: Copyright © 2016, PRISM Climate Group, Oregon State University, http://prism.oregonstate.edu. Map created December 2016.
Using Rainfall Data
Rainfall data are used for many different purposes in research and practice. Real-time daily rainfall data can be used by urban and agricultural irrigators to determine if and when irrigation is needed. Irrigation scheduling is best managed when both rainfall and evapotranspiration (ET) data are used to make an irrigation decision. Rainfall data may be used to delay irrigation for a specific number of days based on the amount of rainfall received. Rainfall data may also be used to estimate flooding potential in low-elevation areas or areas where aquifers are near the surface.
Historical records of rainfall data may be used to determine if drought conditions are anticipated. When rainfall rates are lower than historical average rates, there is an increased risk of drought. The US Drought Monitor is a good tool for drought assessment (http://droughtmonitor.unl.edu/). As the main source of fresh water, rainfall's amount, frequency, and intensity have been studied. Its data will continue to provide important and useful information for agricultural management, hydrologic analysis, and water resources planning.
Summary
Different types of data may be more appropriate for different uses. Gauge rainfall data measured at a weather station might be used when exact values or quick information are needed because this information is typically easier to access. Gridded rainfall data created from measured data, imagery, and mathematical relationships might be used if the location of interest is not close to a gauge point. All of the rainfall data sources discussed in this document are open to the public. The providers prepare the data in a variety of formats and methods. Understanding the differences among them would help individuals use the data efficiently.
References
Baigorria, G. A., J. W. Jones, and J. J. O'Brien. 2007. "Understanding rainfall spatial variability in southeast USA at different timescales." International Journal of Climatology 27: 749–760.
Daly, C. 2006. "Guidelines for assessing the suitability of spatial climate data sets." International Journal of Climatology 26: 707–721.
Daly, C., W. P. Gibson, G. H. Taylor, G. L. Johnson, and P. Pasteris. 2002. "A knowledge-based approach to the statistical mapping of climate." Climate Research 22: 99–113.
Daly, C., R. P. Neilson, and D. L. Phillips. 1994. "A statistical-topographic model for mapping climatological precipitation over mountainous terrain." Journal of Applied Meteorology 33: 140–158.
Daly, C., G. Taylor, W. Gibson, T. Parzybok, G. Johnson, and P. Pasteris. 2000. "High-quality spatial climate data sets for the United States and beyond." Transactions of the ASAE 43: 1957.
De Pondeca, M. S., G. S. Manikin, G. DiMego, S. G. Benjamin, D. F. Parrish, R. J. Purser, W.-S. Wu, J. D. Horel, D. T. Myrick, and Y. Lin. 2011. "The real-time mesoscale analysis at NOAA's National Centers for Environmental Prediction: Current status and development." Weather and Forecasting 26: 593–612.
Dzotsi, K., C. Matyas, J. Jones, G. Baigorria, and G. Hoogenboom. 2014. "Understanding high resolution space‐time variability of rainfall in southwest Georgia, United States." International Journal of Climatology 34: 3188–3203.
FAWN. 2016. "FAWN—Florida Automated Weather Network." UF/IFAS Extension. Accessed on January 12, 2017. http://fawn.ifas.ufl.edu/
Florida Climate Center. 2016. "Average annual precipitation." Florida State University, Office of the State Climatologist. Accessed on October 13, 2016. https://climatecenter.fsu.edu/products-services/data/weather-planner-maps/average-annual-precipitation
Krajewski, W. F., G. J. Ciach, and E. Habib. 2003. "An analysis of small-scale rainfall variability in different climatic regimes." Hydrological Sciences Journal 48: 151–162.
Lin, Y., and K. E. Mitchell. 2005. "1.2 the NCEP stage II/IV hourly precipitation analyses: Development and applications." 19th Conf. Hydrology, American Meteorological Society, San Diego, CA, USA. Citeseer.
McCollum, J. R., W. F. Krajewski, R. R. Ferraro, and M. B. Ba. 2002. "Evaluation of biases of satellite rainfall estimation algorithms over the continental United States." Journal of Applied Meteorology 41: 1065–1080.
Menne, M. J., I. Durre, R. S. Vose, B. E. Gleason, and T. G. Houston. 2012. "An overview of the Global Historical Climatology Network—Daily database." Journal of Atmospheric and Oceanic Technology 29: 897–910.
PRISM Climate Group, Oregon State University. 2017. "PRISM climate data." PRISM Climate Group. Accessed on January 12, 2017. http://www.prism.oregonstate.edu/
Skinner, C., F. Bloetscher, and C. S. Pathak. 2009. "Comparison of NEXRAD and rain gauge precipitation measurements in south Florida." Journal of Hydrologic Engineering 14: 248–260.
Stout, G. E., and E. A. Mueller. 1968. "Survey of relationships between rainfall rate and radar reflectivity in the measurement of precipitation." Journal of Applied Meteorology 7: 465–474.
Yilmaz, K. K., T. S. Hogue, K. L. Hsu, S. Sorooshian, H. V. Gupta, and T. Wagener. 2005. "Intercomparison of rain gauge, radar, and satellite-based precipitation estimates with emphasis on hydrologic forecasting." Journal of Hydrometeorology 6(4): 497–517.