Introduction
Modern crop fertilization programs are complex in nature, resulting from the interaction of many factors. One important factor is fertilizer cost, which is a significant portion of the total crop production expenses. Fertilizer costs, as a percentage of total costs of production, can range from 5% to 10% for vegetable crops. Prices of all fertilizer ingredients rose sharply in 2008, and again in 2022, mostly because of high oil prices, international disturbances, and increased demand from developing countries. Fertilizer costs will continue to increase as a proportion of crop production costs. Excessive fertilizer use can contribute to lost profits when a yield increase is not associated with the increase in fertilizer use.
Application of unneeded nutrients contributes not only to farming inefficiency, but also, potentially, to groundwater pollution. Loss of nutrients is possible when nutrient levels in excess of what the crop can use are applied. These extra nutrients are subject to movement out of the root zone, off the field, and into ground or surface water bodies. Total Maximum Daily Load levels (TMDLs) for nutrients have been set for many water bodies in Florida, including water bodies in vegetable farming areas. Where TMDLs have been set, farmers are asked to follow fertilizer BMPs to reduce the chance of nutrient losses to the impaired water bodies. More information on the vegetable BMPs can be found at: https://www.fdacs.gov/Agriculture-Industry/Water/Agricultural-Best-Management-Practices. Careful use of fertilizers, by following the BMPs, will save money and reduce the chances of governmental monitoring and regulation.
Adding to the complexity of fertility programs is the wide array of fertilizing materials, formulations, methods, and timing of applications, which will vary depending on the crop and soil used. Extension educators refer to the "4Rs" of nutrient management; these 4Rs (right rate, right timing, right source, right placement) are described in the following EDIS document: The 4Rs of Nutrient Management (https://edis.ifas.ufl.edu/ss624). We introduce the “5th” R (right irrigation), which addresses the need to apply the right amount of irrigation water to avoid leaching of mobile nutrients like nitrogen. Technologies have been evolving for efficient methods of applying fertilizers, such as fertigation, drip irrigation, and liquid injection wheels. Technologies in controlled-release fertilizers (CRFs) are advancing so that CRFs are more efficient and less costly. In addition, cultivars of single crops sometimes differ in nutrient requirements, and breeding efforts are underway to develop more nutrient efficient cultivars. Because of this complexity, it is imperative that farmers spend time planning their fertilization programs. As part of this program, good soil-testing techniques should be practiced before planting. The small amounts of time and money invested in testing will pay off handsomely in the long run. For soil-testing kits and guidance, consult a local UF/IFAS Extension agent. This publication focuses on vegetable fertilization in various regions of Florida and provides information about the principles and methods needed to construct a well-planned fertilization program that is consistent with BMPs. Many principles and practices for fertilizer management are similar for all field crop production.
Fertilizer Terms Used in this Document
Band—A narrow strip of fertilizer placed along the row of plants or seeds on or below the soil surface.
Best management practice (BMPs)—Agricultural BMPs are practical, cost-effective actions that agricultural producers can take to reduce the amounts of pesticides, fertilizers, animal wastes, and other pollutants entering our water resources. BMPs are designed to benefit water quality while maintaining or even enhancing agricultural production and profitability.
Blend—A mixture of several fertilizer sources or ingredients to be applied to the crop. Blends may be dry, or in suspensions or solutions.
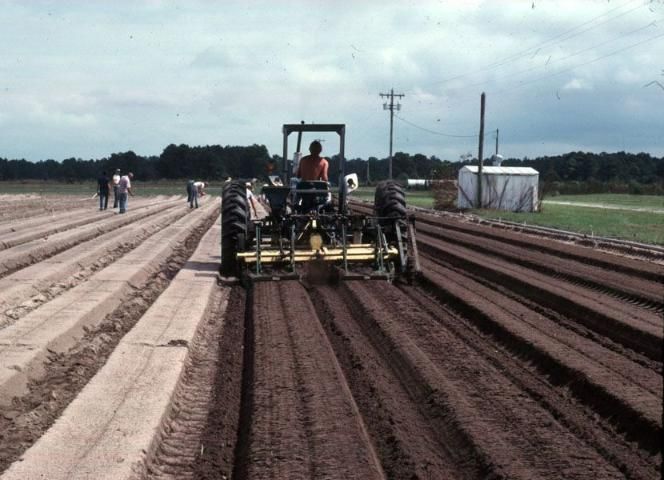
Broadcast—Spreading fertilizer evenly over the entire soil surface and, usually, thoroughly incorporating it. The modified broadcast method involves broadcasting the fertilizer in a 3- to 4-foot swath in the bed area only (Figure 1).
Credit: undefined
Bulk fertilizer—Commercial fertilizer, often a blend, delivered in a non-packaged manner, for example a bulk truck load.
Controlled-release fertilizer—A fertilizer where granules are formulated in such a manner as to provide nutrient release throughout a period of time, depending on temperature and moisture, i.e., not rapidly soluble. Controlled release is achieved by special coatings such as sulfur and or polymers. Nutrient release profile is defined by the type of coating and/or the thickness and is further modified by the soil temperature and moisture.
Crop nutrient requirement (CNR)—The total amount of plant nutrients needed by a crop for maximum productivity. This amount is supplied by native soil fertility, which is supplemented as needed by chemical fertilizers and/or organic nutrient sources (e. g., manures, bio-solids, cover crops, etc.).
Fertilizer grade—The minimum guarantee of available plant nutrients expressed in terms of total nitrogen (N), available phosphorus (P), and soluble potassium (K). For example, a grade of 20-5-20 contains 20 percent N, 5 percent available P (expressed as P2O5), and 20 percent soluble K (expressed as K2O).
Fertilizer recommendation—A guideline, based on research, for applying and managing fertilizer for a crop to result in acceptable crop production and to minimize negative environmental impacts. The recommendation has several parts, including the rate, timing, placement, supplemental applications, and importantly, related practices, such as irrigation management to prevent fertilizer leaching. A recommendation does not solely consist of the amount (rate) of fertilizer to use. More information on fertilizer recommendations can be found at: Principles of Sound Fertilizer Recommendations at https://edis.ifas.ufl.edu/ss527.
Fertigation—Application of fertilizer to crops by injecting nutrients through the irrigation system, specifically drip irrigation or sprinkler (center pivot).
Filler—A substance added to fertilizer materials to bring a fertilizer mix to a certain weight and prevent caking. Common fillers are dolomite and sand.
Granular fertilizer—Fertilizer present in small, solid particles. Particles can be ground-up minerals or chemically formulated salts.
Homogenized fertilizer—Fertilizer manufactured by a complex method. The basic operation is ammonization of normal or triple superphosphate together with sulfuric and/or phosphoric acids followed by drying, cooling, and screening. The process allows plant nutrients, especially micronutrients, to be evenly distributed in each granule. Also called granulated fertilizer.
Leaching Rain Rule—A guideline for adding supplemental N and K fertilizers. When there are 3 inches of rain in 4 days or 4 inches of rain in a 7-day period, a supplemental application of fertilizer would be advised to replace the nutrients leached by the rain.
Linear Bed Foot System—An approach for fertilizer rate recommendations that standardizes the fertilizer rate across several potential planting patterns (bed spacings) for vegetable crops. The principle is that the same amount of fertilizer is applied in the row irrespective of the bed spacing. More is explained about the LBF system here: https://edis.ifas.ufl.edu/ss516.
Liquid fertilizer—Fertilizer nutrients supplied in true solution form.
Micronutrients—Essential plant nutrients required in small quantities, also called minor elements. The term "micro" or "minor" does not denote a minor influence on plant nutrition. Deficiencies of these nutrients can have significant impact on crop growth. The micronutrients are iron (Fe), boron (B), chlorine (Cl), copper (Cu), manganese (Mn), zinc (Zn), and molybdenum (Mo). Recently nickel (Ni) has been added to the list of essential micronutrients. In most cases there is a fine line between sufficient amounts and toxic amounts of these nutrients.
Placement—The location of the fertilizer in the soil relative to the plant or seed.
Primary nutrients—The term used by the fertilizer trade for N, P, and K.
Recommended fertilizer rate—The amount of fertilizer projected to be needed, based on research, for optimum crop production, and with attention to minimizing negative environmental impacts. The recommended rate results from a calibrated soil test. There are times when more than the recommended amount might be needed, for example when leaching rainfall occurs. The rate aspect is only a part of the crop fertilization recommendation. Fertilizer source, placement, timing and importantly irrigation management must be considered along with rate as part of a complete fertilizer best management practice.
Secondary nutrients—The term used by the fertilizer trade for calcium (Ca), magnesium (Mg), and sulfur (S). The terms "primary", "secondary", and "micro" or "minor" relate to the relative amounts of these fertilizers typically applied in most farming situations, not to their relative importance in plant nutrition.
Sidedress—Application, usually by banding, of fertilizer after the crop is planted and typically made to the side of the row of plants.
Slow-release fertilizers—fertilizers that because of their makeup release nutrients with time due to microbial degradation of the compound, such as urea formaldehyde, or physical breakdown of a coating as in sulfur-coated urea.
Soil reaction or pH—A measure of the acidity or alkalinity of the soil. The pH is defined as the negative logarithm of the hydrogen ion concentration. A pH of 7 is neutral greater than 7 is basic, and less than 7 is acidic. The increased use of high-pH irrigation water from wells over the last few decades has resulted in increases in soil pH in many areas of the state.
Source—The kind or origin of the fertilizer nutrients. For example, sources of N include urea, ammonium nitrate, ammonium sulfate, potassium nitrate, chicken manure, and bio-solids. The source is sometimes important when deciding how to supply plant nutrients to a vegetable crop. For example, a certain N source might be chosen instead of another because the former also supplies a second needed nutrient that the latter does not. Also, cost per unit of nutrient might be important.
Split application—The required fertilizer amount applied in two or more portions during the growth cycle.
Supplemental application—Fertilizer in addition to the fertilizer portion of the crop nutrient requirements applied to a crop during the growing season. The uses and number of supplemental applications depend largely on the intensity and duration of rainfall and the length of the cropping season. Supplemental applications may be needed after leaching rainfall or in situations where the crop will be grown for a longer season, typically due to continued high market prices.
Suspension fertilizer—A fluid mixture containing dissolved and undissolved nutrient materials and inert materials that often requires continuous mechanical agitation during application to the crop.
Timing—Coordination of the time periods during the crop growth cycle when the fertilizer is to be applied; for example, pre-plant, at-planting, etc.
Unit—One percent (1%) of a ton, i.e., 20 pounds. A term used by the fertilizer industry to refer to amounts of fertilizer nutrients. Do not confuse per ton with per acre. Growers should only be concerned with pounds per acre. Be sure that the purchased fertilizer material can supply the needed amounts of nutrients in pounds per acre.
Soils Used for Crop Production
Florida vegetables are produced successfully on a wide variety of soil types. For the purpose of simplifying fertilizer recommendations, soils are placed in three general categories: mineral soils, organic soils, and calcareous soils. All soils require irrigation during dry weather periods for optimum crop production. More information on the soils of Florida can be found at: Agricultural Soils of Florida (https://edis.ifas.ufl.edu/publication/SS655).
Mineral soils. This group includes sand, sandy loams, and loamy sands, which require a dependable moisture supply from rains and irrigations. Also included in this group for fertilizer recommendations are the mucky sand soils. Because of their sandy nature, the above soil types require careful management of irrigation and fertilizer programs to ensure maximum yields (Figures 2 and 3). The sandy mucks, because of their higher organic matter content, require less N than other mineral soils. Nitrogen is highly mobile in sandy soils and moves with the water in the soil. Therefore, N and irrigation should be managed together to keep N in the root zone and minimize the chances for N leaching to the ground water. Potassium can be mobile in sandy soils, especially coarse sandy soils with low cation exchange capacity.
Credit: undefined
Credit: undefined
Calcareous soils. These soils are composed largely of calcareous marine deposits and have a pH in the range of 7.5 to 8.5. The high pH fixes some plant nutrients, such as certain micronutrients, in insoluble form, making special fertilizer management practices necessary for these soils. Fertilizer recommendations for the calcareous soils, especially the marl and gravelly loam of Dade County, are lower than for other mineral soils mainly because of reduced plant growth on the high pH soil. The reduced plant growth is caused by a variety of reasons, including the high fertilizer-fixing capacity of both soils and the shallowness of the marl and gravelly loam soil. Because these soils, occurring in southern Florida, are used for winter vegetable production, the short days and reduced sunlight intensity during winter also contribute to reduced plant growth. Based on soil particle size, calcareous soils can be divided into two groups:
Marl soil. This calcareous soil consists of fine, clay size particles of a narrow size range.
Gravelly loam soil. This calcareous soil is composed of a wide range of particle sizes. The soil is very shallow and made of approximately one-fourth calcareous rock (Figure 4).
Credit: undefined
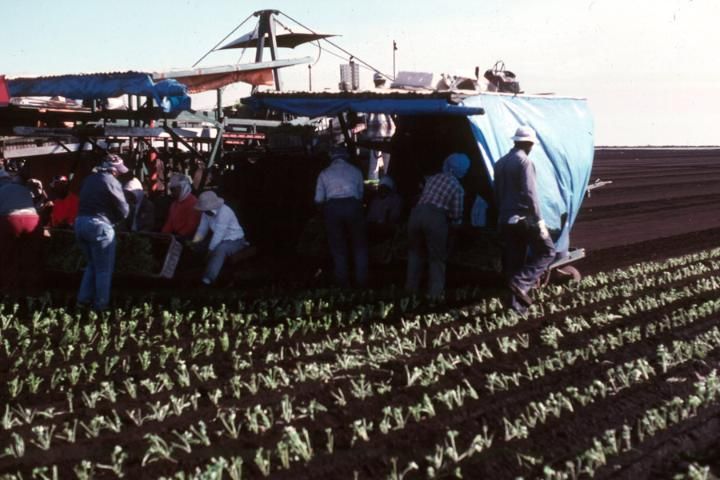
Organic soils. These soils include the peat and muck soils, which are composed largely of organic matter (Figure 5). As these soils oxidize, large amounts of N are provided to the crop. Therefore, additional fertilizer N is not usually required, except for vegetables such as sweet corn or lettuce growing in cool weather conditions. With oxidation (mineralization), muck soils become very shallow, also known as subsidence (muck subsidence). The root zone is in closer proximity to the underlying calcareous subsoil as subsidence progresses. Regular cultivation practices, such as tillage, pick up calcium carbonate pieces from the bedrock and mix it with surface soil. Soluble calcium carbonate also travels up into surface soil through capillary movement and evaporation of soil water. As a result, soil pH and carbonate levels increase, often by limiting plant availability to selected nutrients, such as P. Band applications of fertilizer often overcome this reduced nutrient availability caused by higher pH.
Credit: undefined
Soil Testing
There are 17 elements (C, H, O, P, K, N, S, Ca, Fe, Mg, B, Mn, Cu, Zn, Mo, Cl, and Ni) required by plants for optimum growth and yield. The soil itself can supply many of these nutrients in abundance for crop growth. Soil testing is used to determine which nutrients can be supplied from the soil, and in what amounts throughout the season. By using soil testing, the amount of fertilizer to supplement the nutrient-supplying capacity of the soil can be determined. Soil testing, however, is not used for predicting N fertilizer needs because sandy soils in Florida do not retain appreciable amounts of N, and N leaches readily, making N fertilizer prediction difficult. Split applications and careful management of irrigation help provide for efficient use of the crop N requirement.
To receive the most benefit from soil testing, quality soil samples that adequately represent the field should be collected. These samples must be analyzed by a competent soil-testing laboratory. Different laboratories use different methodologies to analyze soil samples and therefore not all laboratories can provide the best fertilizer recommendations for all situations. Growers must choose a laboratory that uses lab methods developed to analyze the type of Florida soils being tested, and that can provide fertilizer recommendations based on field calibration research for that soil and production system. The Mehlich-3 soil test extractant has been calibrated for use in Florida (https://edis.ifas.ufl.edu/ss620). Calibration research refers to studies conducted to determine the relationship between specific concentrations of nutrients in the soil and the required fertilizer amounts needed to supplement the soil fertility to achieve optimum yield. For more information about soil testing and fertilizer see the following publication of soil testing for Florida (https://edis.ifas.ufl.edu/ss620).
Controlling pH
In general, the most suitable pH range for many vegetables is 6.0 to 6.5. However, some vegetable crops will tolerate slightly more acidic soils (Table 1). Liming acidic soils will avoid aluminum (Al) and manganese (Mn) toxicities. It is in the aforementioned pH range, on mineral soils, that most fertilizer nutrients are in greatest availability. There are cases where crop production at less-than-optimum pH is unavoidable. An example is the use of acidic soils for potato scab control. Another example is the alkaline soils of Dade County, where adjustments in rates and placement must be made for that portion of the fertilizer that is fixed by the soil.
Liming. On some newly cleared land, soil tests have indicated that lime is required to achieve a suitable pH. Raising the pH to 6.0–6.5 increases the availability of most fertilizer nutrients on these soils and also increases the activity of soil microorganisms such as the nitrifying bacteria. Only small amounts of lime are required to change the pH of sandy soil. Therefore, use of a soil test and a calibrated lime requirement test will guide the grower to correct liming and will reduce the possibility of over-liming.
Avoid over-liming. When routine limestone applications are made without reference to soil testing and/or where basic (high pH) irrigation water is applied, the soil pH can be pushed into the excessively basic range. Over-liming can lead to nutrient deficiencies, especially with micronutrients, and excess lime can reduce the accuracy of soil-testing programs and resulting fertilizer recommendations.
When adding lime, it is critical that it be thoroughly incorporated in the soil throughout the plow zone. The amount of lime to use is specified in the recommendations by the Florida Extension Soil Testing Laboratory in Gainesville. The lime requirement test (Adams-Evans test) used by the UF/IFAS Extension Soil Testing Lab is preferable to a water-pH test for determining liming need. Lime is used to neutralize the two sources of acidity in soils. The first is the soluble or active H+ or acidity and the second is the potential acidity, which consists of exchangeable H on soil particles or organic matter. The potential H could become active during the season when the H+ ions are released. A water-pH test only measures the soil active acidity and cannot predict liming requirements for potential acidity; the lime-requirement test is needed. If time is short, it is better to apply the lime any time before planting than not to apply it at all.
The most commonly used liming materials (Table 2) are calcite (CaCO3) and dolomite (CaMg(CO3)2. Dolomite is an excellent lime material having a neutralizing value slightly higher than calcite. Dolomite also supplies Mg, a nutrient often low in sandy Florida soils. Fast-acting liming materials such as hydrated lime and burnt lime should be used with extreme caution since they can cause severe crop damage if used in excess.
The actual change in soil pH is brought about by the reaction of the carbonate in the agricultural lime, not the presence of Ca. The carbonate reacts with the H+ in the soil solution and on exchange sites to produce carbon dioxide and water. The pH is increased when the H+ is combined to form water.
Other anions that may be associated with a Ca source, such as in gypsum (calcium sulfate) or calcium nitrate, do not have any effect on soil pH.
Basic (alkaline) soils. The most commonly used material for reducing soil pH is elemental S, which is applied like lime. Amounts needed are estimated by methods similar to those for lime requirement. The use of S to reduce soil pH is practical only on mineral soils in Florida that have been over-limed. This might occur through the use of alkaline irrigation water. Soils normally high in pH, such as marl and gravelly loam cannot be economically changed. On the latter soil types, band placement is an economical approach to combating the effect of the high pH.
Other means to combat high pH might be to apply nutrients via drip irrigation so that nutrients are applied nearer to the root zone. For micronutrients, foliar application might be a suitable means to apply nutrients to crops, bypassing any effects the soil might have on micronutrient availability. More information on lowering soil pH can be found at: https://edis.ifas.ufl.edu/ss651.
Fertilizers
The crop nutrient requirement (CNR) for a specific crop is determined from field experiments that test the yield response to levels of added fertilizer. For example, a K study of watermelon might be conducted on a soil that tests very low in extractable K. In this situation, the soil is expected to contribute negligible amounts of K to watermelon growth or yield and all of the CNR would be expected to be supplied from fertilizer. The researcher then plots the relationship of crop yield to K fertilizer rate. In this example, the CNR is equivalent to the fertilizer rate above which no significant increases in yield resulted. The CNR values derived from similar experiments take into account factors such as fertilizer efficiencies in various soils. If data are available from several experiments completed in several seasons, then reliable estimates of CNR values can be made.
Vegetable fertilization recommendations must consider both yield and quality. For example, enough fertilizer must be recommended for crisphead lettuce to achieve high biomass yields and large, firm, marketable heads.
Fertilizer sources and formulations. There are many fertilizer sources for the various nutrients needed by plants (Table 3). Some are more economical than others and some sources supply more than one element. Sometimes solubility characteristics or a controlled-release aspect might be important.
Nitrogen—During the last few decades, the most commonly used N sources in agriculture were ammonium nitrate and urea. Because it can be used as an explosive, availability of dry ammonium nitrate has become more restricted. On most soils fumigated with a general purpose fumigant, or for crops planted in cool soils, at least 20 to 25 percent of the N applied should be in the nitrate form, the preferred form for uptake by most plants. Ammonium-N is rapidly converted to nitrate-N in our warm and moist soils, so there should be no concern about using ammonium forms of N to supply most of the crop’s N requirement.
Phosphorus—Normal (ordinary) superphosphate and triple (concentrated) superphosphate are excellent sources of P, both contributing Ca as well. Normal superphosphate also contributes S and often Fe. Superphosphates are not as readily available in the marketplace today as the ammoniated forms of P. Other sources are monoammonium and diammonium phosphate, monopotassium phosphate, and phosphoric acid. Diammonium phosphate, when banded with micronutrients, has been shown to reduce uptake of certain micronutrients when high rates of P were needed and the soils were low in micronutrients. Availability of P from diammonium phosphate has been shown to be reduced compared to triple superphosphate if applied to some soils before liming. Diammonium phosphate should be used cautiously for part of the N and P supply if it is to be banded with micronutrients.
Potassium—Potassium can be supplied from several sources including potassium chloride, potassium nitrate, potassium sulfate, potassium-magnesium sulfate, or monopotassium phosphate. There should be little concern about the K source or its salt index as long as soil-test recommended rates of K are applied.
Calcium, Sulfur, and Magnesium
Calcium, sulfur, and magnesium deficiencies are seldom a problem in Florida. Calcium usually exists in adequate supply from the soil for most vegetables, especially in irrigated or recently limed soils. Calcium will be in abundant supply from soils with a Mehlich-3 Ca index of 300 ppm or greater. Calcium is not mobile in the plant; therefore, foliar sprays of Ca are not likely to correct serious Ca deficiencies, especially in fruit. Calcium does not mobilize in large enough quantities from the leaf to the fruit. Calcium deficiencies such as leaf tip burn and blossom-end rots can be worsened by inadequate irrigation management and by excessive fertilization from N or K. For example, the highest quality pepper fruits result from attention to both fertilization and irrigation.
Sulfur deficiency is rarely a problem for Florida vegetables. Sulfur deficiency would most likely occur on deep, sandy soils low in organic matter, after leaching rains or where S-containing fertilizers have not been applied for several seasons. If S deficiency has been diagnosed, it can be corrected by using S-containing fertilizers, such as magnesium sulfate, ammonium sulfate, potassium sulfate, normal (ordinary) superphosphate, or potassium-magnesium sulfate. Using one of these materials in the fertilizer blend at levels sufficient to supply 30 to 40 lb S/A for the season should minimize the potential for S deficiencies. In many areas of Florida, ample S will be supplied through the irrigation water from wells.
Magnesium deficiency may be a problem for vegetable production on deep, sandy soils. When the Mehlich-3 soil-test index for Mg is less than 20 ppm, research has shown that 30 lb Mg/A will satisfy the Mg CNR. If lime is also needed, Mg can be added by using dolomite as the liming material. If no lime is needed, then the Mg requirement can be satisfied through use of magnesium sulfate or potassium-magnesium sulfate. Inclusion of the Mg source in the fertilizer(s) to be applied to the soil or using a homogenized fertilizer that contains the correct amount of Mg are excellent ways of insuring uniform application of Mg.
Micronutrients. On most native soils brought into production and on cropped soils showing low micronutrient test values, a micronutrient fertilizer is recommended. This fertilizer (depending on soil test and crop) should contain, per acre, 3 to 6 pounds of Cu, 2 to 4 pounds of Zn, 6 to 12 pounds of Mn and Fe, and 1 to 2 pounds of B singly or in combinations. The micronutrients can be supplied as sulfates, oxides, or chelates.
Micronutrients are more thoroughly incorporated in the fertilizer when the fertilizer material is homogenized or liquid. Homogenized and liquid fertilizers are manufactured in a manner that ensures uniform distribution of nutrients in all granules or throughout the fertilizer solution. One of the problems with dry bulk blends is that the micronutrients, present in such small quantities and particle sizes, tend to settle out, and are difficult to mix uniformly.
The amounts of micronutrients in pesticides used on crops should be considered when planning a micronutrient fertilizer program. Micronutrients from pesticides can accumulate in the soil from leaf runoff and from decaying plant material. In many production areas, micronutrients have built up in the soil to levels such that no additional micronutrients from fertilizers are needed.
Organic fertilizers. Organic materials, such as manure, can be good fertilizers (Table 4). Not only do they supply nutrients, but they also add organic matter to the soil to increase its water-holding capacity and tilth if applied in large enough quantities. However, for most situations, transportation cost reduces the economic return from the use of organic fertilizers. In addition, most organic sources cannot readily supply enough of all nutrients so that, in most cases, supplementing with synthetically manufactured fertilizers is needed. Organic materials contain N and, when applied at high rates, a large amount of N is released and can then be leached into ground water. Growers should use a laboratory analysis of the organic material to determine appropriate application rates.
As municipalities begin to deal with reducing the waste stream, governments look to agriculture as a potential user of nutrient-containing waste products. Composted municipal solid waste can be used as a soil amendment to improve the soil water-holding capacity, add organic matter, and add some plant nutrients. However, growers should thoroughly investigate the compost company for information on composting process, maturity of the compost, and nutrient content. Immature compost can cause growth problems due to nitrogen being robbed from soil in the field to complete the composting process.
Controlled and slow-release fertilizers. Several forms of controlled- or slow-release fertilizers are available for supplying N and K. Research has shown increases in yields of some vegetables when slow-release fertilizers, such as sulfur-coated urea or isobutylidene-diurea; or controlled-release fertilizers, such as polymer-coated potassium nitrate or urea, were used to supply a portion of N or K requirement. Nutrient release is typically controlled by temperature and moisture in the soil and/or the thickness and type of coating. Although more expensive, these materials may be useful in reducing fertilizer losses through leaching, in decreasing soluble salt damage, and in supplying adequate fertilizer for long-term crops such as strawberry, tomato, or pepper. Recent research with potato showed the total N fertilizer could be reduced to less than 200 lbs per acre with controlled-release materials.
Fertilizer movement in the soil. Nitrates, chlorides, and sulfates move readily with the upward or downward movement of water in the soil. These salts can accumulate at the soil surface where water evaporates or can be leached from the root zone by over-irrigation or rainfall. The movement of nitrate in soils is of particular concern in a growing area within a watershed with an impaired water body. Growers should follow BMPs for management of nutrients and irrigation. On very sandy soils, K, Mg, and B also may be subject to leaching. Phosphorus, however, does not readily move in most soils, except the coarse uncoated sands. Because of this, P fertilizer, if needed, should be placed in the root zone. That fertilizers can leach in the soil points out the importance of managing fertilization and irrigation practices in concert.
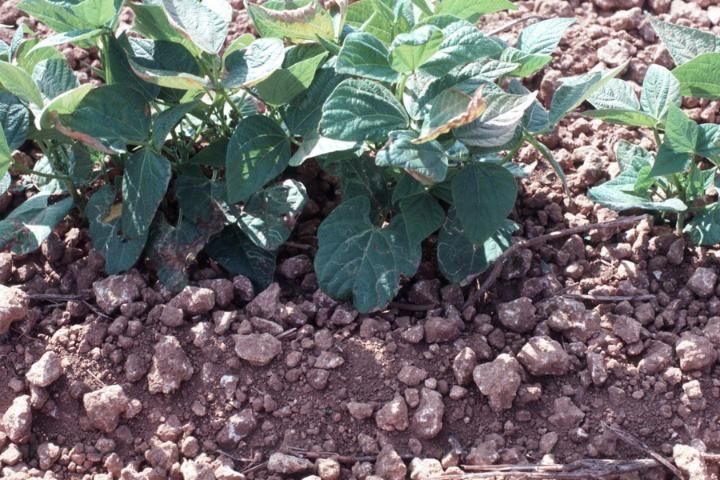
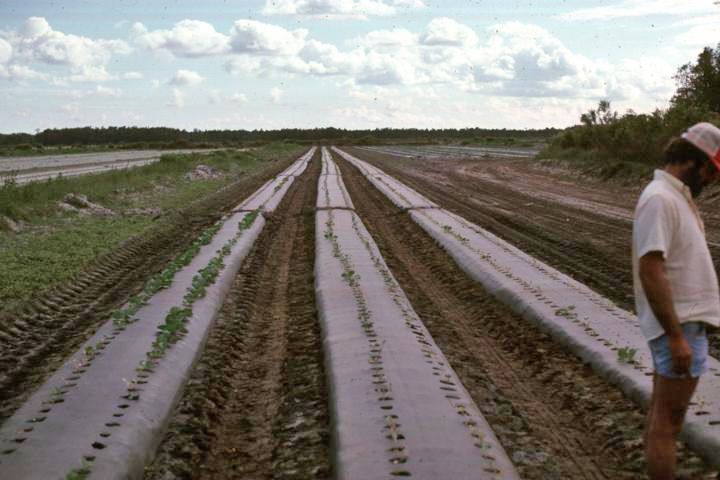
Soluble salts. Over-fertilization or placement of fertilizer too close to the seed or root leads to soluble salt injury or burn (Figure 6). Injury occurs because the increased salt level in the soil causes less water to move to the root, (the salts attract the water), leading to water stress and desiccation of the roots. Fertilizer sources differ in their capacity to cause soluble salt injury. However, it is usually the excessive rate of fertilizer or the close placement and not the specific fertilizer source that is most often associated with fertilizer burn.
Credit: undefined
Fertilizer Application
Fertilizer rate. The rates of fertilizer are usually expressed as an amount of a nutrient per acre, e.g. 150 lbs N per acre. The rates are calculated based on a broadcast application approach even in cases where the fertilizer is applied only to the mulched area in the field. With the mulch system, row (bed) spacing for a particular crop can vary depending on grower preference. If bed spacings wider than typical are to be used, then the amount of fertilizer per length of row should not change from the typical bed spacing for that crop. However, because there are fewer bed feet of crop per gross acre with wider bed spacing (43,560 sq ft), the total amount of fertilizer used will be proportionately less. For example, the typical bed spacing for watermelon is 8 ft (5445 linear bed feet per gross acre). If the fertilizer rate for watermelon is 150 lbs per acre, then the fertilizer rate can also be expressed as 2.75 lbs N per 100 linear bed feet (150 ÷ 54.45). This same application rate, 2.75 lbs N per 100 linear bed feet, should be used no matter what spacing is chosen by the grower. More information on specific bed spacing situations is presented by Hochmuth and Hanlon in "Calculating Recommended Fertilizer Rates for Vegetables Grown in Raised-Bed, Mulched Cultural Systems" at https://edis.ifas.ufl.edu/SS516.
Fertilizer placement (general). Fertilizer rate and placement must be considered together. Placing low amounts of fertilizer too close to plants can result in the same amount of damage as placing excessive amounts of fertilizer in the bed.
Because P movement in most soils is minimal, it should be placed in the root zone. Banding is generally considered to provide more efficient utilization of P by plants than broadcasting, especially on the high phosphorus-fixing calcareous soils. Where only small amounts of fertilizer P are to be used, it is best to band. However, in most other situations, research has shown that broadcasting and thorough incorporation in the bed area before planting is satisfactory. If broadcasting P, a small additional amount of soluble starter P near the seed or transplant may improve early growth, especially in cool soils. For wide-row crops, such as watermelons, the modified broadcast method provides more efficient use of fertilizer than complete broadcasting.
Micronutrients can be broadcast with the P and incorporated in the bed area. On soils with high pH, micronutrients, such as Fe, Mn, and B, can be banded or applied foliarly.
Since N, and to a lesser extent, K, are mobile in our sandy soils, these nutrients must be managed properly, along with irrigation, to maximize crop uptake. Plastic mulch helps retain these nutrients in the soil against leaching by heavy rainfall. With non-mulched systems, split applications of these nutrients must be used to reduce losses to leaching. Here, up to one-half of the N and K may be applied to the soil at planting or shortly after that time. The remaining fertilizer is applied in one or more applications during the early part of the growing season. Splitting the fertilizer applications also will help reduce the potential for soluble salt damage to the plants. With many vegetable crops, drip irrigation can be used to apply fertilizers (fertigation), which provides an excellent tool for splitting the application of nutrients through the growing season and placing the nutrients closely to the root zone.
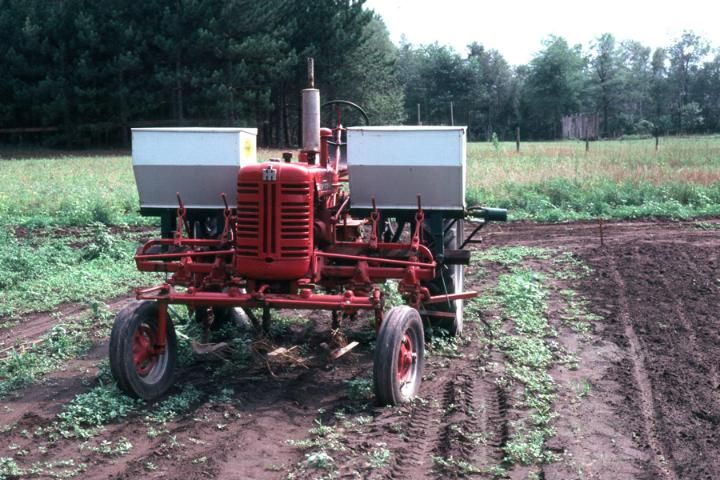
Supplemental applications. The use of supplemental fertilizer depends mainly on the amount of rainfall and the length of the season. The need for supplemental fertilizer will be minimized when the soil-test-predicted fertilizer requirements are properly managed to reduce losses to leaching. In most cases, N and K are of most concern because of leaching, although side dressing of P might be needed on the phosphate-fixing calcareous soils especially during cool periods. If required, supplemental applications of N and K should be made as a band or swath just ahead of the advancing root system (Figure 7). Place the fertilizer deep enough in the soil to be in contact with moisture. In many unmulched cases, liquid fertilizers are easiest to use and can be easily knifed into the soil. Side dress applications must only be made when there is no danger of shoot or root damage from the fertilizer application machinery. With polyethylene mulch, supplemental fertilizer can be added with a liquid fertilizer injection wheel or the drip irrigation system.
Credit: undefined
If the fertilizer component of the CNR is properly managed to minimize fertilizer losses, it is unlikely that supplemental fertilizer will be needed. Supplemental fertilizer might be needed after a leaching rainfall. The "leaching rain rule" should be used to aid in decisions concerning supplemental fertilizations. If rainfall exceeds 3 inches in 3 days or 4 inches in 7 days, apply 30 lbs N/A and 20 lbs K2O/A. The number of supplemental applications will vary according to the number of leaching rainfalls and the length of the crop growing season. A supplemental application may not be needed during the harvest season even though there was a leaching rain event. The crop may not have enough time to respond to any added fertilizer.
Fertilizer management BMPs allow for the use of supplemental applications of nutrients given three situations: when a leaching rainfall occurs; when a tissue or petiole sap test indicates a need for additional fertilizer; or when the harvesting season will be extended due to a continued favorable market. In any of these situations, the grower might end up applying more than the target CNR for the season, and this action would still be within the scope of a BMP.
Fertilizer placement (mulched crops). When using plastic mulch, fertilizer placement depends on the type of irrigation system (subsurface or overhead sprinklers) and on whether drip tubing or the liquid fertilizer injection wheel is to be used (Figure 8).
Credit: undefined
With sprinkler irrigation all fertilizer can be incorporated in the bed before mulch application. However, when high amounts of fertilizer are required, such as on previously uncropped soil, a portion of the fertilizer can be banded to reduce salt damage. This approach also can be used where large amounts of preplant fertilizer are placed under the mulch of narrow beds, a situation leading to high soluble salt concentrations in the soil. Fertilizer should not be banded directly below seed or plant position.
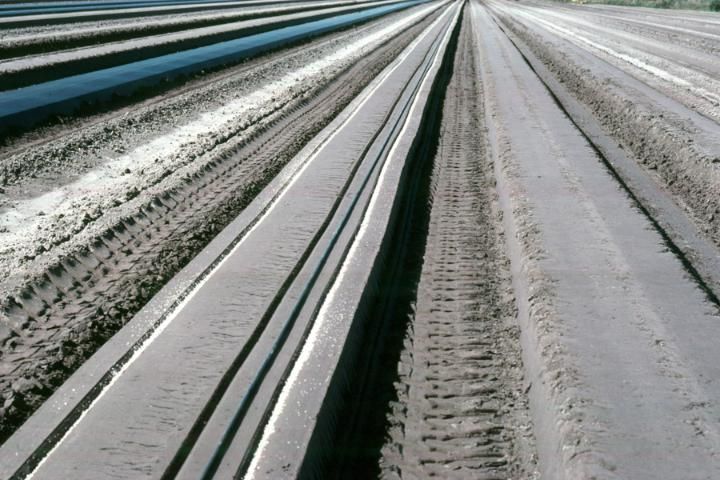
With subsurface irrigation, all P and micronutrients should be incorporated in the bed. Apply 10 to 20 percent of the N and K with the P. The remaining N and K should be placed in narrow bands on the bed shoulders, the number of which depends on the crop and number of rows per bed (Figure 9). These bands should be placed in shallow (2 to 3 inch deep) grooves. This placement requires that adequate bed moisture be maintained so that capillarity is not broken. Otherwise, fertilizer will not move from the band to the root zone.
Credit: undefined
Excess soil moisture can result in fertilizer leaching. Fertilizer and water management programs are linked. Maximum fertilizer efficiency is achieved only with close attention to water management. With either mulch production system described above, fertilizing with drip irrigation or with a liquid fertilizer injection wheel might be suitable alternatives to the placement of all N and K in or on the bed before mulching.
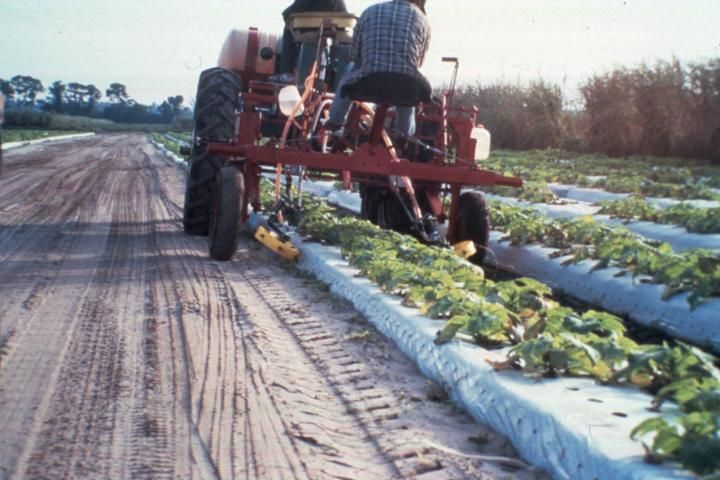
In cases where supplemental sidedressing of mulched crops is needed, applications of liquid fertilizer can be made through the mulch with a liquid fertilizer injection wheel. This implement is mounted on a tool bar and, using 30 to 40 psi, injects fertilizer through a hole pierced in the mulch. A liquid fertilizer injection wheel can be used to split-apply the seasonal N and K crop requirements and can be used to fertilize beds for double-cropping.
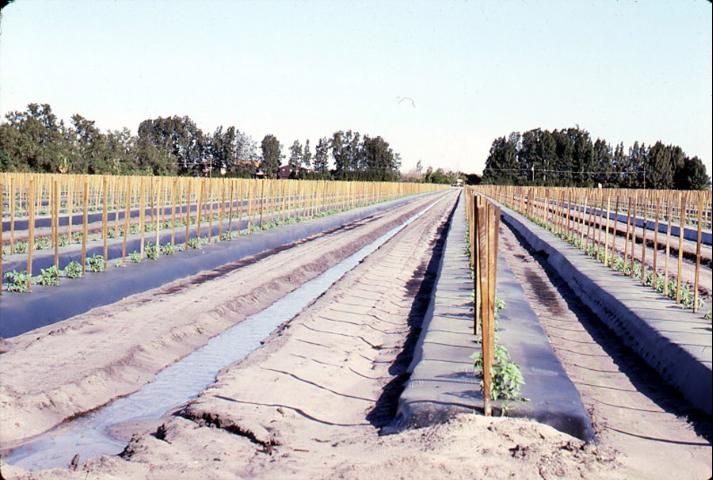
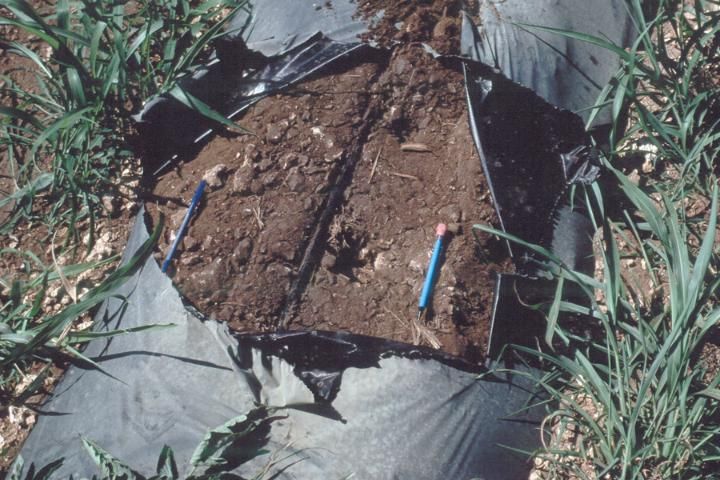
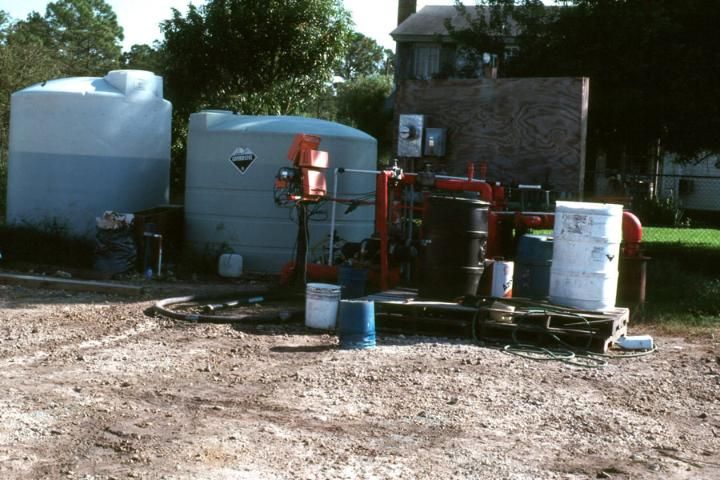
Fertigation. The combination of mulch and drip irrigation often provides an excellent yield-boosting system. The drip irrigation method results in substantial water savings and can be used to supply fertilizer (Figures 10 and 11). When fertilizing through the drip, all P and micronutrients and 20 to 40 percent of N and K should be applied preplant. Use the lower rate where sub-irrigation will be used to provide a portion of the irrigation water at the beginning of the season. Apply the remaining N and K through the drip system in increments corresponding to the growth of the crop.
Credit: undefined
Credit: undefined
When some N and K is applied preplant in a fertigation program, then fertilizer injections do not need to begin immediately after planting. Instead, injections can begin two or three weeks after planting. Injection rates usually begin with 0.5 to 1.0 lb of N or K2O per acre per day, and then are increased to 2.0 to 2.5 lb per acre per day. Rarely will more than 2.5 or 3.0 lb of N or K2O per acre per day be needed by any vegetable crop. If so, then it is likely that some of the fertilizer is being leached by excessive irrigation and the irrigation management program should be reviewed.
Even though injecting N and K in variable amounts during the season, according to the growth curve, might be the most efficient approach, there are situations where the injection program can be simplified. For example, on finer-textured soils or where the irrigation management is excellent (no leaching), then the seasonal amount of N and K2O can be applied in equal amounts rather than changing the rate of injection as the crop grows.
Fertilizer can be injected in daily or weekly amounts. The frequency depends mostly on the level of control exercised by irrigation management. If there is little chance of leaching, then seven days’ worth of fertilizer can be injected in a single weekly application. With computer control of the fertigation system, more frequent injections might also be practical.
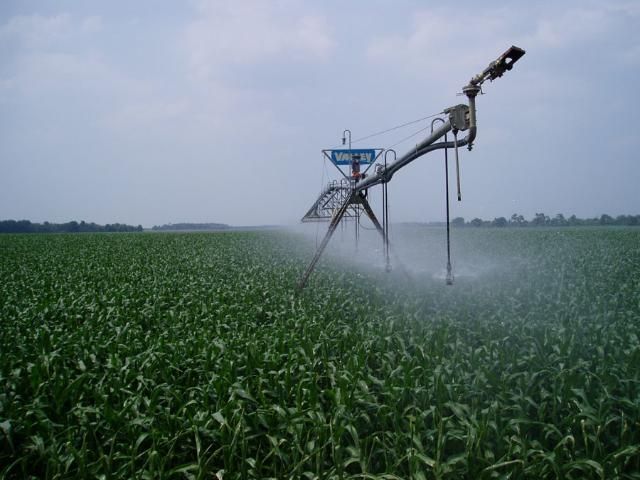
Supplying fertilizer through overhead irrigation systems, such as a center-pivot, may provide an economical method of fertilizer application and increase the efficiency of the irrigation system. Fertigation is most applicable to sandy soils that require small, but frequent water applications. In general, fertigation through sprinkler systems is most useful on un-mulched crops with close row spacing, such as leafy greens, beans, potato, or corn, rather than on crops such as watermelons. Fertigation should only be done after the crop has developed far enough to ensure the root system has advanced into the inter-row area to intercept nutrients. Fertilizer application of N or K should coincide with the growth rate of the crop, which is especially true for crops on very sandy soils since any extra fertilizer in the root zone could be leached. For soils with more clay content, fertilization can be practiced with one or only a few split applications.
Water Management, the 5th R
Fertilizer- and water-management programs are linked; optimal management of one program requires proper management of the other. The ideal outcome should be visualized as keeping both water and nutrients in the plant root zone. Efficient fertilizer management cannot result without efficient irrigation practices.
Overhead irrigation generally causes the downward movement of nutrients such as N and K. Small amounts of irrigation water applied on a regular basis will result in less leaching than will large amounts applied infrequently. Excessive irrigation can even remove fertilizer from plastic-mulched beds, especially from the soil near the plant hole or where the water table rises, leaching nutrients from the bed.
The water table in a subsurface (seep) irrigation system should be maintained at an appropriate level for a given soil situation, usually 18 (at planting) to 24 (near harvest) inches below the top of the bed. The water table should not be allowed to fluctuate appreciably because nutrients can be lost from the bed during moisture fluctuations. Water tables during heavy rains should be controlled to avoid leaching of nutrients from flooded beds.
Drip irrigation provides an efficient method for applying water and nutrients, especially if used in conjunction with mulch. Water savings of more than 50% compared to either subsurface or overhead irrigation methods have been reported. However, nutrient leaching can be severe with an improperly managed drip system. The calculation of irrigation water quantities by evapotranspiration and the use of tensiometers, water table observation wells, and other water sensors as irrigation scheduling aids can help growers improve water management.
Liquid vs. Dry Fertilizer Sources
Research in Florida has shown that there is no difference in crop response to similar amounts of nutrients when applied in either liquid or dry form. Side dress applications of fertilizer can be effectively made with dry or liquid forms of nutrients. Certain situations (use of drip irrigation or some injection wheels) require clear solutions.
The decision to use liquid or dry fertilizer sources should depend largely on economics and on the type of application equipment available. The cost per unit of nutrient (e.g., dollars per ton of actual nutrient) should be used in any decision-making process.
Starter fertilizer. A true starter fertilizer is a soluble fertilizer, generally high in P, used to help establish young seedlings and transplants. Starter fertilizers generally work best if a small amount of N is present along with the P. Starters represent a small percentage of the overall fertilizer amount but are important in establishing crops in cool, damp soils. Starter fertilizer can be applied with the planter at 2 inches to the side of the seed and 2 inches deep, or can be dissolved in the transplant water and applied in the furrow with the transplant. Typical starter solution application rates fall in the range of 10 to 15 lb/acre of each N and P2O5 for vegetable transplants and 20 to 25 lbs per acre for seeded vegetables or potato.
Foliar applications. In general, foliar applications of N, P, or K have not been shown to be effective where a good soil fertility program is followed. It is difficult to place enough of these nutrients on the leaves, especially early in the growth cycle, to be of benefit. Foliar applications of micronutrients can be effective in correcting micronutrient deficiencies (Table 5). Nutrients such as Ca and B, which are immobile in the plant, should be applied in small amounts at high frequency rather than in one application for correcting temporary deficiencies in some leafy vegetables. Foliar applications of Ca and B to correct a fruit disorder such as blossom-end rot of tomato or pepper (Hochmuth and Hochmuth 2009, https://edis.ifas.ufl.edu/ss497) are likely to fail because Ca and B do not translocate from leaves to fruit.
Nutrient deficiency symptoms. Nutrient deficiency symptoms are sometimes difficult to identify (Table 6). Usually, a tissue analysis will help identify the cause. Methods for whole-leaf collection and sufficiency ranges for leaf nutrient concentrations are presented in Plant Tissue Analysis and Interpretation for Vegetable Crops in Florida, https://edis.ifas.ufl.edu/publication/EP081. Collect most recently matured leaves, wipe clean of dirt with a damp cloth, dry, and send to the tissue-testing laboratory. When sampling, be sure to include a tissue sample from normal looking plants. Soil samples from around both normal and abnormal plants might help diagnose the problem. A quick in-field technique for determining plant N and K status is petiole sap testing for nitrate-N and K. Methods and sufficiency ranges for sap testing are presented in Plant Petiole Sap-testing for Vegetable Crops, (https://edis.ifas.ufl.edu/CV004).
Double-Cropping
Successive cropping of existing mulched beds is a good practice to make effective use of the polyethylene mulch and fumigant. Double-cropping also can make use of residual fertilizer in the beds. If N applications and amounts were properly managed for the first crop, there should be negligible amounts of fertilizer N remaining in the beds. It is not a good practice to add extra fertilizer N to the soil when planting the first crop, thinking that this fertilizer will aid growth of the second crop. The extra fertilizer could contribute to soluble-salt damage to the first crop and might be leached from the root zone before the second crop is established.
If double-cropping is planned, then a drip irrigation system could be used to supply adequate nutrition to each crop. Soil testing of a sample taken from the bed away from any fertilizer bands will help determine P or micronutrient needs, assuming that these nutrients were broadcast in the bed before planting the first crop. Phosphorus and micronutrient fertilizers (if any) added for the first crop will likely remain adequate for the second crop. If N for the first crop was not applied in excess of the CNR, then the second crop should receive an amount of N equal to its own CNR.
Potassium requirements of the second crop can be determined by soil testing where the K for the first crop was incorporated in the bed. Potassium requirements for the second crop are more difficult to determine where K for the first crop was banded. Soluble-salt measurements of the band area are difficult to interpret because the salt reading measures everything at the same time including nutrients and other salts. More accurately, K fertilization should be managed like N. If soil-test-predicted amounts of K were used for the first crop, there should be little residual K. At most, the second crop should receive an amount of K equal to that crop's CNR for K.
Once the crop fertilizer requirements have been determined, the needed nutrition may be applied through the drip system. Where drip irrigation is not being used, a liquid-injection wheel can be used to place fertilizer in the bed for the second crop.
References
Hochmuth, G. 2009. Plant Petiole Sap-Testing For Vegetable Crops. CIR 1144. Gainesville: University of Florida Institute of Food and Agricultural Sciences. https://edis.ifas.ufl.edu/CV004
Hochmuth, G. and E. Hanlon. 2020. A summary of N, P, and K research with eggplant in Florida. Fla. Fact Sheet HS-751. Gainesville: University of Florida Institute of Food and Agricultural Sciences. https://edis.ifas.ufl.edu/CV228
Hochmuth, G. and E. Hanlon. 2020. A summary of N, P, and K research with cucumber in Florida. Fact Sheet HS-749. Gainesville: University of Florida Institute of Food and Agricultural Sciences. https://edis.ifas.ufl.edu/CV226
Hochmuth, G. and E. Hanlon. 2020. A summary of N, P, and K research with muskmelon in Florida. Fact Sheet HS-754. Gainesville: University of Florida Institute of Food and Agricultural Sciences. https://edis.ifas.ufl.edu/CV231
Hochmuth, G. and E. Hanlon. 2020. A summary of N, P, and K research with pepper in Florida. Fact Sheet HS-753. Gainesville: University of Florida Institute of Food and Agricultural Sciences. https://edis.ifas.ufl.edu/CV230
Hochmuth, G. and E. Hanlon. 2020. A summary of N, P, and K research with potato in Florida. Fact Sheet HS-756. Gainesville: University of Florida Institute of Food and Agricultural Sciences. https://edis.ifas.ufl.edu/CV233
Hochmuth, G. and E. Hanlon. 2020. A summary of N, P, and K research with snapbean in Florida. Fact Sheet HS-756. Gainesville: University of Florida Institute of Food and Agricultural Sciences. https://edis.ifas.ufl.edu/CV234
Hochmuth, G. and E. Hanlon. 2020. A summary of N, P, and K research with squash in Florida. Fact Sheet HS-750. Gainesville: University of Florida Institute of Food and Agricultural Sciences. https://edis.ifas.ufl.edu/CV227
Hochmuth, G. and E. Hanlon. 2020. A summary of N, P, and K research with strawberry in Florida. Fact Sheet HS-752. Gainesville: University of Florida Institute of Food and Agricultural Sciences. https://edis.ifas.ufl.edu/CV229
Hochmuth, G. and E. Hanlon. 2020. A summary of N, P, and K research with sweet corn in Florida. Fact Sheet HS-758. Gainesville: University of Florida Institute of Food and Agricultural Sciences. https://edis.ifas.ufl.edu/CV235
Hochmuth, G. and E. Hanlon. 2020. A summary of N, P, and K research with a tomato in Florida. Fact Sheet HS-759. Gainesville: University of Florida Institute of Food and Agricultural Sciences. https://edis.ifas.ufl.edu/CV236
Hochmuth, G. and E. Hanlon. 2020. A summary of N, P, and K research with watermelon in Florida. Fact Sheet HS-755. Gainesville: University of Florida Institute of Food and Agricultural Sciences. https://edis.ifas.ufl.edu/CV232
Hochmuth, G. J., and E. A. Hanlon. 2019. Principles of Sound Fertilizer Recommendations. SL 315. Gainesville: University of Florida Institute of Food and Agricultural Sciences. https://edis.ifas.ufl.edu/ss527
Hochmuth, G., and E. Hanlon. 2018. Calculating Recommended Fertilizer Rates for Vegetables Grown in Raised-Bed, Mulched Cultural Systems. Circ. SL 503. Gainesville: University of Florida Institute of Food and Agricultural Sciences. https://edis.ifas.ufl.edu/SS516
Hochmuth, G. J., and R. C. Hochmuth. 2021. Blossom-End Rot in Bell Pepper: Causes and Prevention. SL 284. Gainesville: University of Florida Institute of Food and Agricultural Sciences. https://edis.ifas.ufl.edu/SS497
Hochmuth, G., D. Maynard, C. Vavrina, E. Hanlon, and E. Simonne. 2022. Plant Tissue Analysis and Interpretation for Vegetable Crops in Florida. HS 964. Gainesville: University of Florida Institute of Food and Agricultural Sciences. https://edis.ifas.ufl.edu/EP081
Maynard, D., and G. Hochmuth. 2006. Knott's handbook for vegetable growers, 5th ed. New York: John Wiley & Sons.
Table 1. A general guideline to crop tolerance of mineral soil acidity.1
Table 2. Liming materials.
Table 3. Some commonly used fertilizer sources.
Table 4. Average nutrient content of selected organic materials.
Table 5. Recommendations for foliar applications of plant nutrients.
Table 6. Fertilizer nutrients required by plants and deficiency symptoms.