In the horticulture industry, age has frequently been used to divide and quantify gardeners (National Gardening Association 2013). For instance, consumers over the age of 55 account for the majority of US household lawn and garden retail sales, and the number of gardeners in this group is increasing (National Gardening Association 2013). Interestingly, young consumers are also expressing interest in gardening. In 2012, Millennials (born after 1980) spent 78% more on gardening purchases than in the previous 2 years. Surprisingly, men are the driving force in this age group (with a 125% increase) who spent approximately $441 per household (in 2012) with most of the expenditures being on food producing/edible plants (i.e., fruit trees, berries, vegetables, and herbs). The local and "grow your own food" movements are likely the main drivers of increased interest in edible and food producing plants (National Gardening Association 2013). To date, research addressing retail promotions in the green industry by age segments has not been adequately addressed.
Once differences and similarities by age group are identified, promotions can be designed to attract those groups. Target marketing is a promotional strategy where consumers are segmented into homogenous groups with common needs that respond similarly to marketing stimuli (Belch and Belch 2009). Advantages of target marketing include streamlining promotional efforts, better market penetration, improved promotion efficiency, and stronger brand recognition. Many consumer characteristics can be used to create segments with one of the primary factors being demographic characteristics (Belch and Belch 2009). Specifically in the horticulture industry, young consumers have been of interest due to their increased spending power, low market penetration (in the horticulture industry), and potential to rejuvenate the industry (Rihn et al. 2011). For instance, in 2015 Millennials' annual spending exceeded $600 billion and is projected to rise to $1.4 trillion in 2020 (Donnelly and Scaff 2019). Consequently, identifying how different age groups respond to in-store marketing efforts could aid in capturing additional market share and ultimately improve green industry performance and profitability.
In this report, results from a study investigating in-store signage and plant tag information are shared. Specifically, similarities and differences between younger and older consumers and their visual attention to point-of-sale (POS) information is explored. Results provide a deeper understanding of how end consumers use POS information while determining their purchases in the retail center. Overall, this EDIS publication is intended to aid green industry growers, marketing intermediaries, and retailers as they design their in-store marketing materials.
Methods
Data was collected at a research station in central Florida in 2014 using two studies with similar products and attributes displayed either as above-plant signs or on plant tags (Table 1). Computer images were used to show respondents the products they were evaluating. In the images, Study 1 utilized above-plant signs (Figure 1) while Study 2 used plant tags to communicate important product attributes (Figure 2). For both studies, respondents were asked to "Please rate your likelihood of purchasing the pictured plant" using a 7-point Likert scale (1=very unlikely; 7=very likely). While evaluating the product images and rating their purchase likelihood, respondents' eye movements were recorded using a Tobii X1 Light Eye Tracker. Specifically, the number of fixations (when the eye pauses and focuses on the stimuli) were recorded to measure level of interest and how visual attention impacted their behavior (Khachatryan and Rihn 2014). Respondents also completed a brief questionnaire which included demographic questions. For analysis, the sample was divided by age with a "younger" group consisting of participants that were less than 35 years old (consistent with Gen Y or younger) and an "older" group that included participants that were 36 years old or older. Thus, age was used to segment the participants.
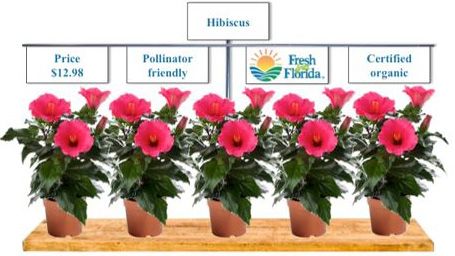
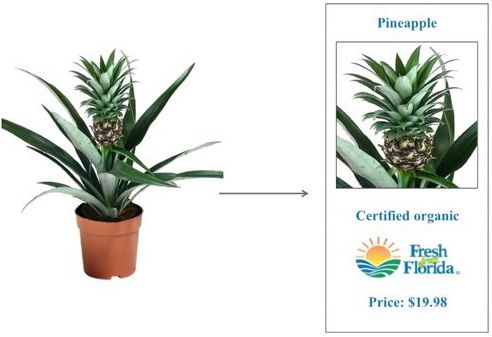
Participants were recruited using fliers and social media advertisements in the Orlando area. They had to have purchased plants within the past 12 months to participate. Summary socio-demographic variables are presented in Table 2. Briefly, in Study 1, 104 people participated, with an average age of 53 years old; 20% were in the younger group, while 80% were in the older group. Study 2 consisted of 87 people with 29% being in the younger group and 71% in the older group. Regardless of the study, differences were observed between the age groups in all of the demographic categories. In general, the younger group consisted of a higher percentage of males who had lower incomes, larger household sizes, and lower levels of education. Given the small, localized sample, this research serves as a good case study for central Florida plant consumers.
Visual Attention to Point-of-Sale Information
Study 1—Above-Plant Signs
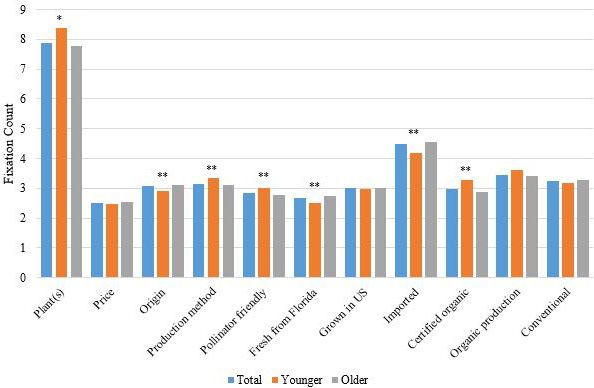
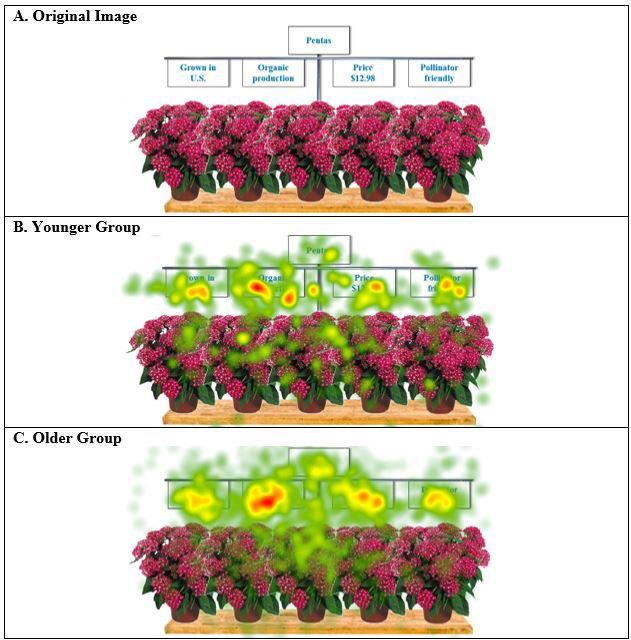
Respondents' average number of fixations on the plants and above-plant signs are presented in Figure 3. Overall, the plant images captured the greatest amount of visual attention (7.9 fixations), followed by the production method signs (3.2 fixations), origin signs (3.1 fixations), pollinator-friendly signs (2.8 fixations), and then the price signs (2.5 fixations). Regarding age group differences, younger consumers viewed the plants, production methods, and pollinator-friendly signs more than the older consumers. However, this was not consistent across all attribute levels. For the Fresh from Florida and imported signs, older consumers fixated more than the younger consumers while younger consumers fixated on the certified-organic sign more than older consumers. There were no significant differences between the groups when viewing price, domestically grown, organic production, and conventional production signs, indicating similar fixation patterns. An example of a cumulative graphic representation of respondents' visual attention to the above-plant signs is presented in Figure 4.
Study 2—Plant Tag
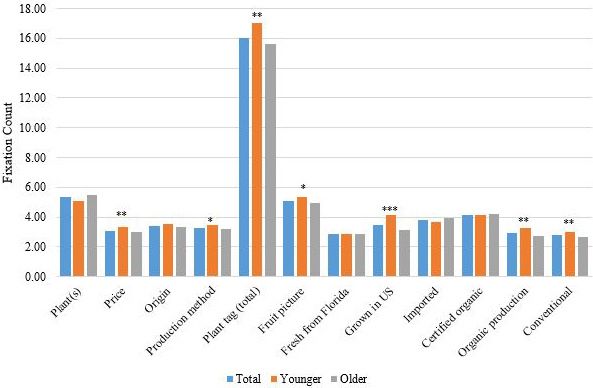
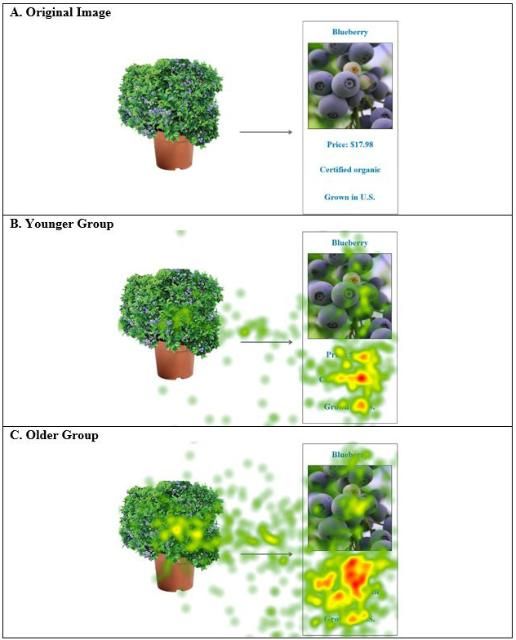
Respondents' average number of fixations on the plants and their tags are presented in Figure 5. Overall, the total plant tag captured the most attention (16.0 fixations), followed by the plant images (5.4 fixations), fruit picture (5.1 fixations), origin information (3.4 fixations), production method information (3.3 fixations), and price (3.1 fixations). Within the origin and production method categories, respondents fixated on certified-organic the most (4.2 fixations), followed by imported (3.8 fixations), domestically grown (3.4 fixations), organically produced (2.9 fixations), Fresh from Florida (2.9 fixations), and conventionally grown (2.8 fixations). Generational differences did occur. Younger consumers fixated on the plant tag, fruit picture, production method, price information, domestically grown, organically produced, and conventionally produced significantly more than older consumers. Age did not influence the number of fixations on the plant images, Fresh from Florida, imported, and certified organic attributes. An example cumulative graphic representation of respondents' visual attention to information on plant tags is presented in Figure 9.
Purchase Likelihood
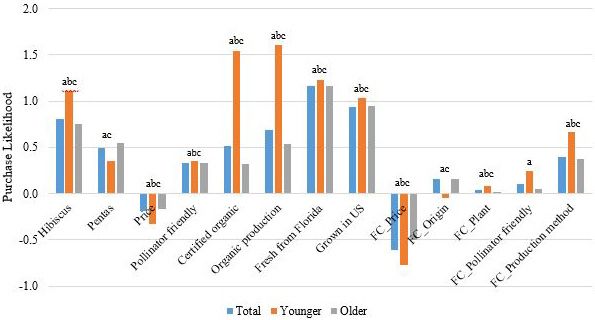
Results indicate how purchase likelihood was influenced by the presence of value-added attributes on above-plant signs and by fixations on those attributes (Study 1; Figure 7). In general, age did not significantly change consumers' preferences for the value-added attributes presented on above-plant signs. Hibiscus were preferred to petunias, and the older group preferred pentas to petunias. Price negatively influenced purchase likelihood (i.e., as price increased consumers were less likely to buy the product). The presence of a pollinator-friendly sign increased purchase likelihood for all groups when compared to not having a pollinator-friendly sign. Compared to conventionally produced plants, certified-organic and organic production signs increased purchase likelihood. Signs indicating in-state or domestic production increased purchase likelihood when compared to imported plants regardless of age group. Regarding visual attention to the above-plant signs, each additional fixation on the price sign decreased respondents' purchase likelihood regardless of age. Additional fixations on the origin signs increased purchase likelihood for the older group but not the younger group. Regardless of age, additional fixations on the plant images or production method signs increased purchase likelihood. Additional fixations on the pollinator friendly sign increased purchase likelihood for the total sample but not for the individual age groups.
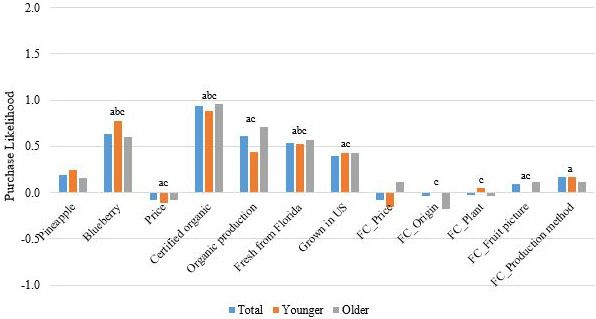
Slightly different results were observed when the value-added information was presented on plant tags (Study 2; Figure 8). Regardless of age group, blueberry plants were preferred to kiwi vines. Price negatively impacted purchase likelihood for the total sample and older age group. Compared to conventional production, certified-organic increased purchase likelihood for all groups. Organic production increased purchase likelihood for the total sample and older group when compared to conventional production. In-state production increased purchase likelihood for all groups, while "grown in the United States" increased purchase likelihood for the total sample and older group when compared to imported plants. Regarding visual attention, additional fixations on origin and the plant images decreased the older group's purchase likelihood. Conversely, additional fixations on the fruit picture increased purchase likelihood for the total sample and older group. Lastly, additional fixations on the production method information increased the purchase likelihood for the total sample.
Summary
This fact sheet summarizes a case study of central Florida plant purchasers and the relationship between value-added information presentation format (i.e., signs and plant tags), consumer age, visual attention, and purchase likelihood. Findings could be used by green industry stakeholders interested in attracting different market segments or improving consumers' value of their products. Key findings include:
- Consumers prefer plants that have value-added promotions regardless of age with a strong preference for organic products and plants from geographically close origins.
- Regardless of promotion type, younger consumers visually attend to sustainable value-added information such as production methods and pollinator friendliness. Sustainable signage is of particular interest to this group and could be an important component of a targeted marketing strategy.
- Signs that emphasize in-state or domestic plant origins could be used to attract both younger and older consumers.
- Plant tags that promote organic production (regardless of certification status) attract visual attention for all age groups.
- Above-plant signs appear to positively impact purchase likelihood with additional fixations on those signs further increasing purchase likelihood. Signage is likely easier for consumers to visually skim, understand, process, and utilize while in the retail setting. Conversely, plant tags require consumers to actively seek additional information.
- Signage is a great way to attract consumer attention and draw consumers in to further examine the product. Plant tags can further emphasize the value-added attributes or serve as a reminder post-purchase.
- Price signs and tags should be available but not prominently displayed since price decreases purchase likelihood and visual attention to the price on the above-plant signs decreases purchase likelihood.
The results have interesting implications for Florida growers interested in targeting consumers based on age; however, some caution should be used when extrapolating them to the population at large because of the case study nature of the data (i.e., a local, small sample). Furthermore, two broad types of plant categories were used (ornamentals, fruit-producing). Thus, product category may impact respondents' visual attention to attributes and the influence of those attributes on subsequent purchasing behavior.
References
Belch, G. E., and M. A. Belch. 2009. Advertising and Promotion: An Integrated Marketing Communications Perspective. 8th Ed. McGraw-Hill/Irwin, New York, NY.
Donnelly, C., and R. Scaff. 2019. "Who are the millennial shoppers? And what do they really want?" Accenture. Accessed 12 April 2023, available [online] at https://www.avanade.com/-/media/asset/point-of-view/who-are-millennial-shoppers.pdf
Khachatryan, H., and A. Rihn. 2014. Eye-tracking methodology and applications in consumer research. FE947. Gainesville: University of Florida Institute of Food and Agricultural Sciences. Accessed 7 May 2019, available [online] at https://edis.ifas.ufl.edu/fe947
National Gardening Association. 2013. "The National Gardening Association's comprehensive study of consumer gardening practices, trends, and product sales." National Gardening Association Inc., Williston, VT.
Rihn, A. L., C. Yue, B. Behe, and C. Hall. 2011. "Generations X and Y attitudes toward fresh flowers as gifts: Implications for the floral industry." HortScience 46(5): 736–743.