Introduction and Project Overview
Urban sprawl has underscored the need for green spaces in densely populated areas. From 2000 to 2010, US urban areas increased 12.1% to cover 3% of the US landmass (US Census Bureau 2015) and 80% of the total US population lives in urban areas (Nowak et al. 2010). Multiple studies have demonstrated that landscapes and other green areas (e.g., parks, etc.) improve quality of life and provide many economic, health, and environmental benefits to homeowners and other community members (Hall and Dickson 2011; Hall and Knuth 2019a; Hall and Knuth 2019b). Sustainable residential landscapes are one means of providing these benefits but with reduced inputs (e.g., fertilizer, irrigation, pest controls, labor requirements, etc.). Reduced landscape inputs are desirable from an economic and environmental standpoint in that they cost less to maintain and reduce the likelihood of pollution (e.g., water pollution due to excess fertilizer run-off or leaching; Suh et al. 2017). Furthermore, research suggests that homeowners are interested in plants that require less inputs (Yue, Hugie, and Watkins 2012), indicating there may be demand for landscapes offering similar options. Prior to offering these options, it is important to understand the current marketplace. This report summarizes residential landscape-specific data to provide a snapshot of Floridian homeowners' landscapes.
This report is the first in a series from the Sustainable Residential Landscape Project. The Sustainable Residential Landscape Project was a study conducted in 2016 with the express purpose of addressing Floridians' perceptions of landscapes, different factors that could influence their adoption of more sustainable landscape options, and means of promoting more sustainable landscaping options. The Sustainable Residential Landscape Project was funded by the University of Florida's Center for Landscape Conservation and Ecology (CLCE). Specific project objectives included:
Project Objectives:
- Assess homeowners' current landscapes and their perceptions of the maintenance requirements of their landscapes;
- Determine homeowners' perceptions of Florida-Friendly LandscapesTM and how those might influence their behavior;
- Assess homeowners' perceived value added from landscapes and the impact of financial incentives on homeowners' installation/purchase likelihood of alternative landscapes.
To address the project objectives, an online survey was administered to 610 Florida homeowners in 2016. Only people who live in a single-family house with an irrigated landscape were asked to participate. The survey consisted of several sections that contained questions related to the project objectives. Upon completion of the survey, respondents were given online reward points as an incentive.
Data from the study were summarized in a series of reports to provide green-industry stakeholders a "snapshot" of their market. This report focuses on objective 1: assess homeowners' current landscapes and their perceptions of the maintenance requirements of their landscapes. The results are of particular interest to the landscape industry, Extension agents, and other individuals interested in aiding homeowners in managing their residential landscapes.
Who participated in the study?
- Sample size: 610 participants
- Average age: 51 years old
- Gender: 59% females
- Education: 51% had a 4-year college degree or higher
- 2015 household income:
- 20% had an income less than $40,000
- 54% had an income between $40,000–$99,999
- 26% had an income greater than $99,999
- Household size: 65% of households consisted of 2 adults
- Children in household: 68% had 0 children living in their homes
- Landscape maintenance responsibilities:
- 60% maintained their own landscapes
- 40% hired landscaping companies
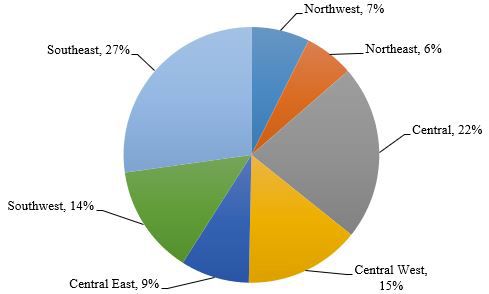
- Geographical location: All participants live in Florida but in different regions (Figure 1)
Results
Landscape Design Overview
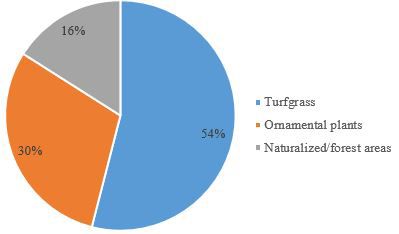
Participants indicated that the majority of their landscapes (54% of the properties' landscapes) were composed of turfgrass, followed by ornamental plants (30%) and naturalized or forested areas (16%; Figure 2).
Interestingly, 43% of participants indicated that their landscape was designed by themselves, a friend, or other family member (Figure 3). Approximately 32% of the sample stated they did not know who designed the landscape, while 25% hired professionals to design their homes' landscapes.
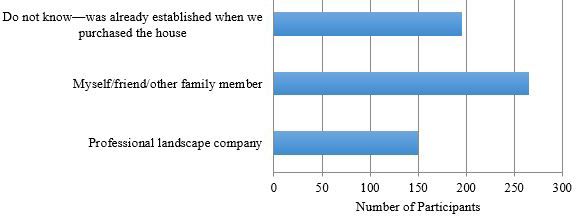
Credit: Designer of the Home's Current Landscape
The majority of participants (56%) indicated they had installed or renovated their landscapes within the past 5 years (Figure 4). While 17% stated they never installed or renovated their landscapes, 11% changed their landscapes within the past 5 to 10 years, 6% changed their landscapes more than 10 years ago, 1% indicated "other," and 9% stated they continually change their landscapes.
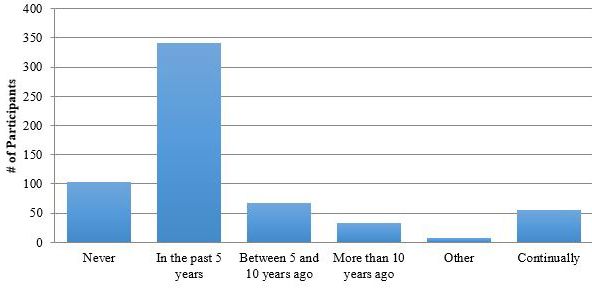
Credit: The Last Time Landscape Installation/Renovation Occurred at the Current Residence
Regarding the cost of their latest landscape renovation, most renovations cost less than $5,000 with an average cost of $3,251.28 (Figure 5). Specifically, nearly 21% stated they paid between $1,001 and $2,000, 20% paid between $2,001 and $5,000, and 40% paid less than $1,000 for their landscape renovations. Two individuals (0.4% of the sample) stated they paid over $30,000 but clarified that they had actually built new homes with landscapes included in the total cost.
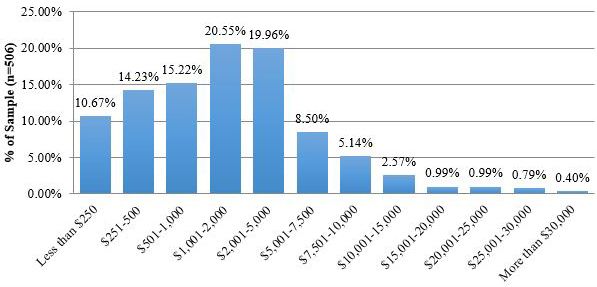
Credit: Approximate Cost of the Most Recent Landscape Renovation
Participant Knowledge and Maintenance Perceptions
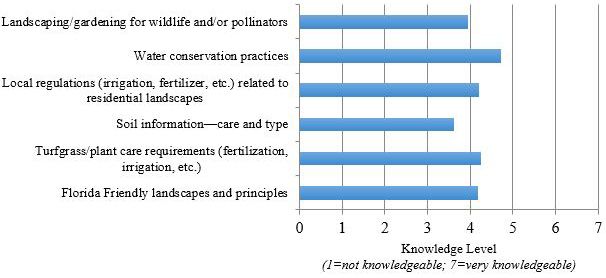
Participants self-reported their level of knowledge for a variety of topics related to landscaping (Figure 6). They reported the highest level of knowledge for water conservation practices. This finding is not surprising given Florida's emphasis on water conservation activities and irrigation restrictions in recent years. Participants also reported being slightly knowledgeable in local landscape regulations, turfgrass and plant care requirements, and Florida-Friendly LandscapingTM. They were less knowledgeable about landscaping for wildlife and pollinators and soil information.
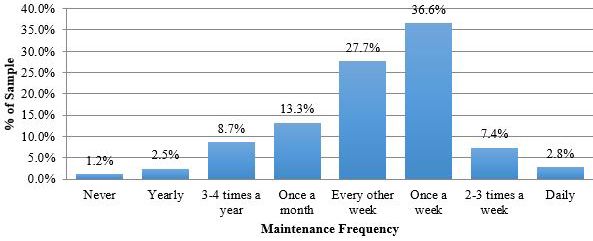
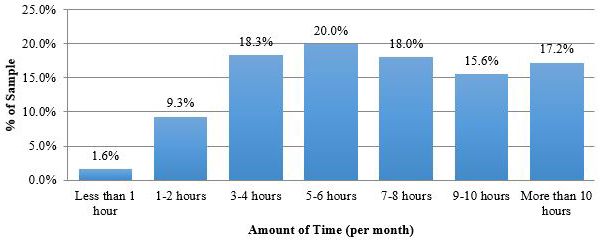
On average, participants' landscapes were maintained weekly for 37% of the sample, followed by biweekly (28%), monthly (13%), 3–4 times per year (9%), or 2–3 times per week (7%; Figure 7). Less than 3% of participants selected daily, yearly, or never. Participants indicated their landscape maintenance took around 5 to 6 hours per month (Figure 8). However, the distribution of time required for landscape maintenance primarily fell between 3 and 10 or more hours per month. Very few individuals indicated their landscapes required less than 2 hours.
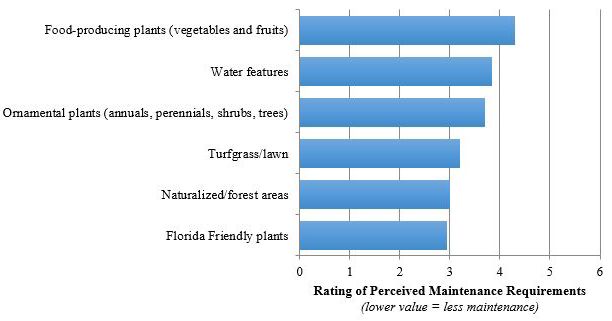
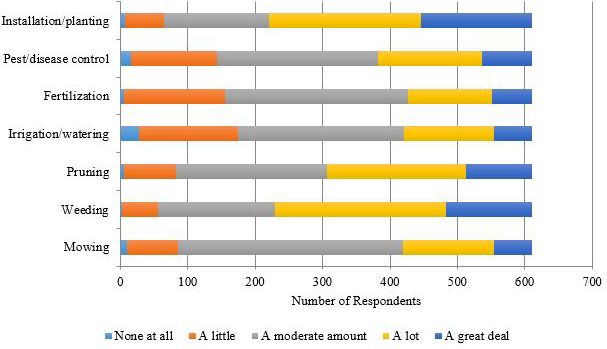
Specific landscape maintenance activities and types of plants also influenced participants' perceptions of maintenance requirements. Regarding maintenance requirements of specific landscape plants/features, Florida-Friendly plants were perceived as requiring the least maintenance, followed by naturalized/forested areas, and turfgrass/lawns (Figure 9). Landscape plants and features that were perceived as requiring the most maintenance included food-producing plants, water features, and then ornamental plants. Participants were asked to indicate how much time they believed different landscape maintenance activities required (Figure 10). Not surprisingly, highly automated (e.g., irrigation) activities and those where specialists are frequently hired (e.g., pest control, fertilization) were perceived as requiring the least amount of time. Installation and planting were perceived as requiring the most time, while maintenance activities that align with ornamental plant maintenance (pruning, weeding) appeared to require a fair amount of time as well. Mowing was in the middle between pruning and weeding and pest/disease control and fertilization.
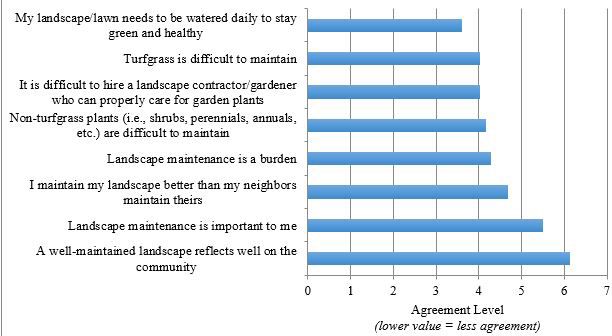
To further explore Floridian homeowners' perceptions of landscape maintenance, participants were provided a list of landscape maintenance-related statements and asked to indicate their level of agreement (1=strongly disagree; 4=neither agree nor disagree; 7=strongly agree). Participants agreed most with the statements "A well-maintained landscape reflects well on the community," "Landscape maintenance is important to me," and "I maintain my landscape better than my neighbors maintain theirs" (Figure 11). They slightly agree that "Landscape maintenance is a burden" and that "Non-turfgrass plants are difficult to maintain." They neither agree nor disagree with the statements that it is challenging to hire qualified professionals to care for their landscapes and that turfgrass is difficult to maintain. They disagreed with the statement that their landscape required daily irrigation to stay green and healthy.
Key Points
- Turfgrass covers the largest area in Florida residential landscapes.
- Floridians frequently design their own landscapes and have renovated their landscapes within the past 5–10 years for less than $5,000.
- Florida landscapes are maintained weekly or biweekly for a total of 5–6 hours per month.
- In general, landscape maintenance activities that are highly automated (e.g., irrigation) or often done by professionals (e.g., disease/pest control) are viewed as requiring less maintenance.
- Turfgrass lawns and their associated activities are perceived as requiring less maintenance than ornamental plant beds and their maintenance activities.
- Food-producing plants are perceived as requiring the most maintenance. Florida-Friendly LandscapesTM are perceived as requiring the least maintenance.
- Landscape maintenance is important to Floridians, partially due to positive community vibes.
This report provides a brief overview of Floridian homeowners' residential landscapes and perceptions related to those landscapes. Results are important to the landscape industry in that they provide insights to current landscape maintenance practices and perceptions. This knowledge can be used to identify and correct areas of misunderstandings. For instance, turfgrass lawns are perceived as requiring less maintenance; however, the use of other types of plants that fit that site can reduce maintenance requirements (as discussed by the Florida-Friendly LandscapingTM program at https://ffl.ifas.ufl.edu/). Subsequent reports will focus on homeowner perceptions of Florida-Friendly LandscapesTM (report 2) and financial incentives to encourage homeowners to adopt more sustainable landscapes (report 3).
Literature Cited
Hall, C. R., and M. W. Dickson. 2011. "Economic, environmental, and health/well-being benefits associated with green industry products and services: A review." Journal of Environmental Horticulture 29 (2): 96–103.
Hall, C. R., and M. J. Knuth. 2019a. "An update of the literature supporting the well-being benefits of plants: A review of the emotional and mental health benefits of plants." Journal of Environmental Horticulture 37 (1): 30–38.
Hall, C. R., and M. J. Knuth. 2019b. "An update of the literature supporting the well-being benefits of plants: Part 2 physiological health benefits." Journal of Environmental Horticulture 37 (2): 63–73.
Nowak, D. J., S. M. Stein, P. B. Randler, E. J. Greenfield, S. J. Comas, M. A. Carr, and R. J. Alig. 2010. "Sustaining America's urban trees and forests." United States Department of Agriculture, Forest Service, General Technical Report NRS-62.
Suh, D. H., H. Khachatryan, A. Rihn, and M. Dukes. 2017. "Relating knowledge and perceptions of sustainable water management to preferences for smart irrigation technology." Sustainability 9 (4): 1–21.
US Census Bureau. 2015. "2010 Census urban and rural classification and urban area criteria." Retrieved February 22, 2021 from https://www.census.gov/programs-surveys/geography/guidance/geo-areas/urban-rural/2010-urban-rural.html.
Yue, C., K. Hugie, and E. Watkins. 2012. "Are consumers willing to pay more for low-input turfgrasses on residential lawns? Evidence from choice experiments." Journal of Agricultural and Applied Economics: 44 (4): 549–560.