Estimating Herbage Mass on Pastures to Adjust Stocking Rate
Introduction
Grazing management strategies play an important role in determining the production and quality of a forage-based diet for animals and help improve the sustainability and feasibility of production systems. Stocking rate (SR, the number of animals grazing a unit of land over a specified time) and carrying capacity (the maximum number of animals or animal units the pasture can support over a period without deterioration of the grazing land) are two important parameters to help producers optimize the productivity of their pastures and animal performance. However, in order to calculate carrying capacity and adjust to an adequate SR, it is necessary to determine the amount of forage in the pasture and the amount of forage we can produce. The question of how much forage is available for livestock consumption can be approached in many ways. Measuring is more efficient than estimating, and it reduces the chances of overgrazing or undergrazing stands, which could compromise the longevity of the pastures and quality of feed for animals. Measuring forage production is an efficient way to monitor grazing and help producers make better decisions regarding the implementation of management strategies. This publication explains methods to measure forage mass and utilize that information to estimate an adequate stocking rate.
Estimating Forage Mass on Pastures
Herbage Mass
Herbage mass refers to the amount of forage at a particular point in time in a specific pasture. To measure herbage mass, you will need a quadrat: a tool with a set area. You can build one yourself (Box 1).
Herbage mass can be measured by direct and indirect methods (Burns et al. 1989). The direct method requires the forage in the quadrat to be cut to ground level, dried, and weighed to later determine production per area. For information on how to dry forage samples to calculate dry matter (DM) concentration, see EDIS document SS-AGR-178. This method is applicable to homogenous and smaller pastures. For the bigger pastures, numerous samples are needed to obtain a good characterization of the pasture, which can become very labor intensive.
Alternatively, the indirect method uses a measurement of pasture characteristics to be correlated with real biomass harvested in the field. This method provides good measurement when done correctly and requires fewer samples to be cut. The indirect method uses a gauge to determine biomass: a visual estimate (score or biomass value), a ruler, or a raising plate (plate meter). The plate meter offers more advantages because it accounts for height and density of the canopy, but it can be a challenge to use with stemmy species such as limpograss and pearl millet. For the method to work, the gauge must be calibrated. This means the gauge measurement must be related to the real biomass it represents in the pasture. To calibrate the gauge:
- Choose roughly ten sites with contrasting characteristics (i.e., low, medium, and high herbage biomass);
- Take a measurement with the gauge within each quadrat;
- Clip the forage within each quadrat after taking the indirect measurement.
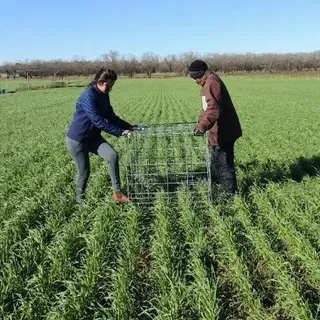
If using a ruler within the quadrat, take around four height measurements and then clip the forage. If using the plate meter, the quadrat should be the shape and size of your disk. Proceed with cutting the forage to ground level the same way (Figure 1). Those samples must then be dried and weighed to obtain dry matter of the forage, since all feeding recommendations are on a DM basis. Once dried, those sample weights will serve to generate a calibration curve correlating the gauge (visual scale, ruler, or plate meter) with the real forage mass (quadrat-harvested) in the pasture. A step-by-step procedure in Excel is shown in Box 2. This calibration curve will generate an equation, which will transform the average gauge measurement into herbage mass per acre.
Credit: Liza Garcia, UF/IFAS
The next part of this process is to randomly measure points for canopy height by walking in a random pattern and using a predefined distance, such as 50 steps. At each step, record the gauge value. These points will be used in the calibration curve to obtain forage mass values. For example, using the equation for a disk-meter evaluation in Box 2, if the reading was 7.3 inches, then the estimated total biomass for the pasture would be 2,788.5 lb dry matter/acre.
herbage mass = 449.29 x average reading - 491.28
449.29 x 7.3 - 491.28 = 2,788.5 lb DM/acre
If it is not possible to get the forage dried to calculate the DM concentration, producers can use general DM ranges for different forages. However, this method is much less accurate. General DM ranges for cool-season (small grains and ryegrass), warm-season (bahiagrass and bermudagrass), and limpograss (stockpiled) are approximately 20, 30, and 40%, respectively. These percentages can be used in the equation below to obtain an estimated forage mass per acre (Box 3).
Box 1. How to make a forage sampling quadrat.
Quadrat size and shape do not matter, but the area of the quadrat must be determined to be able to calculate the amount of forage on an acre basis. There are many materials that can be used to build a quadrat: wood, rebar, PVC pipe, or steel cable. PVC is light and easy to use, while steel cable is flexible and easy to store. For PVC pipe, wood, or rebar, four 18-in pieces work well for a square design, ensuring that the internal dimensions are 18 in. This will give a quadrat with: 18 in x 18 in = 324 in2 = 2.25 ft2 area. Given that an acre has an area of 43,560 ft2, this quadrat represents roughly 1/20,000 acre. The measurements of the quadrat are then multiplied by 19,360 to represent values per acre.
(43,560 ft2)/(quadrat area) = (43,560 ft2)/(2.25 ft2) = 19,360
If a steel cable is used, the circumference (i.e., the length of the cable you will need) can be calculated as:
Circumference= v(12.56 × desired area)
Circumference= v(12.56 × 2.25 ft2)
Circumference = 5.31 ft
Box 2. Using Excel to build your calibration curve.
In this example, measurements were collected for 18 sites throughout the pasture. In order to obtain the observed values of forage mass (see third column in the table), enter the final dry weight of the biomass collected for each site in the formula below:
lb/acre=(weight of dried sample (lb) ×43,560 sq ft)/(area of quadrat used (sq ft))=forage mass in lb DM per acre
Example: In a quadrat of 2.25 ft2 (1.5 ft by 1.5 ft), if the dry biomass weight was 0.2 lb, then the forage mass in that quadrat would be equivalent to 3,872 lb DM/acre.
Step 1: Type all values into the Excel spreadsheet.
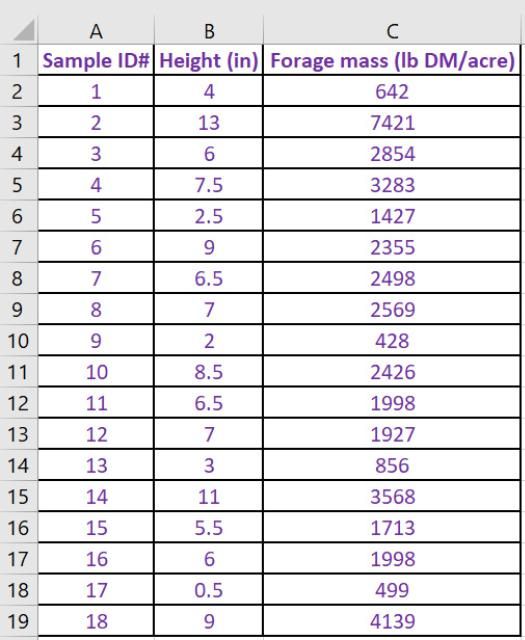
Credit: Marcelo Wallau, UF/IFAS
Step 2: Select the "Height" and the "Forage Mass" columns. Select "Insert Chart" and choose a scatter chart.
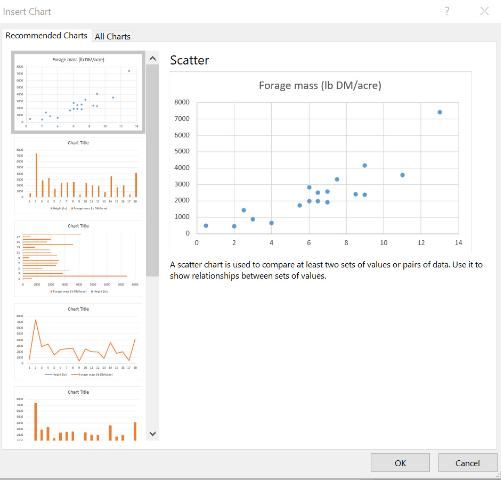
Credit: Marcelo Wallau, UF/IFAS
Step 3: Under the XX menu, choose "Add Element" and select "Trendline." Usually a linear trendline fits the data best, but they may require an exponential trendline depending on the gauge and pasture being measured.
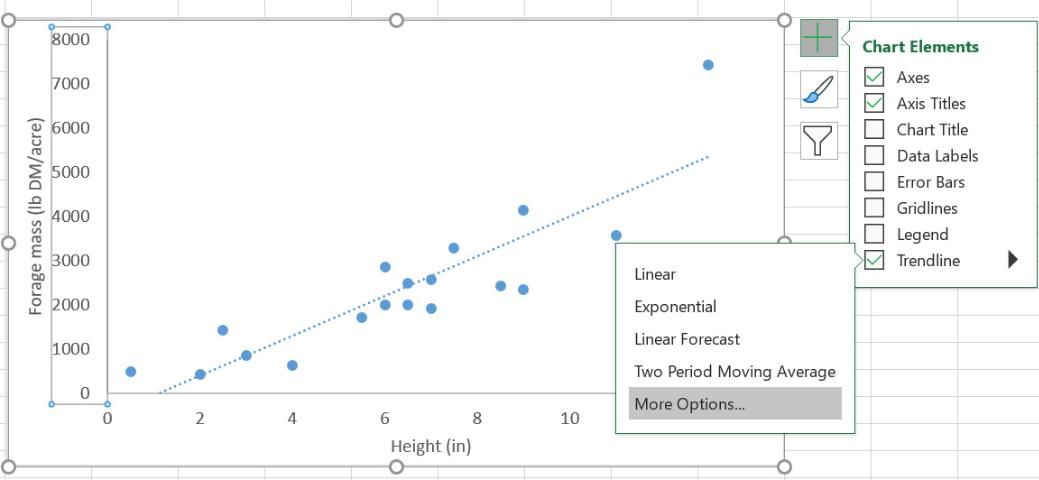
Credit: Marcelo Wallau, UF/IFAS
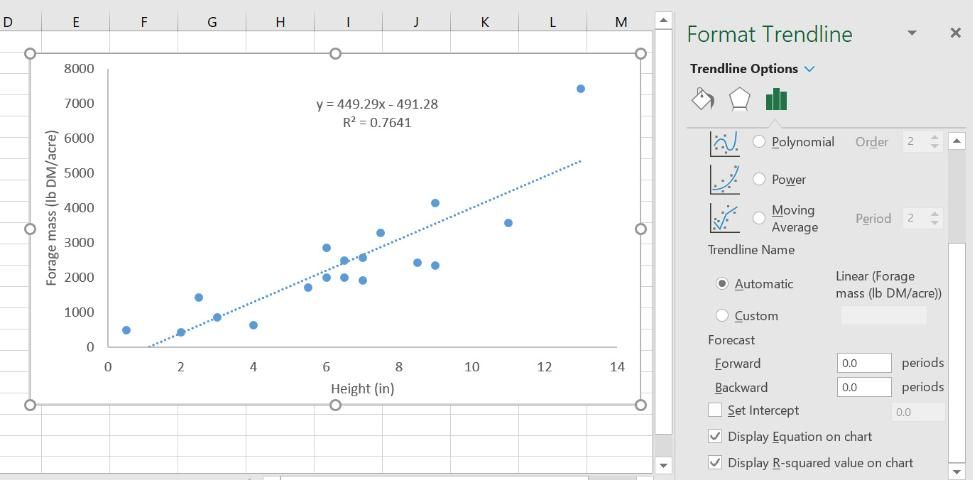
Step 4: Double-click on the trendline, go to "Format Trendline," and select "Display equation on chart" and "Display R-squared value on chart." The equation will be used to transform the gauge measurement into estimated biomass. The R-squared will be the indication of how good the equation is (a higher value is a trendline that fits the data best). Change between "Linear" and "Exponential" trendlines, for example, and choose the one that has the higher value for R-squared.
Credit: Marcelo Wallau, UF/IFAS
For this example, the equation obtained is: herbage mass = 449.29 × average reading - 491.28. The R-squared value is 0.7641.
The last step is to use the equation for calibration to convert the gauge values to estimated forage mass for the pasture. Plug in the "x" of the equation (the average value for your gauge). The resulting "y" represents the estimated dry matter per acre for your pasture.
Box 3. Using a DM species range for estimation of forage mass.
An estimated DM range for a forage species can be used to calculate the forage mass.
forage mass in lb DM per acre = (weight of wet sample (lb) × DM (%) × 43,560 sq ft) / (area of quadrat used (sq ft) × 100)
Example: Using the quadrat from the previous example with an area of 2.25 ft2, the biomass collected inside the quadrat from the field was weighed and was 0.30 lb. Using a 30% DM as the estimate for a warm-season perennial species in the formula, the result is approximately 1,800 lb dry matter/acre.
Estimating Pasture Productivity
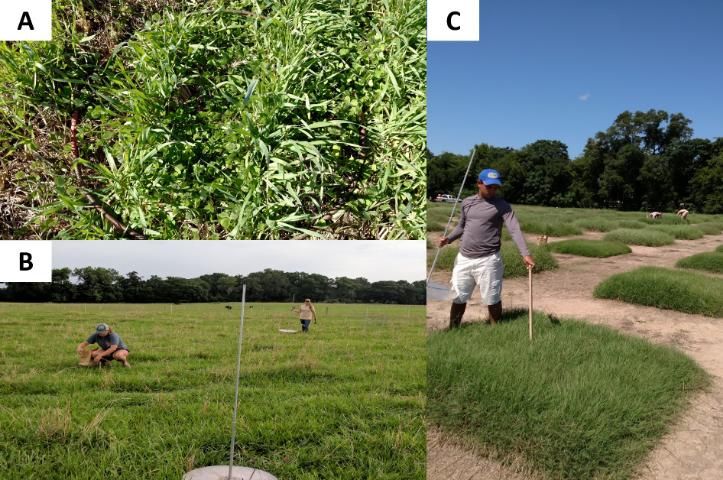
Another management tool to consider is estimating the herbage accumulation rate (lb DM/acre/day). Pasture growth changes seasonally and is normally slow at the beginning and end of the primary season of growth. This implies that the SR should be adjusted according to the seasonal growth period. Estimating herbage accumulation improves forage utilization plans. Calculating the overall production will help determine the carrying capacity and accommodate changes in pasture production throughout the season. For grazing systems managed under continuous stocking, exclusion cages are an effective tool to help monitor herbage accumulation (Figure 2). The cages exclude a small area of the pasture from grazing animals. These areas can later be measured and compared with the grazed area, allowing estimation of how much forage accumulated during a specific period.
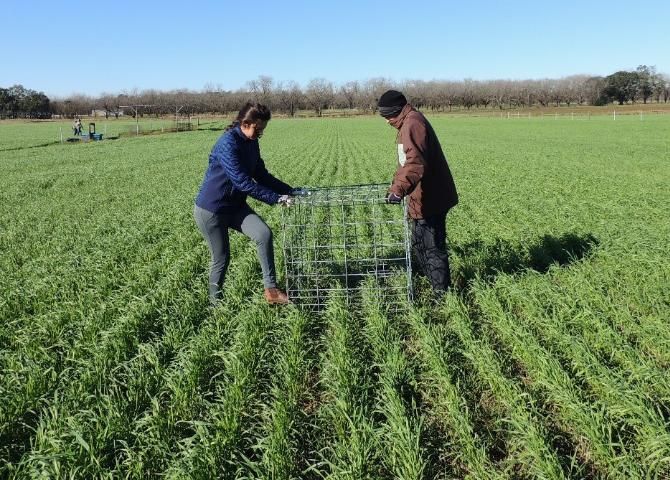
Credit: Jose Dubeux, UF/IFAS
The optimal number of cages depends on the size and heterogeneity of paddocks. Cages should be placed on sites that represent the average canopy condition of the paddock. Each cage should remain for a predefined interval—generally between 14 and 28 days—to assess herbage accumulation. The best method is to pair two quadrats of similar mass using a visual estimation, cut one, mark the second with a stake or piece of PVC pipe, and place the cage over it. Assuming both quadrats have the same mass, on the next sampling, cut the quadrat inside the cage. Make sure it is placed on the exact location of the previous evaluation. The difference between the forage mass of the second evaluation and the first is the amount accumulated during that period. Divide by the number of days the cage was in place and this will determine the forage accumulated per day. Although variable depending on the time of year (weather) and fertilization management, this information can be very valuable for future forage planning.
For rotational stocking, it is easier to assess pasture productivity. Instead of using cages, the pasture can be sampled before and after the animals graze the paddock. With the difference between the actual herbage mass before the current grazing event and the post-grazing herbage mass of the previous grazing cycle, forage accumulation can be calculated. The measurements of herbage mass on rotationally stocked pastures can also be done using direct or indirect methods. Remember that the post-grazing structure (amount of forage and proportion of leaf and stem) of the canopy is very different from the pre-grazing structure, so the gauge will need to be calibrated to account for these differences.
Calculating Herbage Mass and Managing Grazing
In a pasture, only part of the herbage mass should be consumed by the herd in order to assure regrowth and stand persistence. In general, 50% of the standing biomass should stay to allow faster regrowth. Grazing efficiency (the forage harvested by grazing animals divided by herbage accumulation) should be based on herbage accumulation (not herbage mass). In this case, grazing efficiency should be high to maximize management, as long as the residual standing biomass is preserved. Overgrazing could limit bite mass and the quality of forage consumed.
By its definition, SR is indirectly related to animal performance because it does not determine quantity or quality of forage (Burns et al. 1989). In this context, SR should be adjusted to incorporate production variability due to seasonal patterns. If herbage accumulation decreases, then the SR should follow the same pattern, or the farmer should have additional sources of feed to meet animal requirements. Similarly, during the peak of production of warm-season species, there are many alternatives that could be used, including greater SR, deferring of pastures for stockpiling, or production of hay or haylage from part of the pasture. Although this is not commonly done, the management of the herd numbers can also serve as a pasture management tool as animals can be bought or sold as necessary based on forage mass on the system. If possible, schedule the selling of some stock (e.g., weaned calves) for times of the year with lower herbage mass. This strategy will also reduce your need for forage.
Herbage allowance is defined as unit of herbage mass per unit of animal live weight at a point in time (Hodgson 1979). This is an important parameter for pasture management because it brings both a reference of forage mass and animal density. The calculation of herbage allowance is relatively straightforward: divide the amount of forage per acre by the live weight of the animals per acre. Offering animals around 2 lb DM/lb of animal live weight is optimal, but this number can fluctuate with forage species and time of year. Another way to prevent overgrazing and assure animal productivity is to maintain 1,200–1,500 lb DM/acre.
Conclusion
- Herbage mass determination is an important tool that can help adjust management strategies for livestock-forage systems aiming to improve feasibility and sustainability.
- Proper determination of herbage accumulation allows for adequate stocking rates, which reduce the occurrence of overgrazing or undergrazing. This will likely help producers avoid compromised stand persistence and diet quality.
- Due to seasonal fluctuations in herbage accumulation, stocking rate should be adjusted to optimize animal production per area and use of resources.
- Herbage accumulation determines carrying capacity; herbage mass determines stocking rate. Adjusting stocking rate is the single most important management tool to maintain pasture productivity and avoid the negative effects of pasture degradation due to overgrazing.
References
Burns, J. C., H. Lippke, and D. S. Fisher. 1989. "The Relationship of Herbage Mass and Characteristics to Animal Responses in Grazing Experiments." In Grazing Research: Design, Methodology, and Analysis, CSSA Spec. Publ. 16., edited by G. C. Marten. 7–19. Madison, WI: CSSA and ASA. doi:10.2135/cssaspecpub16.c2
Hodgson, J. 1979. "Nomenclature and definitions in grazing studies." Grass Forage Sci. 34: 11–18.
Sollenberger, L. E., J. E. Moore, V. G. Allen, and C. G. S. Pedreira. 2005. "Reporting forage allowance in grazing experiments." Crop Sci. 45: 896–900.