Introduction
Turfgrass and landscape irrigation recommendations from UF/IFAS are provided in a number of publications (Table 1). Two basic recommendations emerge for sprinkler-irrigated turfgrass:
- Irrigating "deep and infrequently" (0.5 inches to 0.75 inches) is recommended for wilting turf growing in a sandy soil where vertical root growth is not limited.
- Irrigation frequency and run times are recommended based on irrigation application rate, month of the year, and different climate areas within the state (see https://edis.ifas.ufl.edu/publication/AE220).
The first recommendation is based on the concept of replacing the soil water deficit at some threshold and is simple and easy to communicate. However, this generalized recommendation is not applicable to all soil conditions in Florida. For example, many soils in south Florida and coastal areas do not have sufficient depth to retain 0.5 to 0.75 inches of water. In addition, it ignores the fact that most new homes in Florida have in-ground irrigation with timers that must be programmed with minutes of irrigation per zone to apply a given amount of water. Therefore, Dukes and Cardenas (2024) developed recommendations which convert inches of irrigation required to timer run times and presented them in “Operation of Residential Irrigation Timers” (https://edis.ifas.ufl.edu/ae220).
The depth (inches) of irrigation application is based on the calculation of full evapotranspiration (ET) replacement for the turfgrass, using historical rainfall data and calculated ET for various parts of the state as presented by Augustin (1983).
The two recommendations summarized above are inherently different in that the first is aimed at a user manually controlling the irrigation application; the second recommendation methodology provides guidelines on how to program irrigation timers for unattended operation based on historical irrigation needs (plant demand minus rainfall input). There is a need to review these recommendations and, if possible, define a single recommendation that can be given to stakeholders.
Irrigation recommendations for ornamental plant material are less prevalent. This lack of recommendations is due to the wide range of landscape plant material and the lack of scientific study of water requirements for each plant type. Further complicating a science-based irrigation recommendation is the fact that typically many types of plant materials are mixed in the landscape. It is often assumed that irrigation levels satisfying turfgrass water requirements will satisfy ornamentals, but this situation may result in overwatering of ornamental plants. Recent research has been used to develop recommendations for irrigation of shrubs and trees as reported in “Fertilization and Irrigation Needs for Florida Lawns and Landscapes” (see https://edis.ifas.ufl.edu/publication/EP110).
Objectives
- Review current turfgrass and landscape irrigation recommendations and determine if they are consistent, accurate, and reasonable.
- Produce a coordinated science-based turf and landscape irrigation recommendation.
Irrigation Recommendations Literature Review
The "fixed amount" recommendation probably stems from the idea that the soil holds a fixed amount of water and needs to be refilled after it has been depleted (Dukes 2007). However, without knowing site characteristics, this recommendation could lead to overirrigation of as much as 78% (Dukes 2007). Turfgrass and landscape irrigation recommendations for a fixed amount can be found in numerous Extension documents from across the country and seem to be targeted for the manual (i.e., hose and sprinkler) irrigator.
More sophisticated approaches for landscape irrigation scheduling exist. North Carolina State University (NCSU) has a turfgrass irrigation management system (TIMS) based on real-time weather data and user inputs such as sprinkler application rate and type of grass. The site can be found at https://www.turffiles.ncsu.edu/tims-water-management-calculator/. The calculations within the TIMS system are a daily soil water balance or water budget (described later). Despite the availability of this resource, fixed depth recommendations still exist in various Extension turfgrass publications from NCSU. There is a weather network in California known as the California Irrigation Management Information System (CIMIS) that provides real-time and archived evapotranspiration (ET) data from the website, https://cimis.water.ca.gov/. The water budget approach is recommended and is used widely by consultants in California and throughout the western states. It is considered the most accurate method for irrigation scheduling and water resources planning where weather data are available. In Arizona, a system exists that gives general guidelines for watering via the web (http://cals.arizona.edu/azmet/phxturf.html). This system is connected to the Arizona Meteorological Network, AZMET, which uses real-time weather data for its recommendations. In addition, a newer tool exists for the Phoenix area that is similar to the TIMS system where irrigation system information can be specified and saved online in a user account.
Ask IFAS publication AE220, “Operation of Residential Irrigation Timers” (Dukes and Cardenas 2024), was used to develop a simple, web-based guideline for turfgrass irrigation (http://fawn.ifas.ufl.edu/tools/urban_irrigation/). This online tool simplifies the information in AE220, so that within two clicks of entering the website, users can determine how many minutes to set their time clock for a particular time of year. This site is intended to give users a rough estimate for irrigation amounts. This schedule is essentially the approach used by Haley et al. (2007) to reduce applied water by 30% on homes in a central Florida research study.
Irrigation Scheduling Research in Florida
Turfgrass irrigation research has been ongoing in Florida since the 1950s. Typically, research has been driven by prolonged drought conditions such as those that happened in the drought of 1998–2002 (Verdi et al. 2006).
Augustin and Snyder (1984) found that tensiometer-controlled turfgrass irrigation reduced water applied by 42% to 95% compared to a daily irrigation schedule. The tensiometer-controlled irrigation plots approximated the turfgrass ET demand during dry periods ranging from 3.2 to 3.3 inches/month in the cooler months of November through February and 5.1 to 5.7 inches/month in the warmer months of March through May. These values were slightly higher than the values of turfgrass consumptive use reported by Stewart and Mills (1967) ranging from 1.9 to 2.5 inches/month in the cool months and 3.3 to 5.2 inches/month in the warmer months. Annual water consumption in south Florida was reported for St. Augustinegrass and bermudagrass as averaging 42.8 inches over five years using drainage lysimeters and three water table depths of 12, 24, and 36 inches (Stewart and Mills 1967).
Haley et al. (2007) applied the scheduling outlined in AE220 (Dukes and Cardenas 2024) to a home lawn and irrigation study. They found that by using the 100% irrigation replacement approach over a 30-month period, an average monthly irrigation reduction of 30% was realized. Visual quality ratings for turf on this schedule were no different than the other irrigation treatments in the study. However, these homes still overirrigated with respect to theoretical requirements for several reasons:
- The actual irrigation systems were inherently inefficient. About 25% more water than the target amount needed to be applied to adequately water all areas of the landscape was used. Although the distribution uniformity of these homes averaged 0.45 (where 1.0 is perfect uniformity) (Baum et al. 2005), the actual uniformity of soil moisture was not negatively impacted by sprinkler low quarter distribution uniformity (DUlq). It has been shown that soil moisture uniformity is not negatively impacted until catch can-measured DUlq falls below 0.4 to 0.5 (Dukes et al. 2006). Thus, even though some gains in water conservation could be made by increasing the efficiency of the irrigation application, the amount of gain is overstated as estimated by low quarter distribution uniformity (DUlq).
- The 100% ET replacement schedule in AE220 is intentionally conservative (i.e., with intentionally high irrigation estimates). This built-in inefficiency is an artifact of the McCloud (1955) ET methodology used by Augustin (1983), which typically overestimates plant ET (except for the climate of Gainesville, FL, where the empirical formula was developed). Jacobs and Satti (2001) found that the McCloud formula overestimated reference ET (ETo) by 7% for Daytona Beach and 5% for Gainesville on an annual basis. However, daily estimates were overpredicted by more than 40% in some cases. Temperature-based ET methods, such as McCloud's, typically overestimate ET in the summer and underestimate in the winter because they do not account for the cloud cover of humid climates (Amatya et al. 1995; Irmak et al. 2003; Jacobs and Satti 2001; Jensen et al. 1990). Additionally, McCloud readily admits that the aboveground lysimeters used to develop this estimate probably overestimated ET due to the oasis effect. The lysimeter tanks were surrounded by a dry environment which leads to increased ET from advective heat transfer (McCloud 1955). The McCloud (1955) method is presented as ETp = KWT-82, where ETp is potential ET, analogous to crop ET (ETc) in well-watered environments (inches/d), K = 0.01 (Gainesville), W = 1.07 (Gainesville), and T is mean daily air temperature (degrees F). McCloud (1955) also indicated that this formula is limited to temperatures between 45°F and 80°F.
- In any given year, the historical data used by Augustin (1983) will not necessarily match the particular weather that year.
Soil Water Budget Approach
In the irrigation industry, it is standard practice to calculate theoretical irrigation requirements based on a soil water budget (SWB), also called a soil water balance. Sometimes this technique is referred to as "the checkbook method" where the soil water storage is the bank account. ETc represents withdrawals, while irrigation and rain represent deposits. Other withdrawals include deep percolation below the root zone (i.e., drainage) or surface runoff.
There are several simplifying assumptions that make this method well adapted for conditions in Florida. It is typically assumed that there is minimal runoff due to relatively high infiltration rates and flat slopes. This technique assumes one-dimensional flow vertically, steady state (i.e., drained to equilibrium) conditions at each time step or interval, and no contribution from a shallow water table. Again, permeable soils such as the sands that are prevalent in most of Florida are thought to make these assumptions appropriate for much of the state. In cases where a high water table exists, capillary flow upward from the root zone should be taken into account. The SWB can be calculated on a daily, weekly, or monthly basis depending on input data availability.
This approach is used by the Florida water management districts to allocate water for irrigation purposes. The SWB is commonly accepted by irrigation practitioners and industry as the standard approach for calculating irrigation water requirements as well as scheduling irrigation (IA 2005; Jensen et al. 1990).
If real-time weather data are available, the SWB approach can be used for irrigation scheduling, and if historical data are available, the SWB approach can be used to determine long-term average irrigation requirements.
The SWB approach was described by Smajstrla and Zazueta (1988) and later became the Agricultural Field Scale Irrigation Requirements Simulation (AFSIRS) model (Smajstrla 1990), which was adopted by the St. Johns River Water Management District for irrigation permitting. The Northwest Florida Water Management District uses this model for permitting, while the Southwest Florida Water Management District uses a similar approach but a different model. The South Florida Water Management District references this model for consumptive use permitting.
Example of Calculated Water Requirements, Jacksonville, FL
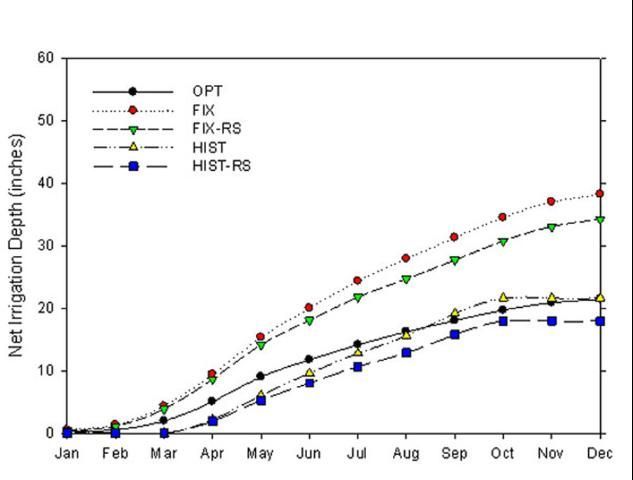
In a study conducted by Dukes (2007), weather data were gathered for Jacksonville. The data were carefully quality checked and adjusted as necessary to represent data from a well-watered site for calculation of ETo by the ASCE standardized method (Allen et al. 2005). Assumptions used in this analysis were a 50% allowable deficit of the soil water storage (the difference between field capacity and permanent wilting point) and an 8-inch root zone (representative for lawn turfgrass) on a sand with field capacity (FC) = 10% and permanent wilting point (PWP) = 3% by volume. Crop coefficients for warm-season turfgrass developed in Florida (Jia et al. 2007) were used to convert ETo values to ETc. The following comparisons were set up (Dukes 2007):
- OPT, irrigation to refill the soil reservoir when 50% of available water is depleted;
- FIX, 0.75 inches of irrigation when 50% of the available water is depleted;
- FIX-RS, addition of a rain sensor set at 0.25 inches to FIX schedule;
- HIST, 100% replacement schedule from AE220;
- HIST-RS, addition of a rain sensor set at 0.25 inches to HIST schedule.
Figure 1 gives the average annual cumulative irrigation required by the irrigation schedule comparisons. The "FIX" and "FIX-RS" schedules are 0.75 inch of irrigation when significant turfgrass wilt occurs. The fixed schedule without a rain sensor overestimated irrigation required by 78% and with a rain sensor by 60%.

Credit: After Dukes (2007)
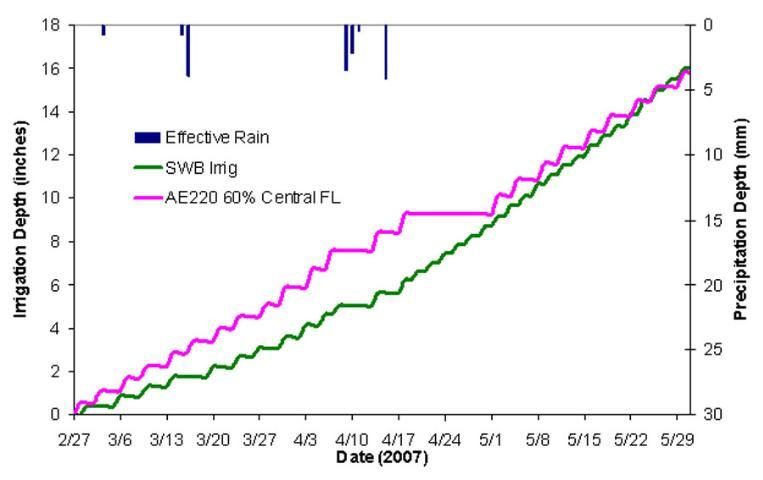
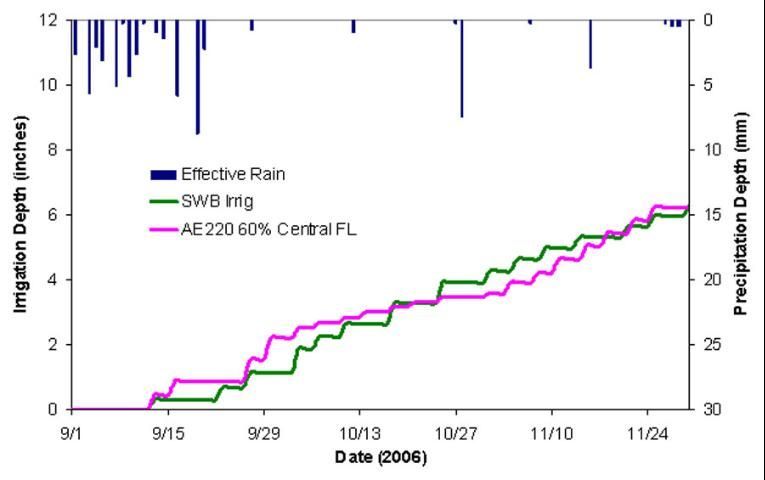
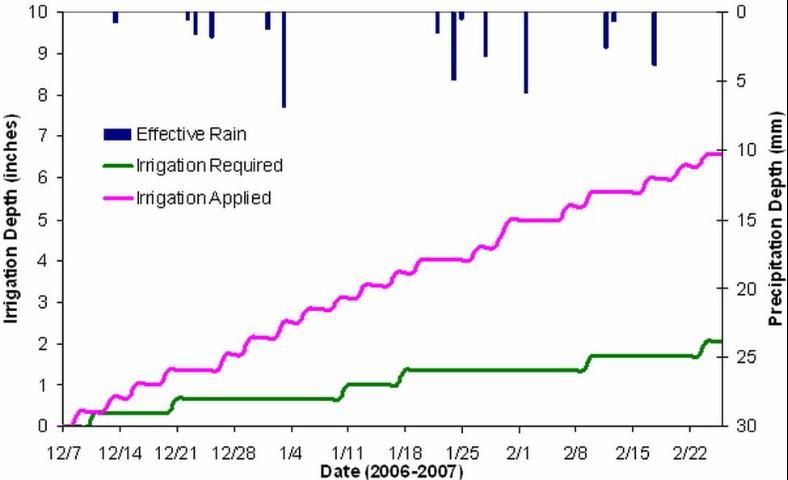
Subsequent research projects on turfgrass have been conducted in Gainesville, Citra, and Wimauma, FL, based on the time schedules recommended in AE220. It appears that 60% of the net irrigation requirement (shown in the irrigation recommendations within AE220) is an adequate amount even in drought conditions. Figures 2 through 4 show the actual irrigation applied based on the 60% replacement schedule in the tables of AE220. In the warmer months (April and May in Figure 2 and September through November in Figure 3), the AE220 schedule for south Florida (used for the research site at Wimauma) slightly overpredicts irrigation requirements or closely matches the soil water balance predicted by an SWB. However, in the winter months, irrigation is overpredicted (Figure 4).

Credit:

Credit:

Credit:
The 60% replacement schedule in AE220 was adequate during the warm months. However, the edges of the plots required hand watering due to incomplete coverage of the irrigation system. This lack of uniformity is common; thus, the 80% recommendation would be conservative with respect to providing adequate water across a range of irrigation system qualities. A well-designed and maintained irrigation system could likely use the 60% replacement for maximum water conservation potential.
Conclusions and Recommendations
Although the fixed-depth irrigation recommendation is simple and easy to communicate, it could lead to overirrigation. This is because of the tendency for this depth to exceed the water-holding capacity of many sandy Florida soils. In addition, many homeowners set irrigation amounts and do not readjust properly for seasonal changes. This tendency is reinforced by water restrictions which mandate specific day-of-the-week schedules. Day-of-the-week water restrictions reduced municipal water use 15% to 20% in SFWMD during the spring and summer of 2007 (data not shown), but this amount is far below the 50% reduction expected from a 2 day/week to a 1 day/week transition. Recommendations, such as SWFWMD's winter "Skip a Week" campaign, encourage users to adjust their time clocks. However, the challenge with such recommendations is getting homeowners to follow through on them.
Unification of the various UF/IFAS landscape irrigation recommendations can be expressed as, "Irrigate when plants show visual cues of water stress.” When using a timer for irrigation scheduling, users can find run times based on historical weather data in “Operation of Residential Irrigation Timers” (https://edis.ifas.ufl.edu/ae220); it is recommended that irrigation schedules be changed each month, accordingly. An easy, user-friendly version, the Urban Irrigation Scheduler, can be found at http://fawn.ifas.ufl.edu/tools/urban_irrigation/. Smart irrigation controllers (e.g., soil moisture sensors, ET-controllers) offer the potential to automatically adjust irrigation according to weather conditions once installed and set up properly.
References
Allen, R. G., I. A. Walter, R. L. Elliot, and T. A Howell. 2005. The ASCE Standardized Reference Evapotranspiration Equation. Reston, VA: American Society of Civil Engineers. https://doi.org/10.1061/9780784408056
Amatya, D. M., R. W. Skaggs, and J. D. Gregory. 1995. "Comparison of Methods for Estimating Ref-ET." Journal of Irrigation and Drainage Engineering-ASCE 121 (6): 427–435. https://doi.org/10.1061/(ASCE)0733-9437(1995)121:6(427)
Augustin, B. J. 1983. Water Requirements of Florida Turfgrasses. Bull. 200. Gainesville: University of Florida Institute of Food and Agricultural Sciences. https://ufdc.ufl.edu/uf00026380/00001
Augustin, B. J., and G. H. Snyder. 1984. "Moisture Sensor-Controlled Irrigation for Maintaining Bermudagrass Turf." Agron. J. 76 (5): 848–850. https://doi.org/10.2134/agronj1984.00021962007600050030x
Baum, M. C., M. D. Dukes, and G. L. Miller. 2005. "Analysis of Residential Irrigation Distribution Uniformity." Journal of Irrigation and Drainage Engineering-ASCE 131 (4): 336–341. https://doi.org/10.1061/(ASCE)0733-9437(2005)131:4(336)
Dukes, M. D. 2007. "Turfgrass Irrigation Requirements Simulation in Florida." Proc., International Irrigation Show: 2007 Technical Conference Proceedings. San Diego, CA: Irrigation Association. CDROM.
Dukes, M. D., M. B. Haley, and S. A. Hanks. 2006. "Sprinkler Irrigation and Soil Moisture Uniformity." Proc., 27th Annual International Irrigation Show. San Antonio, TX: Irrigation Association. CDROM.
Dukes, M. D., and B. Cardenas. 2024. “Operation of Residential Irrigation Timers.” CIR1421. Gainesville: University of Florida Institute of Food and Agricultural Sciences. https://edis.ifas.ufl.edu/ae220
Garner, A., H. Stevely, M. Smith, M. Hoppe, T. Floyd, and P. Hinchcliff. 2006. A Guide to Florida-Friendly Landscaping: Florida Yards and Neighborhoods Handbook. SP 191. 3rd Edition. Gainesville: University of Florida Institute of Food and Agricultural Sciences. https://ufdc.ufl.edu/wc13844287/00001
Haley, M. B., M. D. Dukes, and G. L. Miller. 2007. “Residential Irrigation Water Use in Central Florida.” Journal of Irrigation and Drainage Engineering 133 (5): 427–434. https://doi.org/10.1061/(ASCE)0733-9437(2007)133:5(427)
IA (Irrigation Association). 2005. Landscape Irrigation Scheduling and Water Management. Falls Church, VA.
Irmak, S., R. G. Allen, and E. B. Whitty. 2003. "Daily Grass and Alfalfa-Reference Evapotranspiration Estimates and Alfalfa-to-Grass Evapotranspiration Ratios in Florida." Journal of Irrigation and Drainage Engineering-ASCE 129 (5): 360–370. https://doi.org/10.1061/(ASCE)0733-9437(2003)129:5(360)
Jacobs, J. M., and S. R. Satti. 2001. Evaluation of Reference Evapotranspiration Methodologies and AFSIRS Crop Water Use Simulation Model (Final Report). Gainesville, FL: University of Florida Department of Civil and Coastal Engineering.
Jensen, M. E., R. D. Burman, and R. G. Allen. 1990. Evapotranspiration and Irrigation Water Requirements: A Manual. New York, NY: The Society.
Jia, X., M. D. Dukes, and J. M. Jacobs. 2007. "Development of Bahiagrass Crop Coefficient in a Humid Climate." Proc., International Meeting of the American Society of Agricultural and Biological Engineers. Minneapolis, MN: American Society of Agricultural and Biological Engineers. ASABE Paper No. 07–2151.
Klein, R., A. J. Lindsey, M. McMillan, J. Bryan Unruh, and M. D. Dukes. 2023. “Fertilization and Irrigation Needs for Florida Lawns and Landscapes.” ENH860. Gainesville: University of Florida Institute of Food and Agricultural Sciences. https://edis.ifas.ufl.edu/publication/ep110
McCloud, D. E. 1955. "Water Requirements of Field Crops in Florida as Influenced by Climate." Proceedings of the Soil and Crop Science Society of Florida 15:165–172.
Smajstrla, A. G., B. J. Boman, D. Z. Haman, F. T. Izuno, D. J. Pitts, and F. S. Zazueta. 1997. “Basic Irrigation Scheduling in Florida.” BUL249. Gainesville: University of Florida Institute of Food and Agricultural Sciences. https://ufdc.ufl.edu/IR00001504/00001/pdf
Smajstrla, A. G., and F. S. Zazueta. 1995. “Estimating Crop Irrigation Requirements for Irrigation System Design and Consumptive Use Permitting.” AE257. Gainesville: University of Florida Institute of Food and Agricultural Sciences. https://ufdc.ufl.edu/IR00003716/00001/pdf
Smajstrla, A. G. 1990. Technical Manual Agricultural Field Scale Irrigation Requirements Simulation (AFSIRS) Model, version 5.5. Gainesville, FL: University of Florida Institute of Food and Agricultural Sciences Department of Agricultural and Biological Engineering.
Smajstrla, A. G., and F. S. Zazueta. 1988. "Simulation of Irrigation Requirements of Florida Agronomic Crops." Soil and Crop Science Society of Florida Proceedings 47:78–82.
Stewart, E. H., and W. C. Mills. 1967. "Effect of Depth to Water Table and Plant Density on Evapotranspiration Rate in Southern Florida." Transactions of the ASAE 10 (6): 746–747. https://doi.org/10.13031/2013.39776
Tichenor, J., M. D. Dukes, and L. E. Trenholm. 2003. “Using the Irrigation Controller for a Better Lawn on Less Water.” ENH978. Gainesville: University of Florida Institute of Food and Agricultural Sciences. http://ufdc.ufl.edu/IR00001756/00001
Trenholm, L. E., and J. B. Unruh. 2012. “Let Your Lawn Tell You When to Water.” ENH63. Gainesville: University of Florida Institute of Food and Agricultural Sciences. https://ufdc.ufl.edu/IR00008134/00001/pdf
Trenholm, L. E., J. L. Cisar, and J. B. Unruh. 2021. “St. Augustinegrass for Florida Lawns.” ENH5. Gainesville: University of Florida Institute of Food and Agricultural Sciences. https://doi.org/10.32473/edis-lh010-2021
Verdi, R. J., S. A. Tomlinson, and R. L. Marella. 2006. The Drought of 1998–2002: Impacts on Florida’s Hydrology and Landscape. U.S. Geological Survey Circular 1295. https://doi.org/10.3133/cir1295
Zazueta, F. S., A. Brockway, L. Landrum, and L. B. McCarty. 2020. “Turf Irrigation for the Home.” CIR829. Gainesville: University of Florida Institute of Food and Agricultural Sciences. https://doi.org/10.32473/edis-ae144-1995
Zazueta, F. S., G. L. Miller, and W. Zhang. 2000. “Reduced Irrigation of St. Augustinegrass Turfgrass in the Tampa Bay Area.” AE264. Gainesville: University of Florida Institute of Food and Agricultural Sciences. https://ufdc.ufl.edu/IR00002452/00001/pdf
Table 1. UF/IFAS turfgrass and landscape irrigation recommendations published in Ask IFAS.