Introduction
In recent years, there has been a notable increase in the use of uncrewed aerial systems (UASs, UAVs, or drones) for agricultural management. Mapping specific areas, surveying for nutritional deficiencies in crops, and evaluating post-event damages, all of which are fundamental applications in the realm of remote sensing, have demonstrated themselves as viable and valuable uses for UASs in agriculture and natural resource management. However, it is essential to note that the Federal Aviation Administration (FAA) deems that any person operating a UAS for commercial applications, including for research, must hold an active Part 107 Remote Pilot Certificate. Failure to follow FAA guidelines can result in federal fines and prosecution (FAA 2023). Furthermore, state and local authorities may adjust UAS operating procedures.
The post-processing of UAS images and the generation of final products can pose challenges and add expenses for a number of users. The resulting end products from this workflow encompass orthomosaics, which are comprehensive, high-quality images of the Earth's surface corrected for geometry, and digital surface models, which are three-dimensional visual representations of elevation data. Processing each of these requires significant computational resources, thereby increasing the barriers to entry. Consequently, free and open-source software (FOSS) solutions in the field of remote sensing provide advantages in terms of accessibility, flexibility, and often user-friendliness, in contrast to commercial off-the-shelf (COTS) solutions that are typically proprietary, costly, and possibly complicated to operate. The popularity of FOSS alternatives is on the rise due to several key factors:
- UASs using open-source guidance and control software allow for more customized and flexible options and payloads to diversify what type of data can be collected for processing.
- FOSS-based UASs are more convenient and affordable to maintain, repair, upgrade, and otherwise modify.
- The learning curve tends to be steeper than said COTS alternative, but this allows for a team to better understand the individual processes and components pertinent to UAS-based agricultural management and remote sensing.
- COTS remote sensing software is often too expensive for smaller teams, reaching upwards of $360 per month per license (3DSourced 2023).
This publication aims to help UAS operators become familiar with advanced data processing tools integrated into the WebODM FOSS. Serving as an exceptionally user-friendly platform for engaging with industry-standard photogrammetric technology, WebODM equips individuals with the means to enhance decision-making in fields such as land management, resource preservation, and disaster response, all through an uncomplicated user interface. The central aim of this publication is to underscore the process and sequence involved in producing data and outcomes by acquainting users with the fundamental features of WebODM.
WebODM
WebODM (https://www.opendronemap.org/webodm/) is a web interface for a popular open-source project, OpenDroneMap (ODM). ODM processes drone images using complex photogrammetric algorithms to create point clouds (WebODM Dev Team 2023a). ODM, by itself, can be configured and used exclusively via the command line. While this is perfectly acceptable for power users and more experienced professionals, such a restriction could close doors for many individuals. WebODM provides a graphical interface with a straightforward user experience to alleviate this potential barrier to entry. Given the broad capabilities of this software, this publication will focus on generating orthophoto and point cloud outputs from a generic dataset collected via a UAS.
This tool lowers the barrier to entry for people working in the field of remote sensing because it provides a better user interface/experience while also being cheaper (at most $57 per installation for a standard perpetual license to the installer), with the option to be completely free. A common competitor, Pix4DMapper, comes in at a cost of $360 per month at the time of writing, and while it provides more tools and capabilities for that price, the interface is regarded as unwieldy and clunky (3DSourced 2023). On average, the amount of time it takes to understand and use WebODM is much lower, because WebODM has fewer features overall, but it also has an easy-to-navigate interface, thorough documentation, and a stable user experience.
Table 1. Terminology found throughout this publication.
Installation
The installation process for WebODM is demonstrated below.
Checklist
An automated installer can be purchased for Windows or Mac OS, but the tool can be manually built on Linux as well. Before starting the installation process, ensure that the system it will be installed on is compatible with the software. The following list summarizes the minimum requirements for Windows:
- Windows 8 or newer
- Intel Celeron E1000 or AMD FX-8100 (Any x86_64 desktop computer made in the past 15 years)
- 20 GB free disk space
- 4 GB RAM
The following list summarizes the minimum requirements for Mac OS:
- macOS 10.15 or newer. Apple Silicon (M1) is supported.
- Mac hardware must be a 2010 or newer model and support virtualization.
- 20 GB free disk space
- 4 GB RAM
Minimum requirements will handle no more than 100–200 images (OpenDroneMap Dev Team 2023). The following list summarizes the best-case specifications for optimal performance of the software:
- Latest Generation CPU
- 100 GB of disk space
- 16 GB RAM
If configured correctly alongside a compatible CUDA installation, WebODM will use the GPU to accelerate processing performance. More CPU cores will increase the software performance linearly for the time to complete a given task (WebODM Dev Team 2023b). Higher-capacity disk space and RAM correlate linearly with how many images the system will be able to process (OpenDroneMap Dev Team 2023).
Installation and Setup
Automated Installer
The automated installer for the Windows or Mac OS versions of WebODM can be purchased at the following link: https://www.opendronemap.org/webodm/download/#installer. The tool handles all installation and configuration for the most straightforward user experience.
Building Manually
If the user wishes to build the installation manually, instructions can be found on the GitHub page here: https://github.com/OpenDroneMap/WebODM/. In summary, the following components are required to launch the Docker image of WebODM:
- Docker
- Git
- Pip
- Python (2 or 3)
The following commands are run in a Mac OS terminal, Linux terminal, or Windows command prompt:
git clone https://github.com/OpenDroneMap/WebODM --config core.autocrlf=input --depth 1
cd WebODM
./webodm.sh start

Credit: S. Patel, UF Department of Computer and Information Systems Engineering

Credit: S. Patel, UF Department of Computer and Information Systems Engineering
The first command downloads the Docker version of WebODM with the appropriate configuration. The following line shifts the current directory in the command prompt/terminal to the newly created WebODM directory. Finally, the last command launches the Docker image tool.
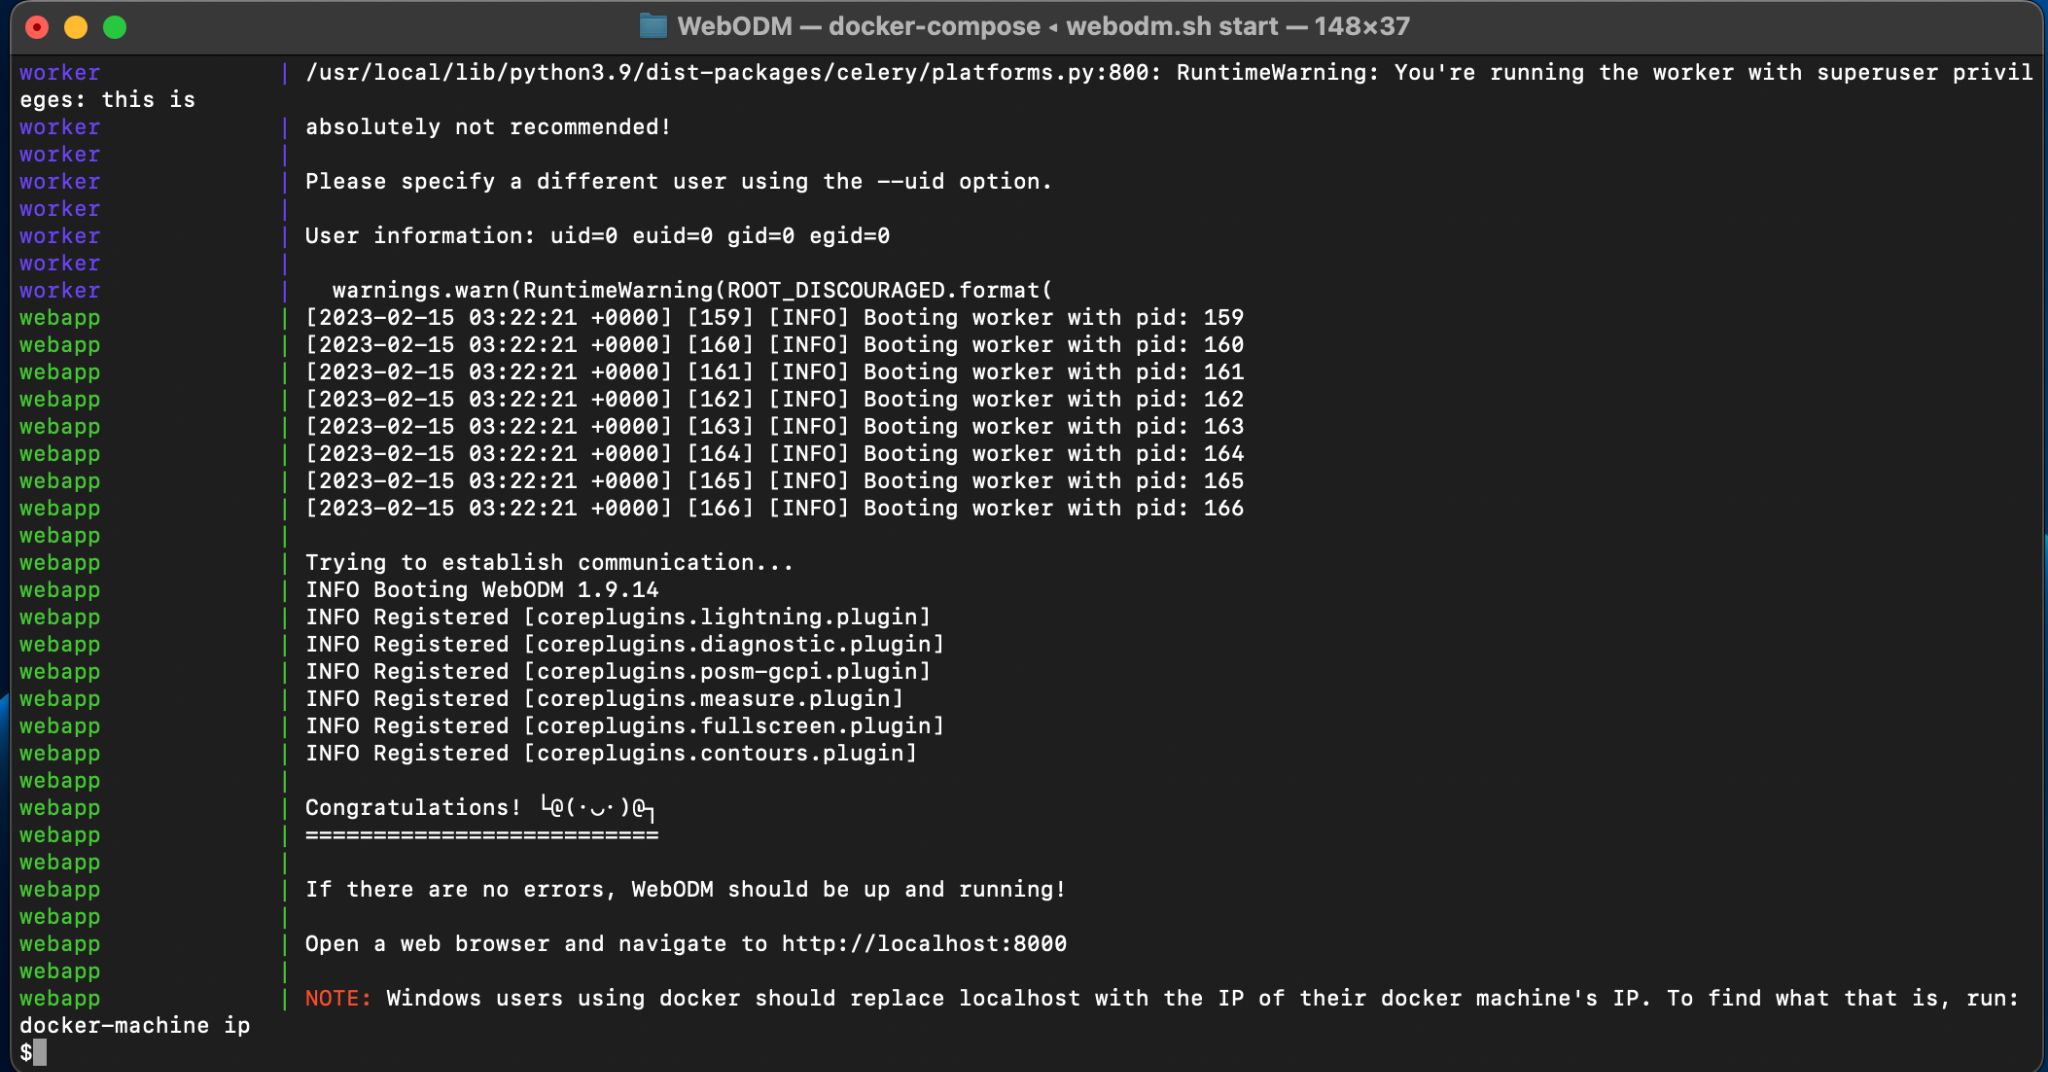
Credit: S. Patel, UF Department of Computer and Information Systems Engineering
WebODM Interface
The interface of WebODM is straightforward and is broken into a few primary tabs discussed below. An online demo is also available to help familiarize yourself with the interface (https://demo.webodm.org/dashboard/).
The Dashboard
The default Dashboard tab is shown in Figure 2a. This tab houses the core functionality to create tasks and projects by importing the relevant data to process. The “Add Project” button allows the creation of a project that organizes individual processing tasks. The “First Project” is created by default.
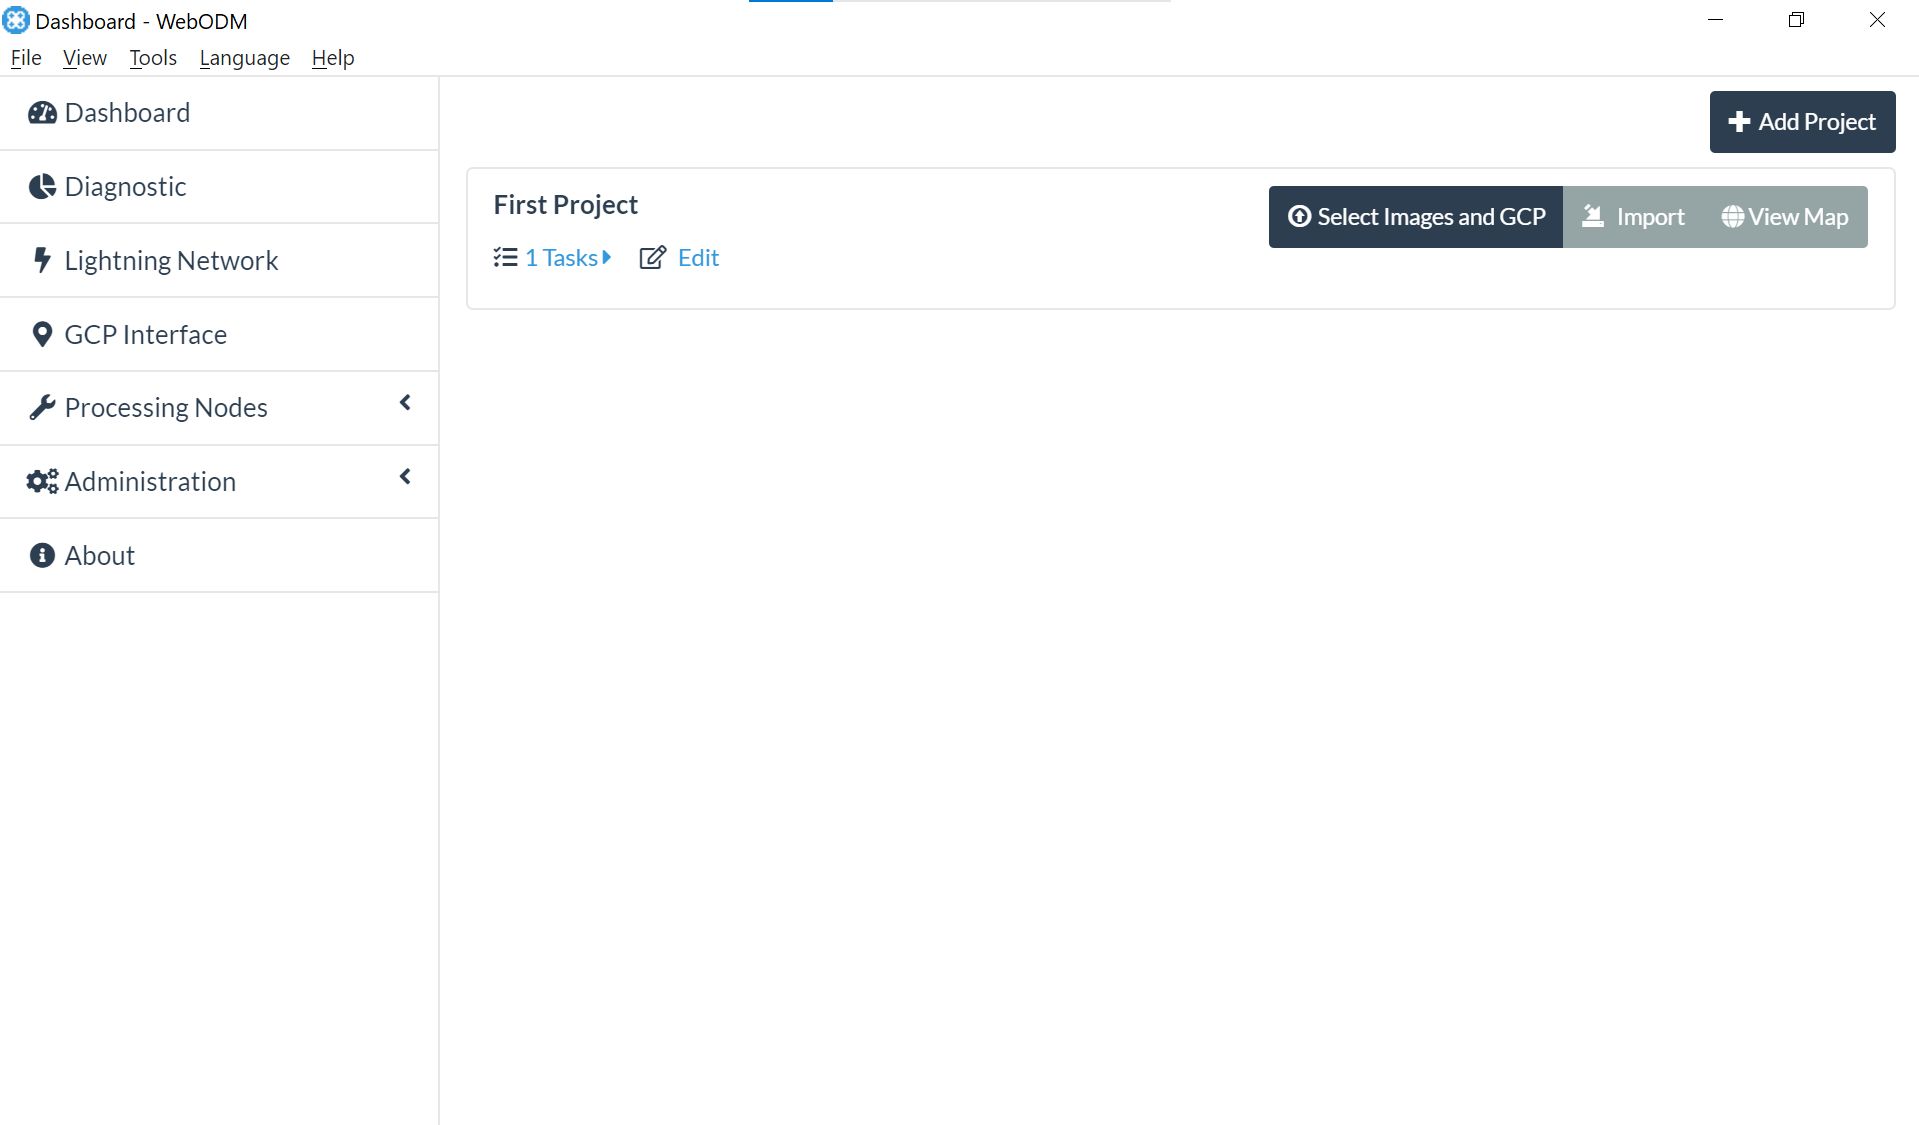
Credit: S. Patel, UF Department of Computer and Information Systems Engineering
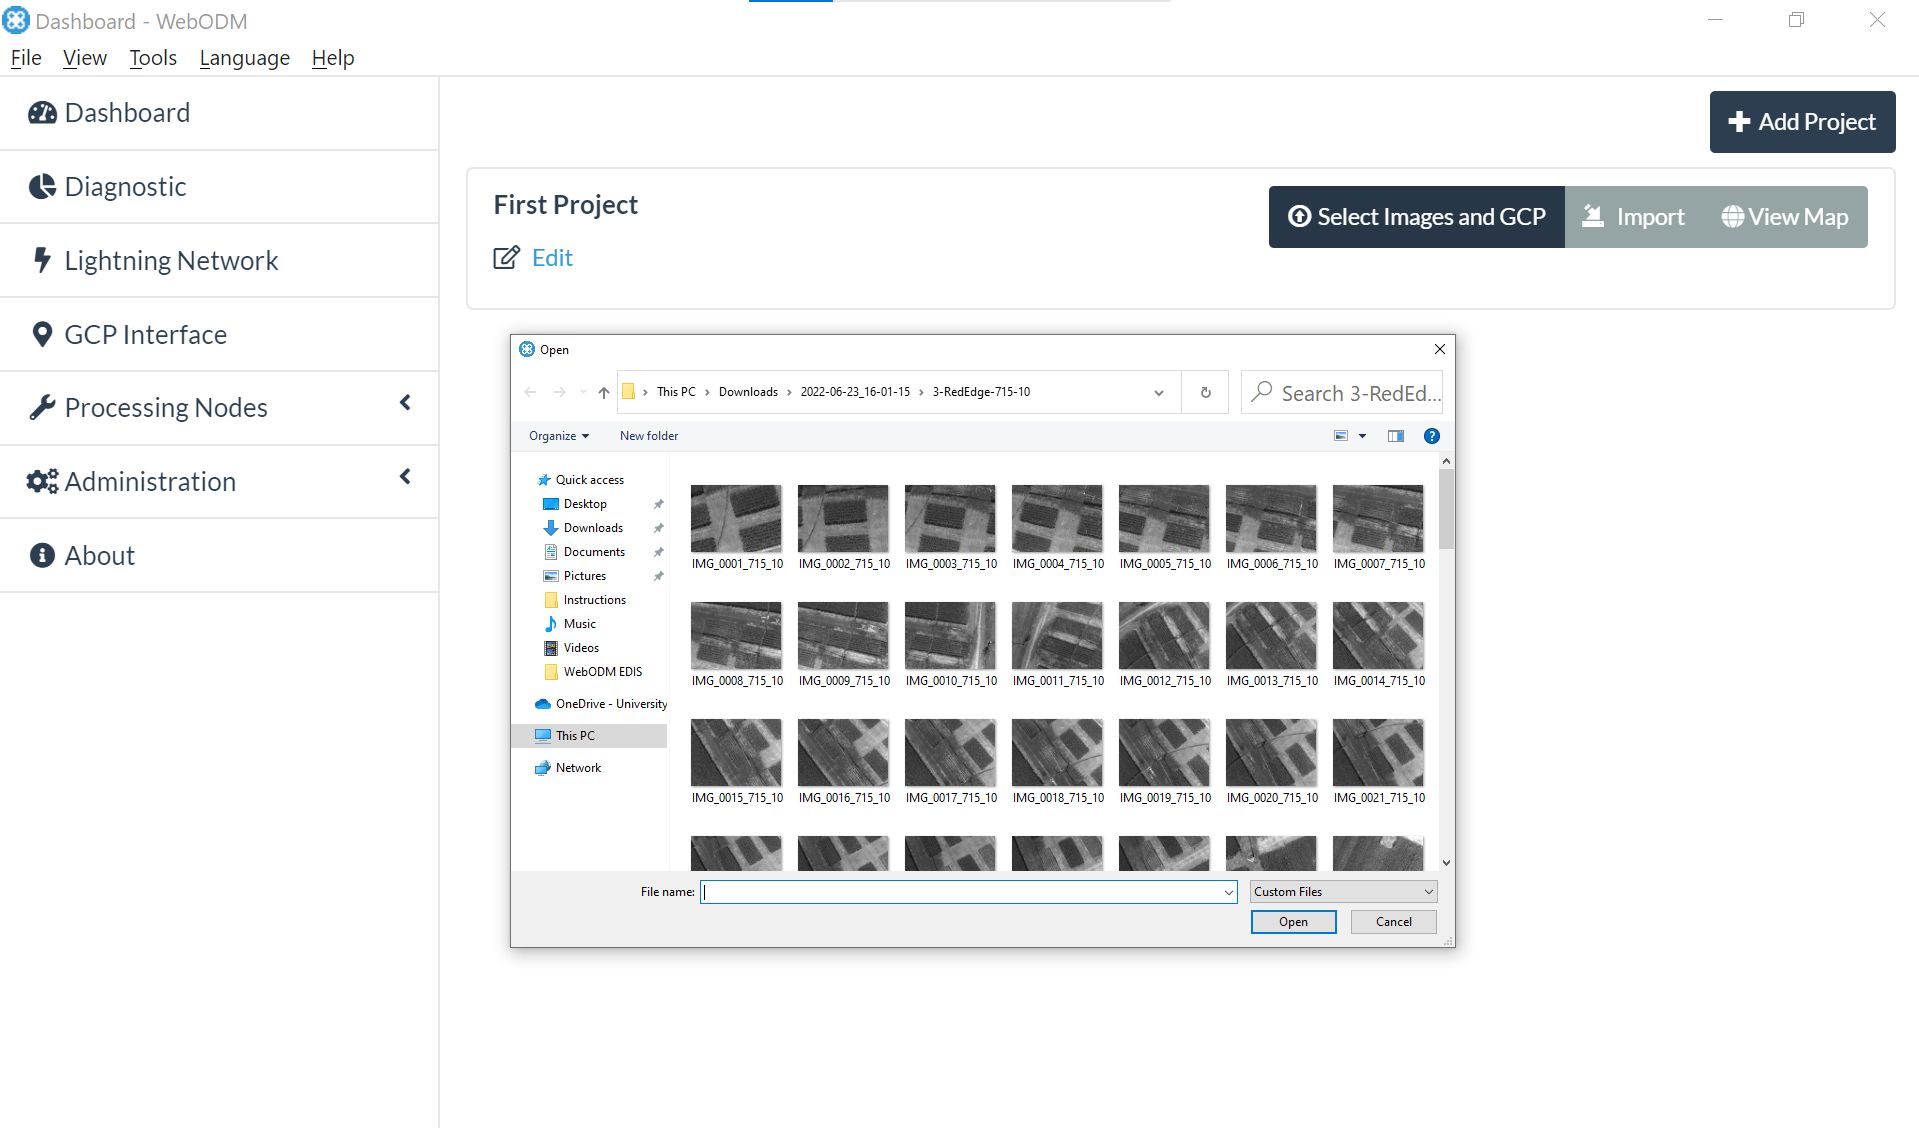
The “Select Images and GCP” button yields a File Explorer/Finder window to select the data to import (Figure 2b).
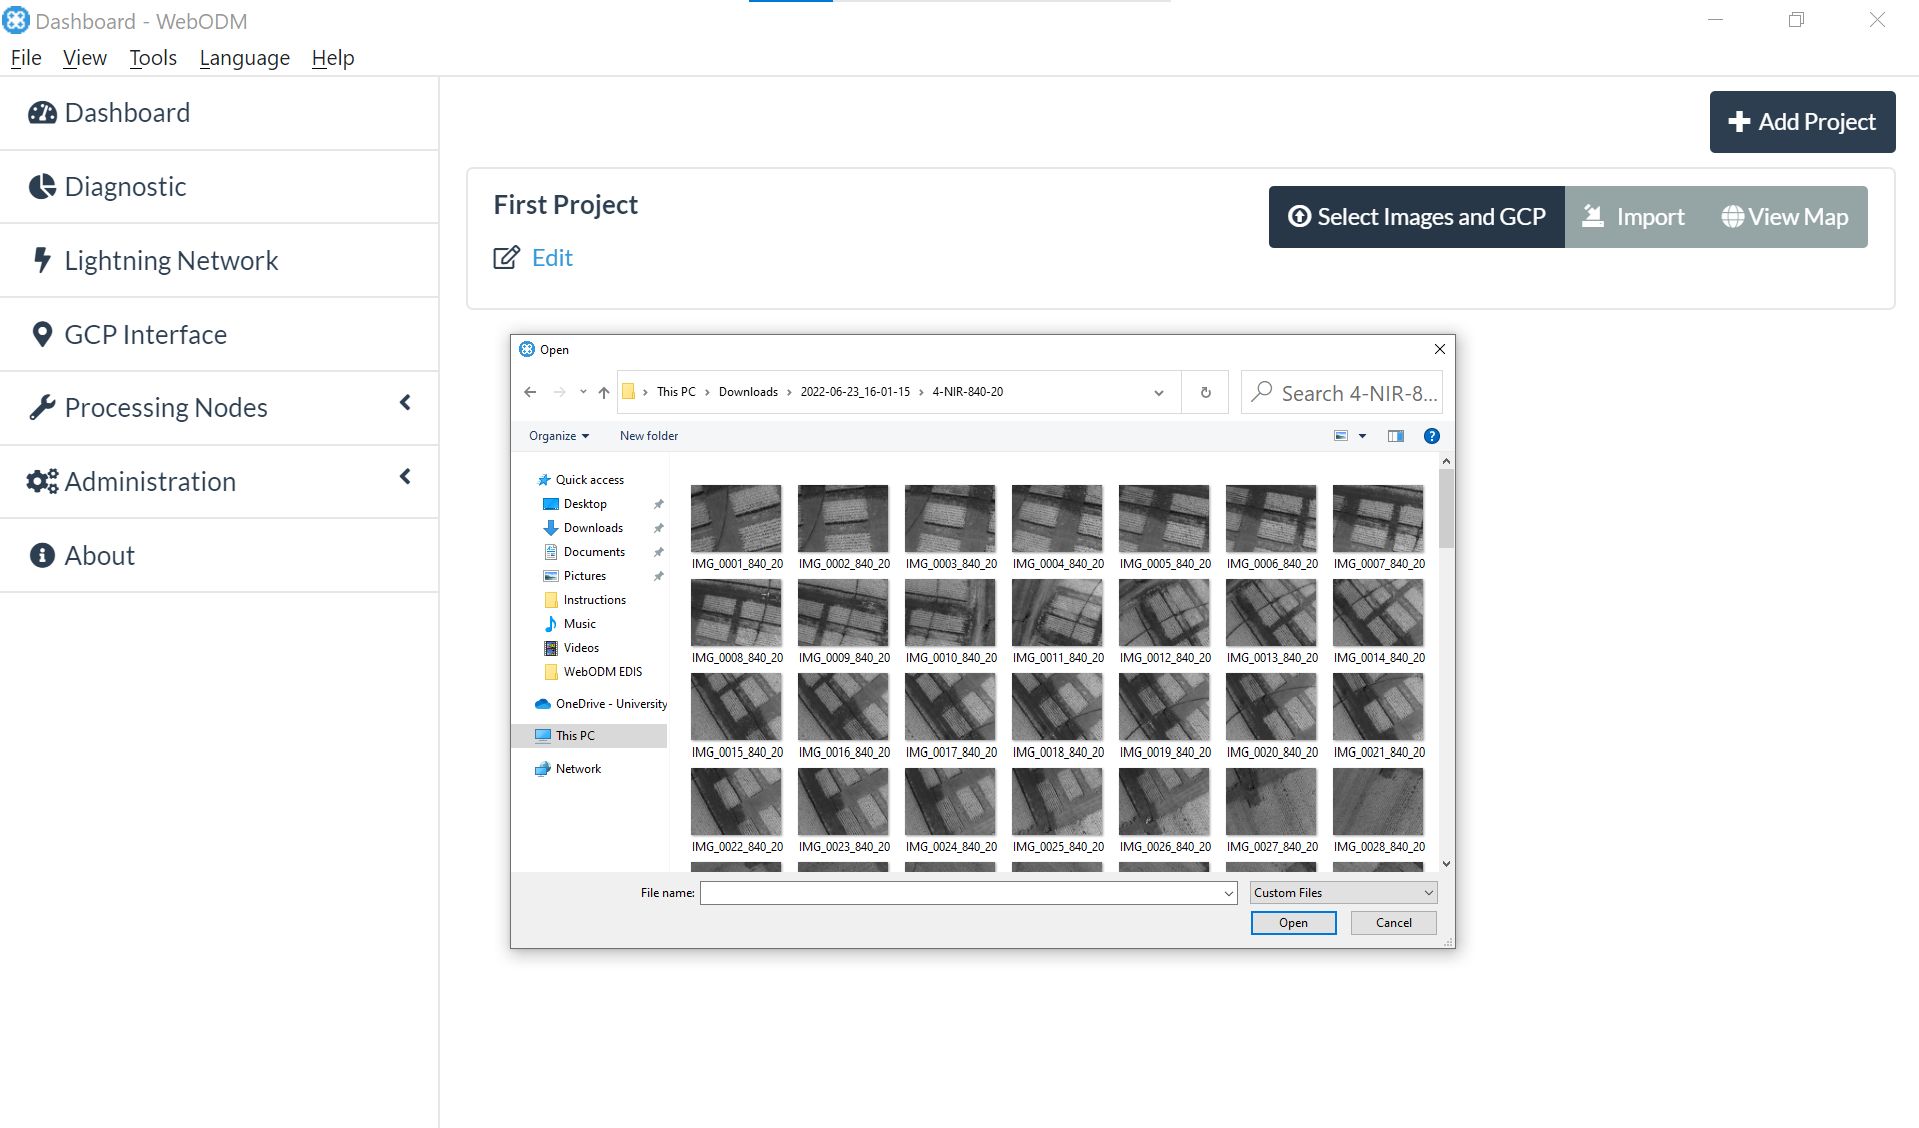
Credit: S. Patel, UF Department of Computer and Information Systems Engineering
The “Import” button allows importing WebODM-generated .zip files, either from a link or a local file on the system (Figure 2c). The files can be created later in the process once the data is processed and the results are generated.

Credit: S. Patel, UF Department of Computer and Information Systems Engineering
The “View Map” button previews a blank GPS map that reacts to the imported data (Figure 2d). Suppose the data is imported before clicking the “View Map” button. In that case, the map will display the region that bounds the imported data after said data is mosaicked together and processed.
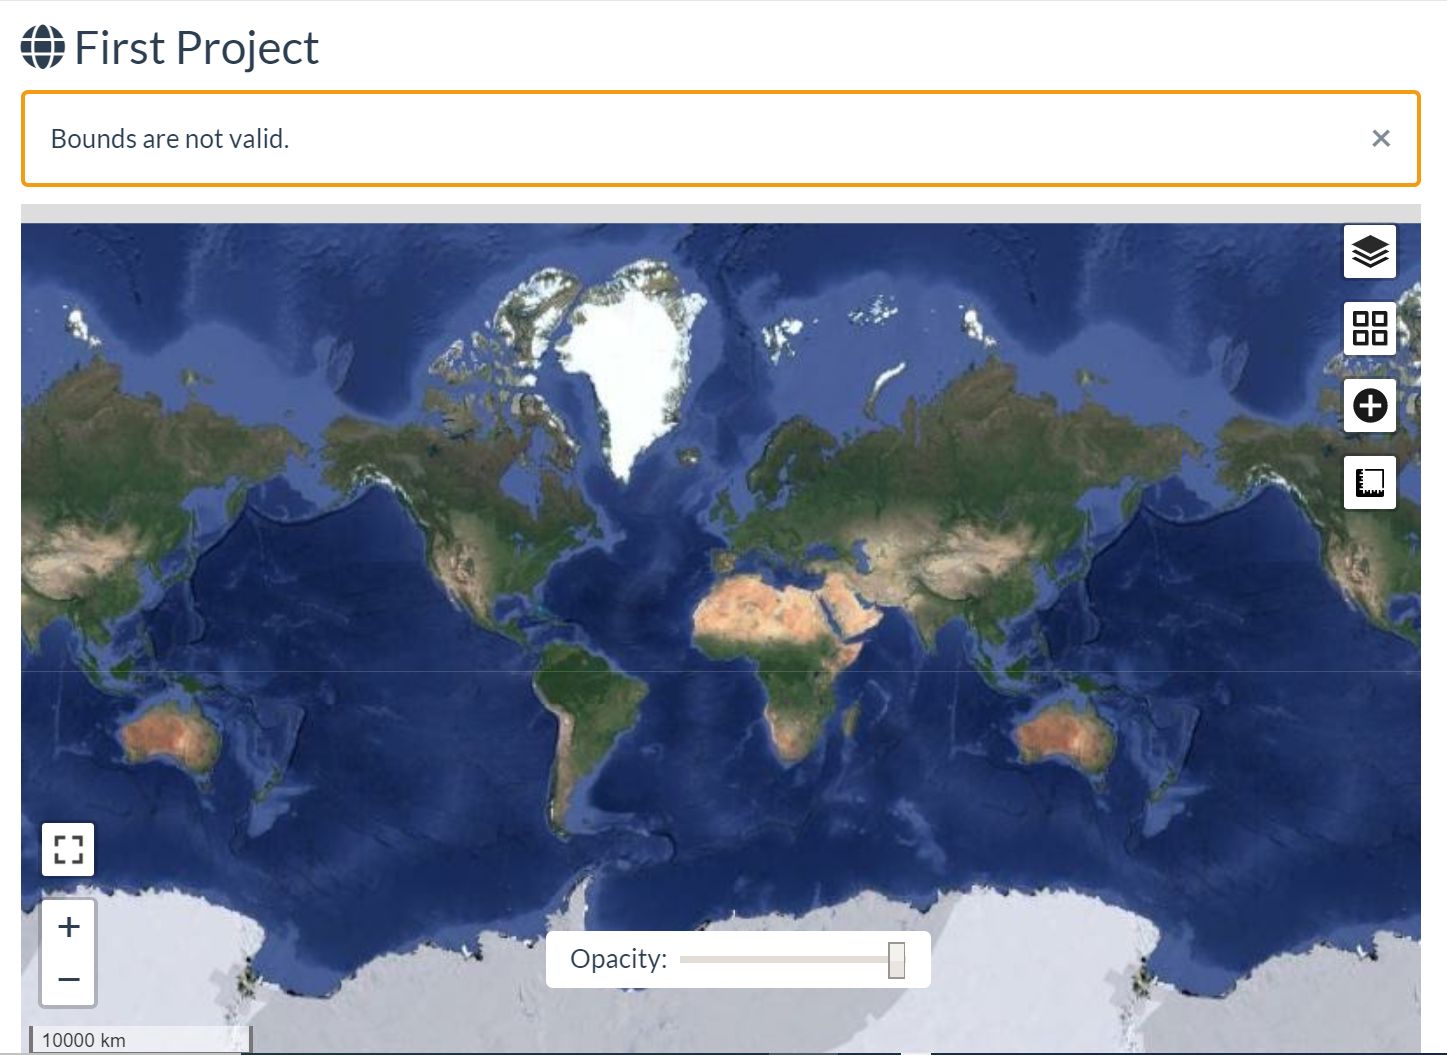
Credit: S. Patel, UF Department of Computer and Information Systems Engineering
Diagnostic
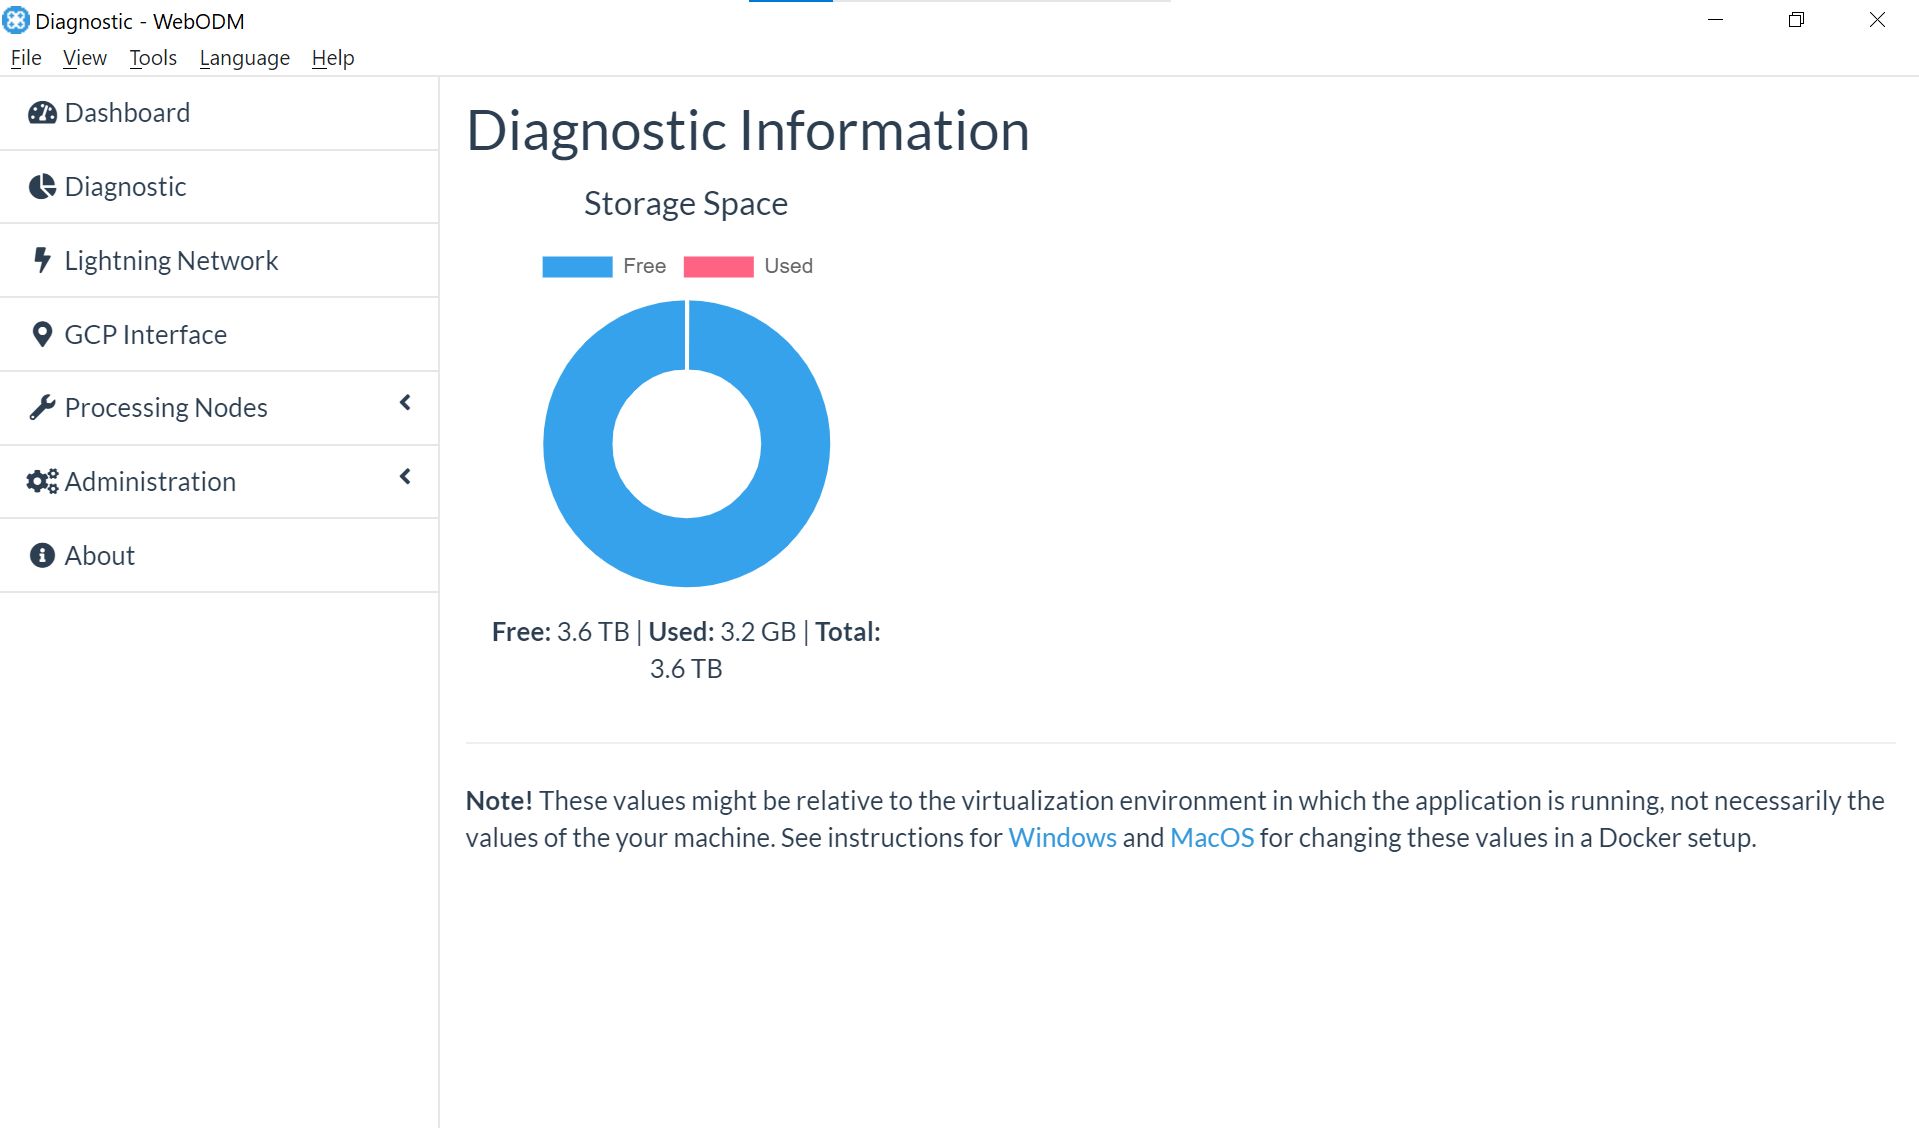
The "Diagnostics" tab visualizes the current free space available in the system that is running WebODM (Figure 3). This example shows a graphic that represents the Free and Used hard disk space. The note under the diagram is relevant to the Docker/manually-built versions of WebODM.
Credit: S. Patel, UF Department of Computer and Information Systems Engineering
Lightning Network
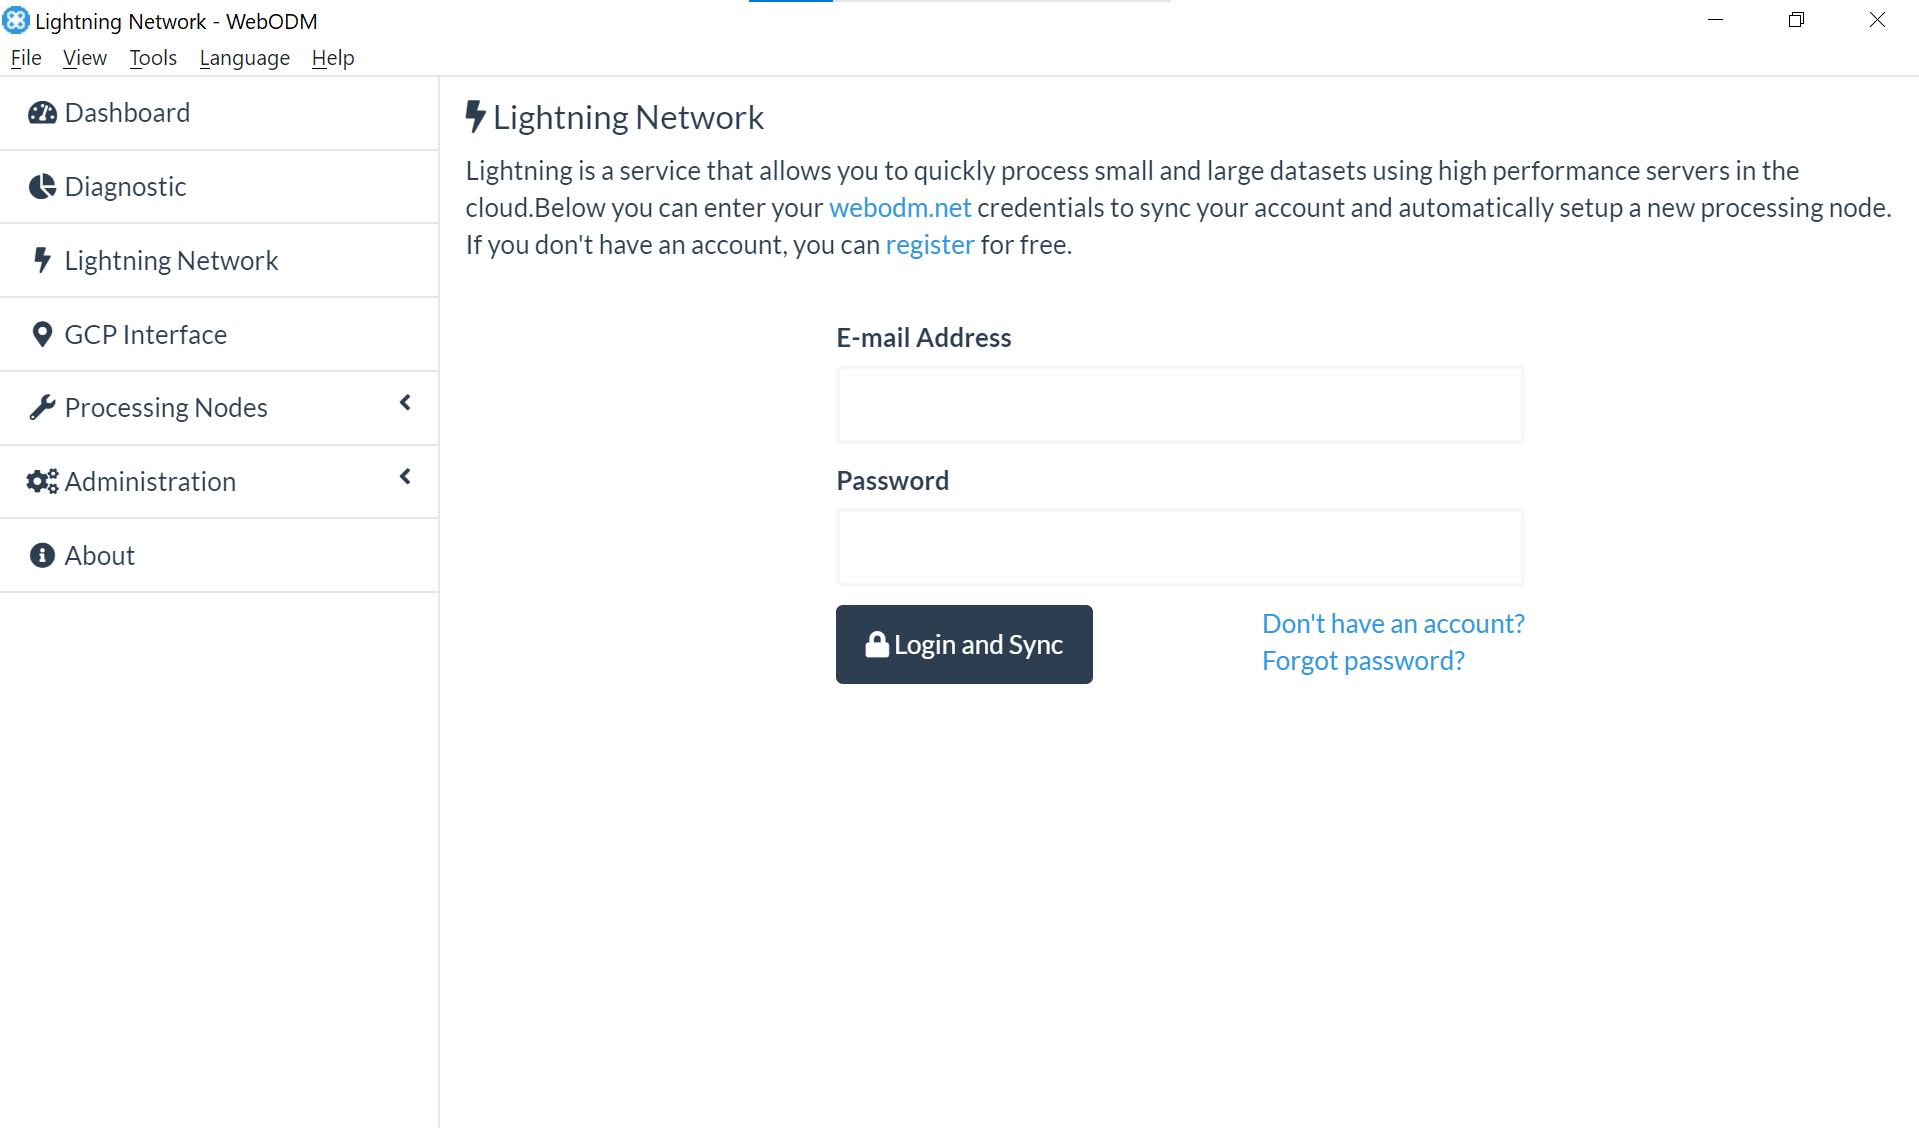
The "Lightning Network'' tab previews contents pertaining to using WebODM’s cloud computing service if the local system resources are inadequate to process a given dataset (Figure 4). If necessary, an account can be made at webodm.net for free.
Credit: S. Patel, UF Department of Computer and Information Systems Engineering
Processing Nodes
Credit: S. Patel, UF Department of Computer and Information Systems Engineering
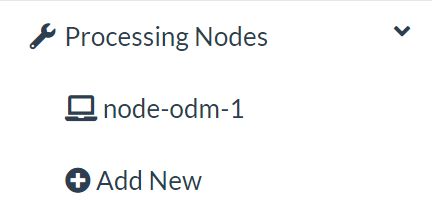
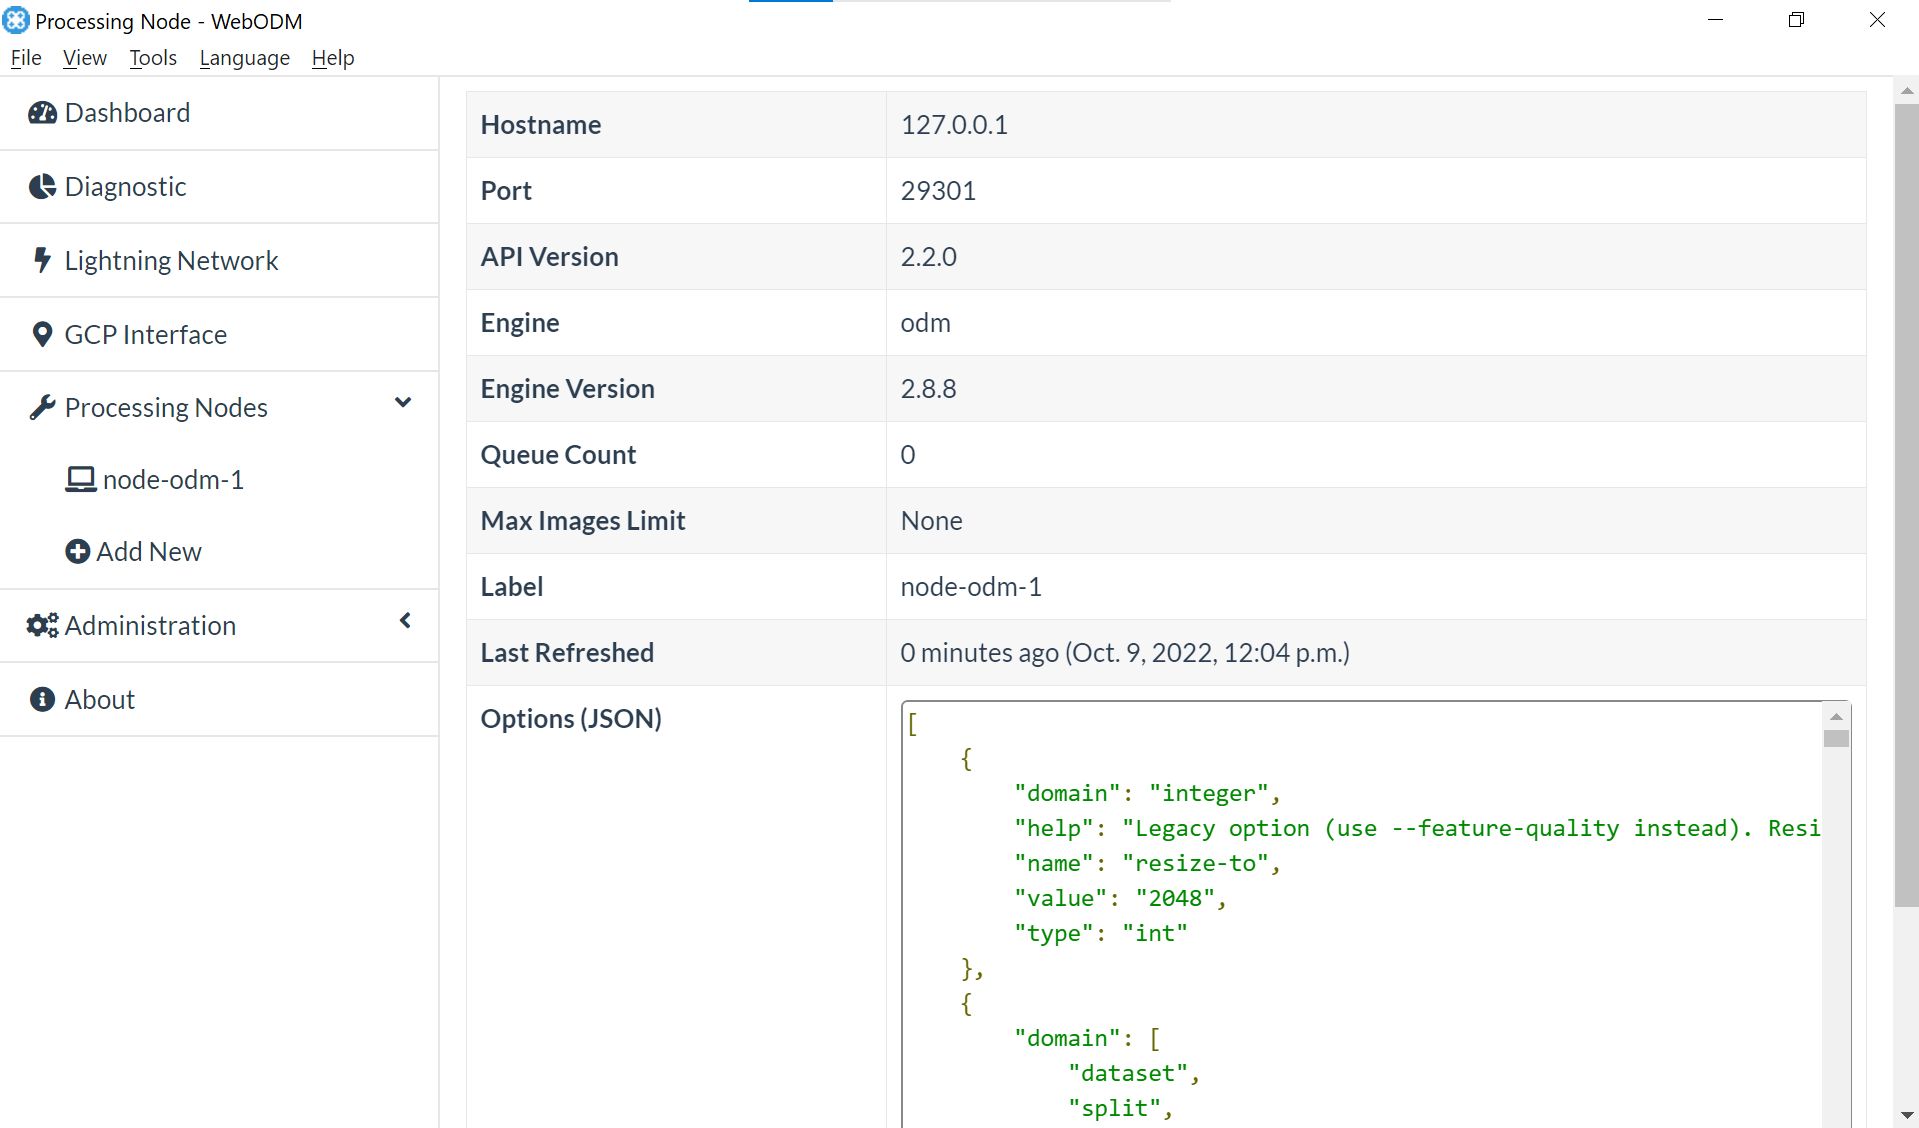
Figure 5a shows the dropdown options under the Processing Nodes tab. These nodes are dedicated and distributed compute resources that can be allocated to a given WebODM processing task. By using multiple processing nodes on separate machines, users can distribute the workload and process large datasets more efficiently. This tab presents the opportunity to edit the JSON configuration file. The “node-odm-1” option is the default WebODM processing node.
Credit: S. Patel, UF Department of Computer and Information Systems Engineering
Using WebODM to Mosaic UAV Imagery
Input Formats
WebODM supports a wide variety of image formats which is best summed up as JPGs and TIFFs (8-bit and 16-bit), with or without EXIF data. Images with EXIF data include sensor information, altitude, and GPS coordinates for WebODM to generate outputs properly. In the absence of EXIF data, ground control points (GCP) can be used as a replacement to provide geospatial information for the necessary photogrammetry. The GCP data can be specified in a .json format as defined in the WebODM documentation: https://github.com/mapillary/OpenSfM/blob/main/doc/source/gcp.rst.
Output Options
WebODM generates a variety of output formats for the processed data including orthophotos, surface models, point clouds, textured models, camera parameters, camera shots, and a quality report.
Orthophoto
The orthophoto output formats are as follows:
GeoTIFF (Raw)
GeoTIFF (RGB)
JPEG (RGB)
PNG (RGB)
KMZ (RGB)
Surface Model
The surface model output formats are as follows:
GeoTIFF (Raw)
GeoTIFF (RGB)
JPEG (RGB)
PNG (RGB)
KMZ (RGB)
Point Cloud
The point cloud output formats are as follows:
LAZ
LAS
PLY
CSV
Instructions
- On the dashboard tab, the “Select Images and GCP” button under the desired Project group is clicked in order to select the data for processing. For the purposes of this example, a sample RGB dataset of a field is selected.
Credit: S. Patel, UF Department of Computer and Information Systems Engineering
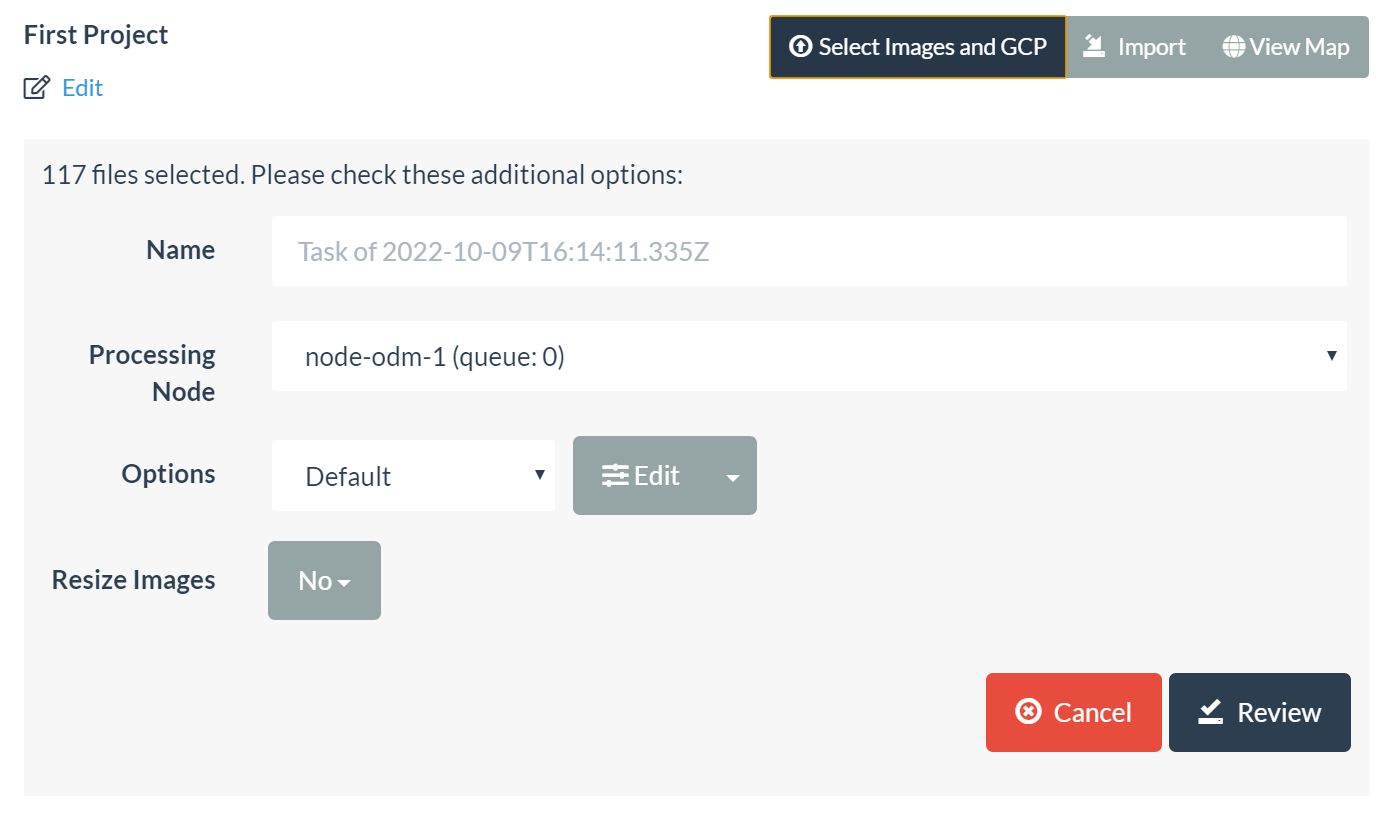
2. The UI will present some configuration options for data processing. First, there is the option to assign a name for the processing task. Next, the processing node can be selected in the designated dropdown. For the purposes outlined here, “node-odm-1” will be used. The options dropdown box contains output options for specifying the desired output data.
Credit: S. Patel, UF Department of Computer and Information Systems Engineering
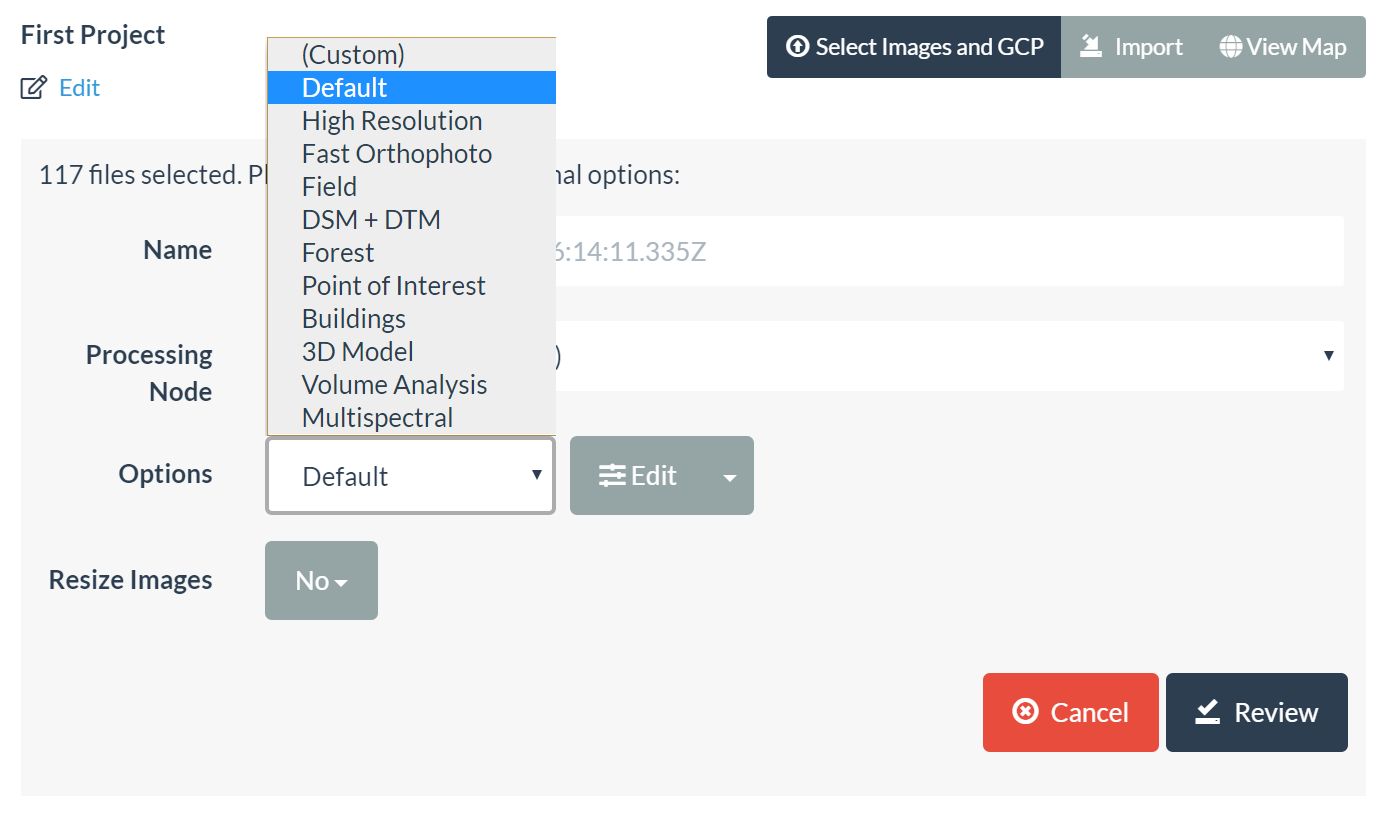
3. The default setting generates all available data, but a specific operation can be specified in the dropdown, as shown in Figure 7b.
Credit: S. Patel, UF Department of Computer and Information Systems Engineering
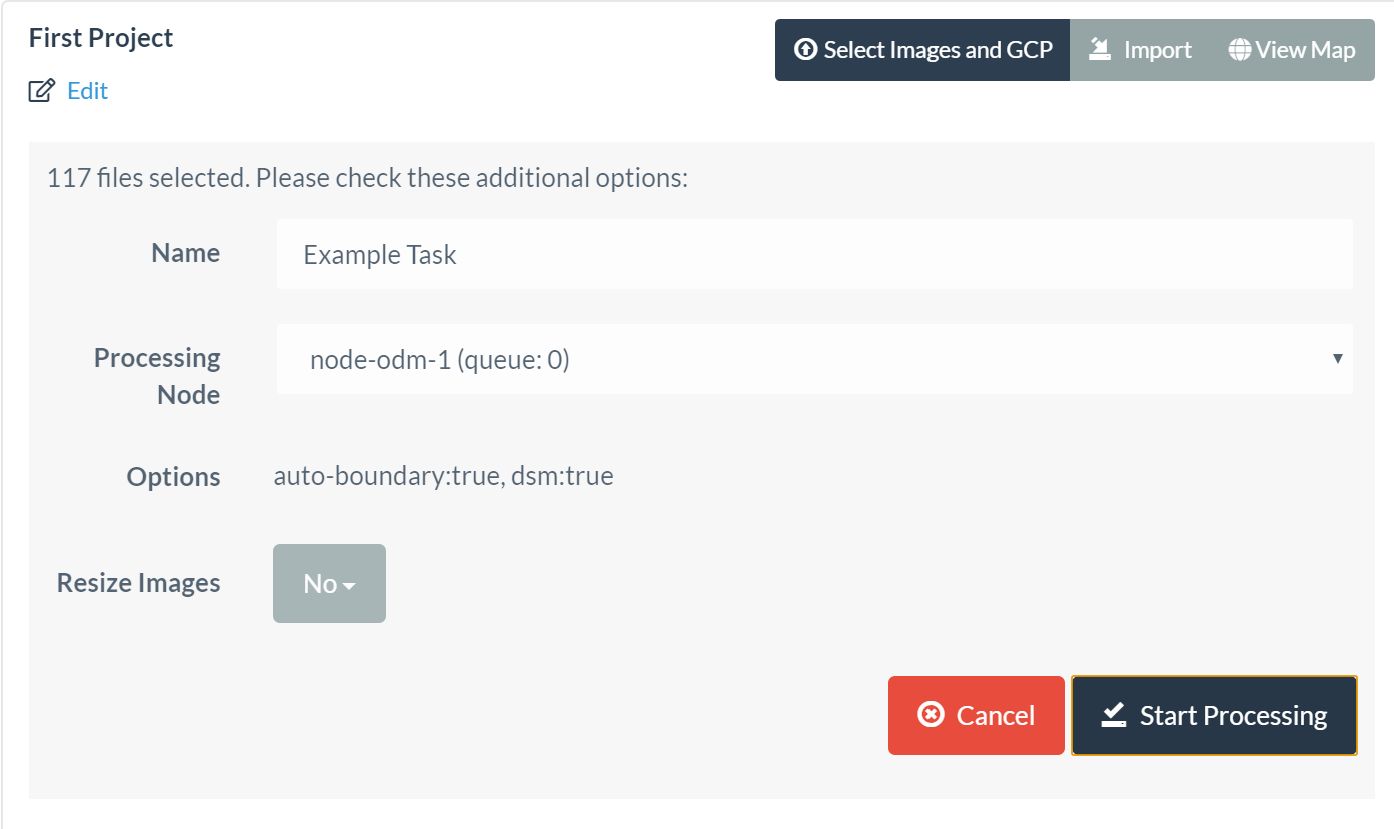
4. The “Resize Images” option resampled the image to fit within a user-defined resolution. For the purposes of this example, this option will be set as “No,” because resizing the UAV-captured data may negatively affect the accuracy and resolution of the output. The “Review” button must be clicked to move on, and a “Start Processing” button will show up. After selecting that button, processing will begin.
Credit: S. Patel, UF Department of Computer and Information Systems Engineering
Initially, WebODM will upload the data to the desired processing node, as shown in Figure 9.

Credit: S. Patel, UF Department of Computer and Information Systems Engineering
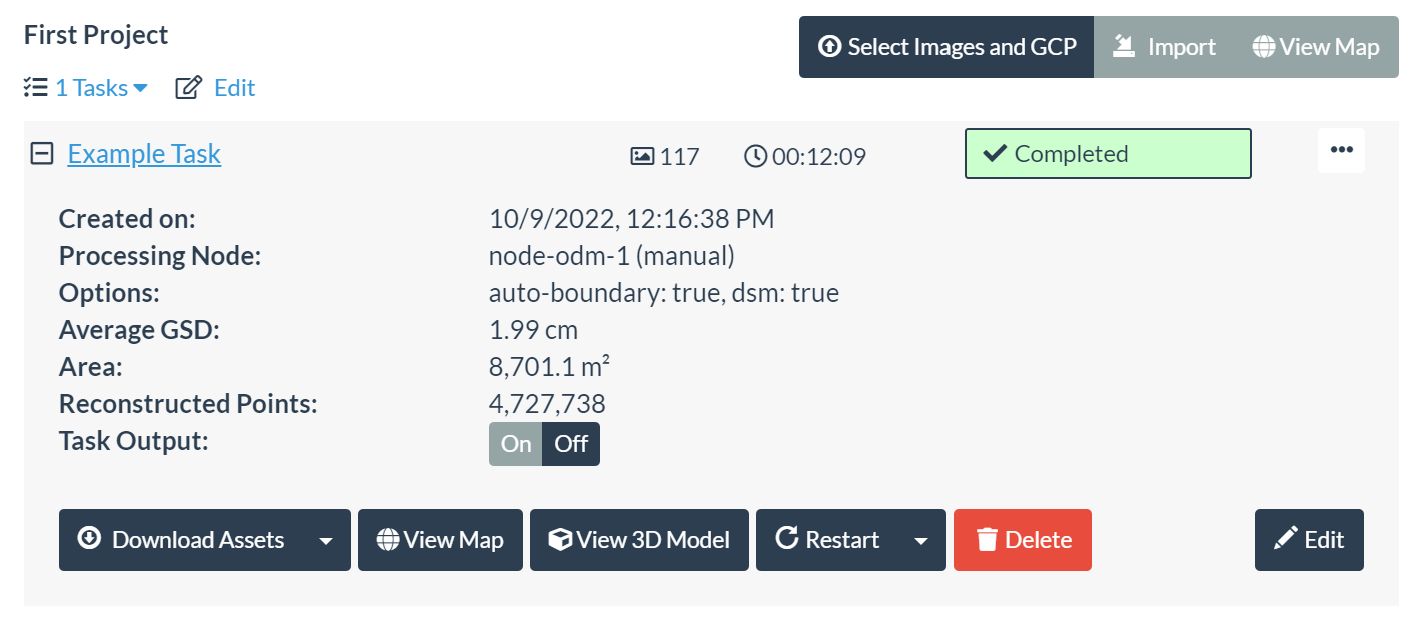
5. Further processing will promptly begin upon the completion of the upload. Figure 10b shows a completed task. Figure 10c is the expanded view of the computed results.

Credit: S. Patel, UF Department of Computer and Information Systems Engineering

Credit: S. Patel, UF Department of Computer and Information Systems Engineering
Credit: S. Patel, UF Department of Computer and Information Systems Engineering
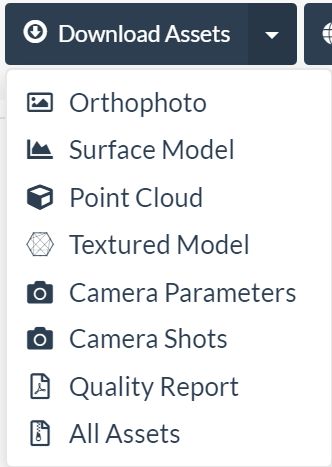
6. Here, a few key options are explored to handle the computed and complete task. The “Download Assets” button allows downloading all the generated results, as specified by the task parameters. The dropdown options are the individual computed results, such as the orthophoto, surface model, point cloud, texture model, camera parameters, camera shots, and quality report. There is an option to download all results as a .zip file.
Credit: S. Patel, UF Department of Computer and Information Systems Engineering
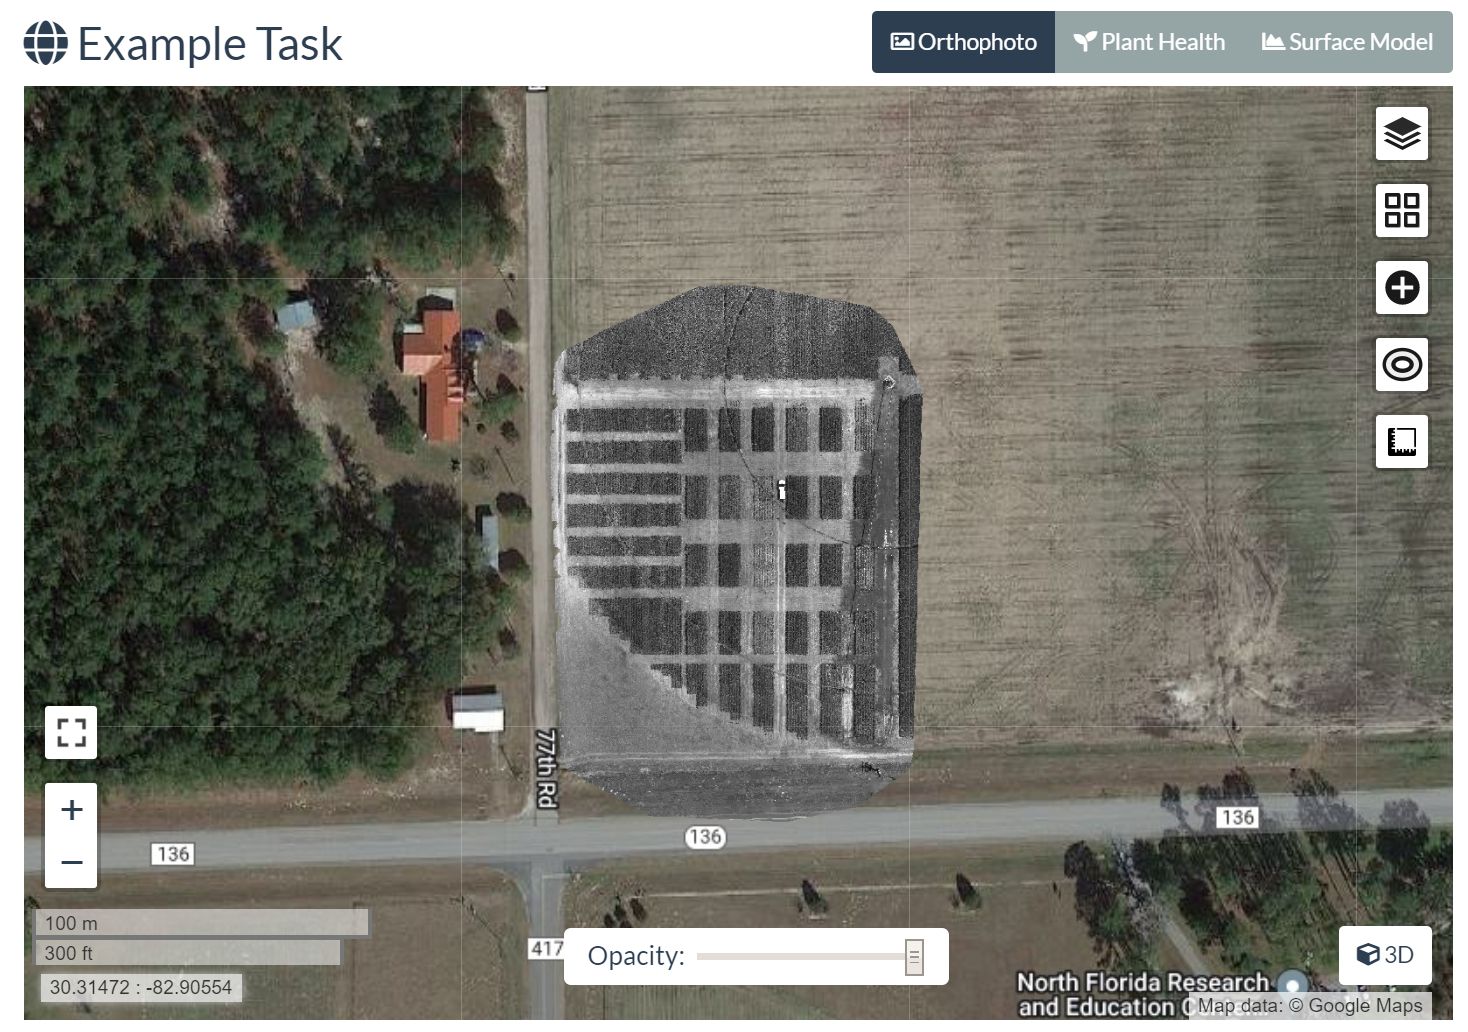
The “View Map” button shows the resulting orthophoto mosaic displayed with corresponding geographic coordinates. As shown in Figure 12a, measuring and visualization option tools can be used.
Credit: S. Patel, UF Department of Computer and Information Systems Engineering
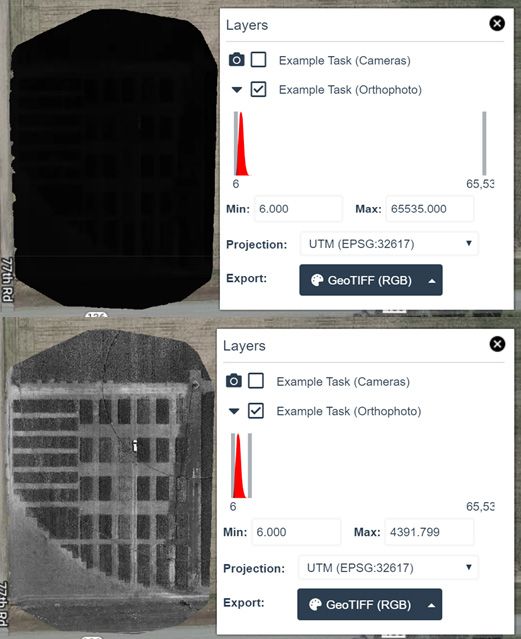
7. The 2D visualization may appear as a dark or otherwise mostly black projection. In the layers setting at the top right of the Map window, changes can be made to improve the appearance of the visualization. Depending on the input data, the range selector under the “Example Task (Orthophoto)” checkbox can be modified to best fit the input data based on the hue and saturation, sharpness, highlights, and shadows (Agarwal 2021). Adjustments can be made by dragging the light-gray vertical bars to achieve the desired range. Figure 12b shows the results of adjusting these color settings.
Credit: S. Patel, UF Department of Computer and Information Systems Engineering
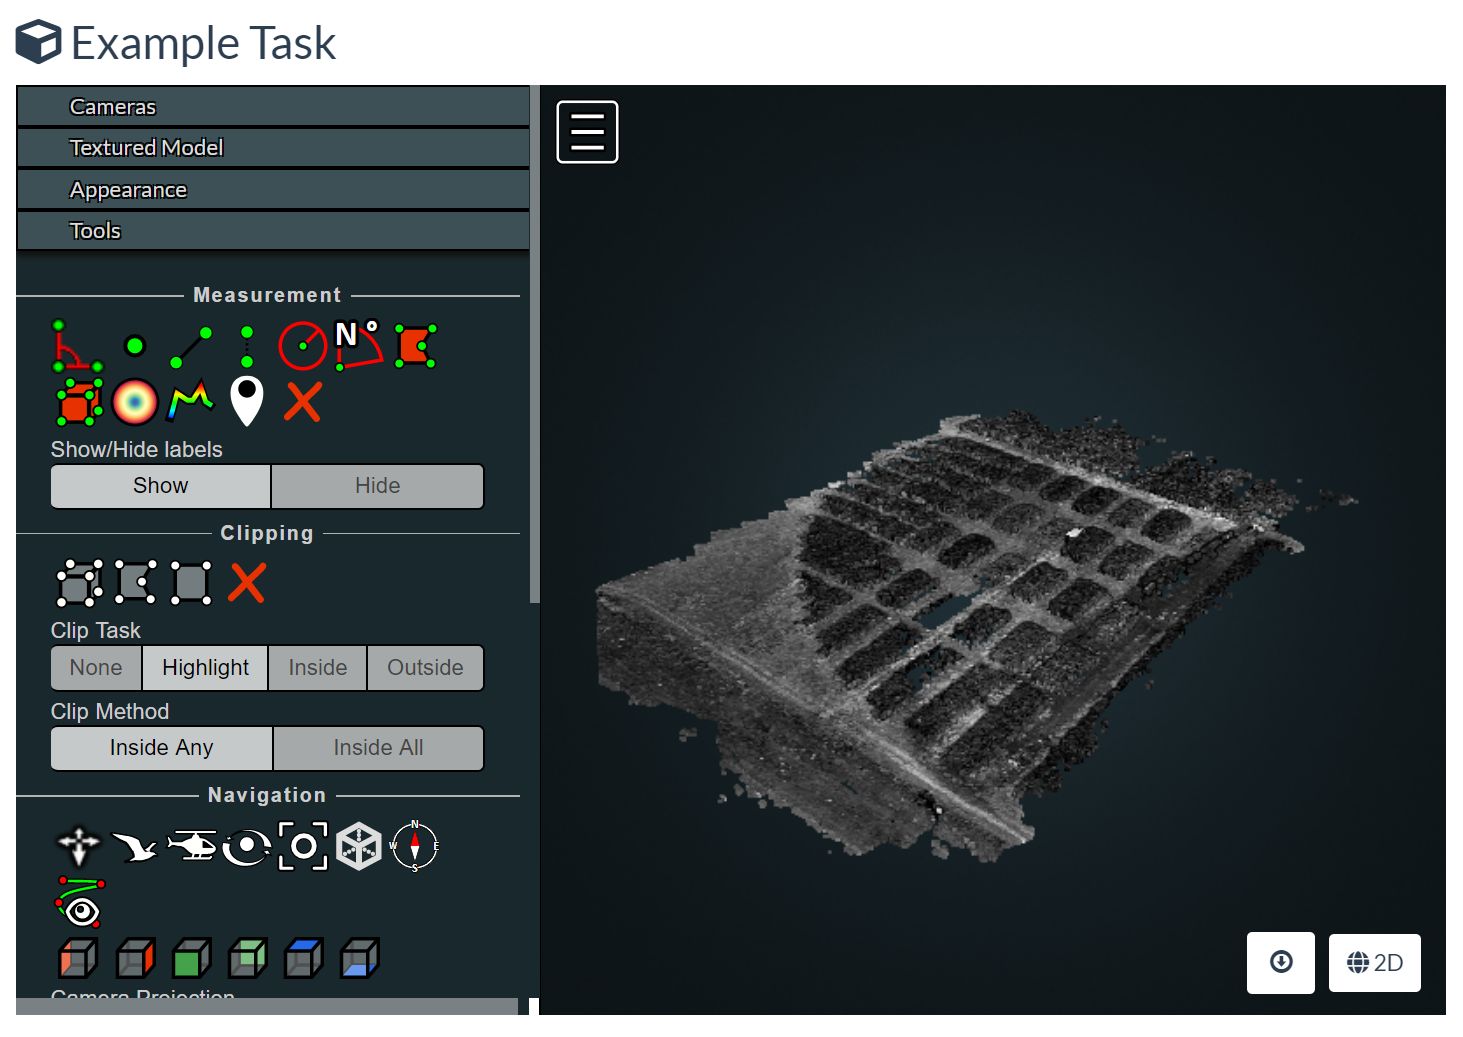
8. Next is the "View 3D Model" button, which allows for a 3D visualization of the generated results. Robust measurement and visualization settings can help verify and observe the generated results in this mode. Figure 13 highlights the interface for this option. Further details on this option can be found in the official API documentation (WebODM Dev Team 2023b). This example’s results reflect that the input data was just standard RGB imagery. However, the software can also support multispectral or infrared data.
Credit: S. Patel, UF Department of Computer and Information Systems Engineering
9. The final option except for the “Delete” button is the “Restart” button which reruns the processing task based on the desired parameters.
Additional Resources
While this publication provides a high-level introduction to WebODM, there are more in-depth repositories of documentation to provide more detailed information on what else this tool can do. The WebODM documentation, found at https://docs.webodm.org/, contains a detailed breakdown of the tool's individual features and use cases. Finally, Rich Charpentier’s YouTube video on the overview and quick start of WebODM serves as another source of guidance. This video can be found at https://www.youtube.com/watch?v=So3oE8ACbNY.
Readers can also learn more from additional Ask IFAS publications about potential applications of UASs (Fletcher and Singh 2020), UAS platforms and payloads (Singh and Fletcher 2021a), best practices for UAS-based aerial surveying (Singh and Fletcher 2021b), and utilizing the open-source Mission Planner software for planning and executing UAS missions (Chintanadilok et al. 2022).
References
3DSourced. 2023. “The top 10 best photogrammetry software 2023 (4 are free!).” https://www.3dsourced.com/3d-software/best-photogrammetry-software/
Agarwal, M. 2021. “How to Use WebODM: Orthophoto Map.” Accessed March 2023. https://blog.flykit.app/how-to-use-webodm-orthophoto-map/
Charpentier, R. 2022. “WebODM Revisited - Open Source Drone Mapping.” https://www.youtube.com/watch?v=So3oE8ACbNY
Chintanadilok, J., S. Patel, Y. Zhuang, and A. Singh. 2022. “Mission Planner: An Open-Source Alternative to Commercial Flight Planning Software for Unmanned Aerial Systems: AE576/AE576, 8/2022.” EDIS 2022(4). https://doi.org/10.32473/edis-ae576-2022
FAA. 2023. “Understanding Your Authority: Handling Sightings and Reports.” https://www.faa.gov/uas/public_safety_gov/sightings_reports
Fletcher, J., and A. Singh. 2020. “Applications of Unmanned Aerial Systems in Agricultural Operation Management: Part I: Overview: AE541/AE541, 6/2020.” EDIS 2020(6). https://doi.org/10.32473/edis-ae541-2020
OCWGIS. 2023. “Tutorial: WebODM.” Accessed February 2023. https://courses.gisopencourseware.org/mod/book/view.php?id=500
OpenDroneMap Dev Team. 2023. “Documentation.” https://www.opendronemap.org/docs/
Singh, A., and J. Fletcher. 2021a. “Applications of Unmanned Aerial Systems in Agricultural Operation Management: Part II: Platforms and Payloads: AE552/AE552, 02/2021.” EDIS 2021(1). https://doi.org/10.32473/edis-ae552-2021
Singh, A., and J. Fletcher. 2021b. “Applications of Unmanned Aerial Systems in Agricultural Operation Management: Part III: Best Practices for Efficient Aerial Surveying: AE553/AE553, 02/2021.” EDIS 2021(1). https://doi.org/10.32473/edis-ae553-2021
WebODM Dev Team. 2023a. Accessed March 2023. https://github.com/OpenDroneMap/WebODM
WebODM Dev Team. 2023b. “Introduction.” Accessed March 2023. https://docs.webodm.org/
WebODM Dev Team. 2023c. “WebODM Demo.” Accessed March 2023. https://demo.webodm.org/dashboard/