Market hogs shown at county and state fairs and other youth shows across the US are food animals. The endpoint value of that food animal is primarily based upon its carcass merit. The merit of a pork carcass is based upon three variables: animal or carcass weight, quality of lean, and quantity of lean.
Most packers want pork carcasses that range from 170 to 225 pounds from pigs weighing approximately 230 to 300 pounds. Carcasses that weigh less than 170 pounds are less profitable for most packers due to the greater production costs per carcass weight. Carcasses over 225 pounds are more apt to generate retail cuts larger than what most consumers would prefer. Carcasses outside this weight range customarily receive a discounted price (NPPC 2000).
The rate at which muscle converts to meat during the establishment of rigor mortis has the most substantial influence on the consumer acceptability and further processing value of pork products (Kaufman et al. 1993). Unfortunately, reliable methods to evaluate muscle quality in the live animal are not available.
Slaughtering animals to evaluate lean quality, actual fat thickness, and loineye area from chilled carcasses are certainly the preferred method to assess carcass merit. However, if carcass data are not available, ultrasound evaluation of the live animal is an excellent method that can be used to predict fat thickness and loineye area (Moeller 2002).
What is the technician doing in Figure 1?
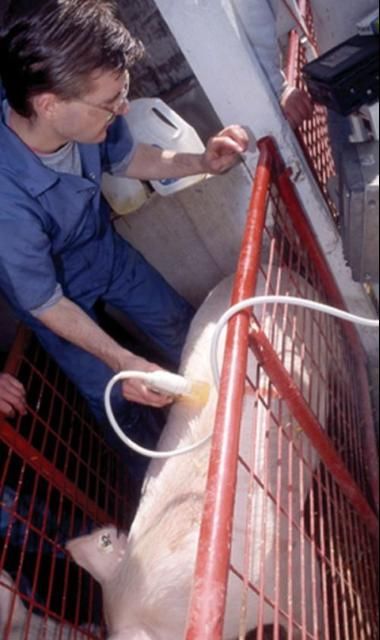
The technician is using ultrasound to assess how much external fat and muscle this market hog has by using a real-time ultrasound machine. The image is described as real-time because the ultrasound image is updated at high rates of speed, creating an image similar to a movie. Real-time machines (Figure 2) can be very accurate when used by properly trained technicians (Moeller 2002).

Credit: National Pork Producers Council (NPPC) (2000)
What does the image look like?
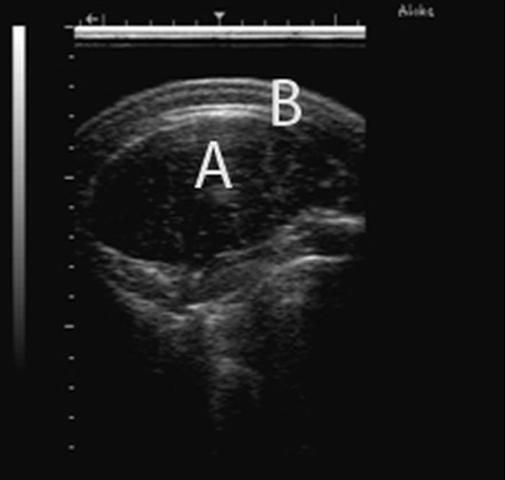
An example image is shown in Figure 2.
What is the technician measuring?
The technician is using the machine to measure the area of the loineye (A) and how much fat is deposited over the loineye (B) (Figure 3).
Credit: NPPC (2000)
Where is the technician measuring?
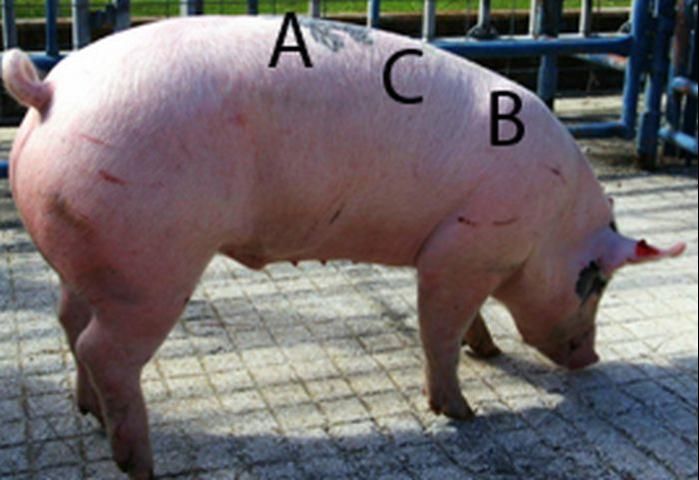
The ultrasound technician will find the last rib (A) and the elbow pocket (B) at approximately the 5th rib and will probe halfway between the locations and look at the image to ensure he is in the correct anatomical location (C) (Figure 4).
After the technician gets the image at the proper location, what does he do?
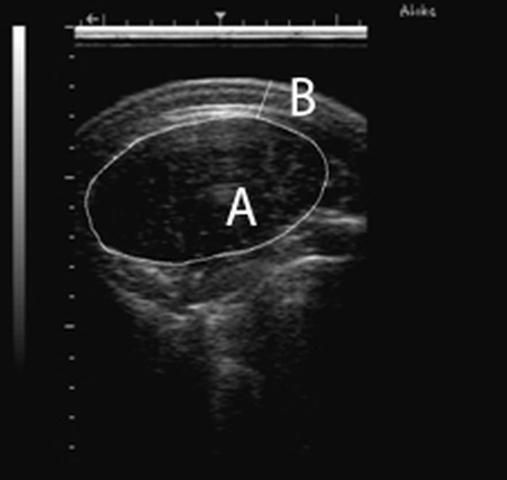
If the technician has collected a high-quality image, he will use the computer to trace the loineye (A) and fat thickness 3/4 of the distance from the middle of the pig (B) (Figure 5).
Credit: NPPC (2000)
Why is the technician measuring at that location?
That location has been found to be the best single location to predict the percentage of fat-free lean from the whole pig or carcass (Busk 1986).
How accurate are the ultrasound estimates to the actual carcass measurement?
Moeller and Christian (1998) reported the average difference in fat thickness and loineye area between the ultrasound measurement and the carcass measurement to be 0.11 in and 0.51 in2, respectively.
Generally, ultrasound estimates will tend to error toward the middle. Specifically, Moeller and Christian (1998) reported ultrasound measurements slightly overestimated (0.02 in) fat thickness on lean pigs (= 0.95 in backfat) and underestimated (0.04 to 0.12 in) fat thickness on fatter pigs (= 0.95 in backfat). The ultrasound measurements overestimated loineye area by 0.36 in2 when pigs had a small loineye (= 5.0 in2) and underestimated loineye area by 0.35 in2 for pigs with an actual loineye area = 6.0 in2.
Can marbling within the loineye be evaluated using ultrasound?
Yes, marbling (or intramuscular fat) can be predicted rather accurately. The ultrasound image (Figure 6) looks different because the probe is placed parallel to the spine along the loin muscle from the 10th to 13th rib, rather than perpendicular to the spine as when scanning for fat thickness and loineye area. The area within the box (A) is interpreted by a computer program to predict the percentage of intramuscular fat (Figure 6).
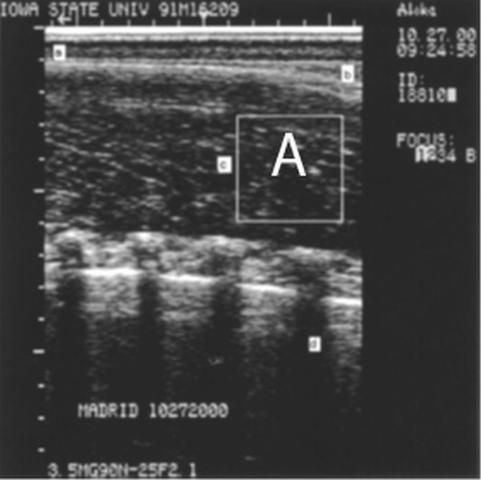
Credit: Modified from Newcom et al. (2002)
Why do ultrasound technicians at youth livestock shows not evaluate marbling of market hogs?
Currently, very few processors use marbling as a variable in price discovery for pork, but marbling is used for most all price discovery systems with beef.
How well do ultrasound images of fat thickness and loineye area replicate the actual carcass?
You can see for yourself with Figures 7 and 8.
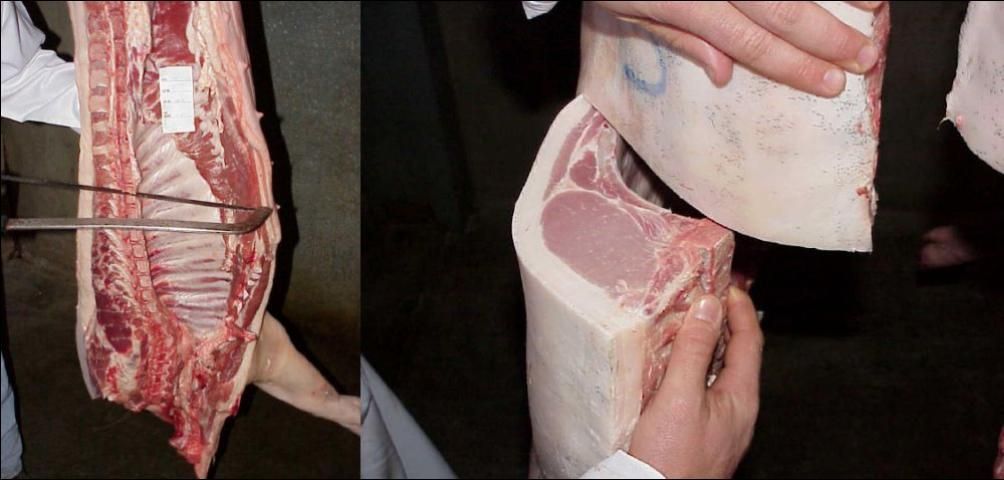
Credit: NPPC (2000)
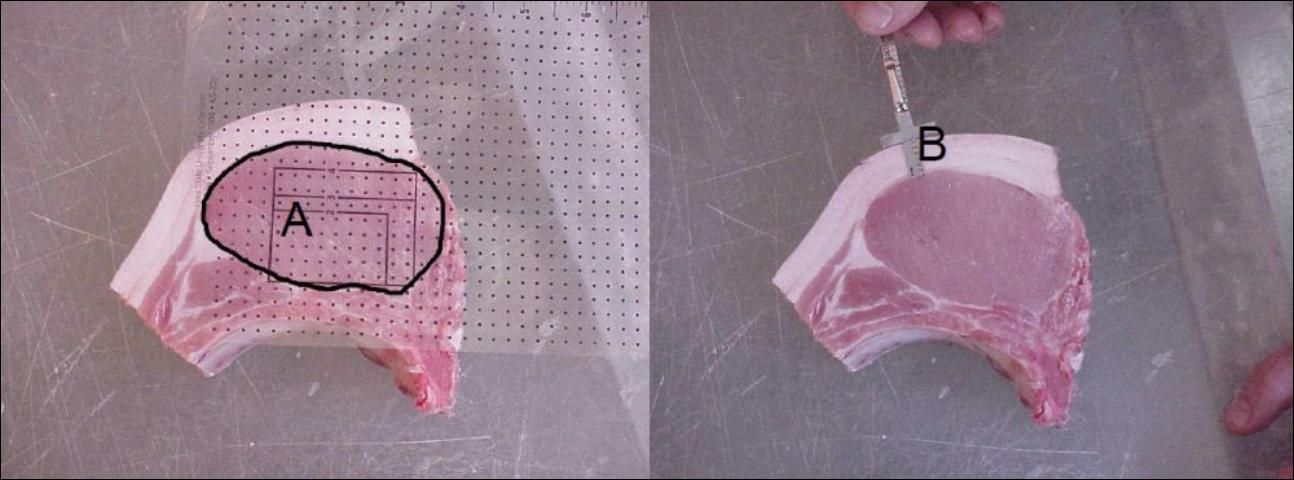
Credit: NPPC (2000)
What is the value in determining 10th rib loineye area and fat thickness?
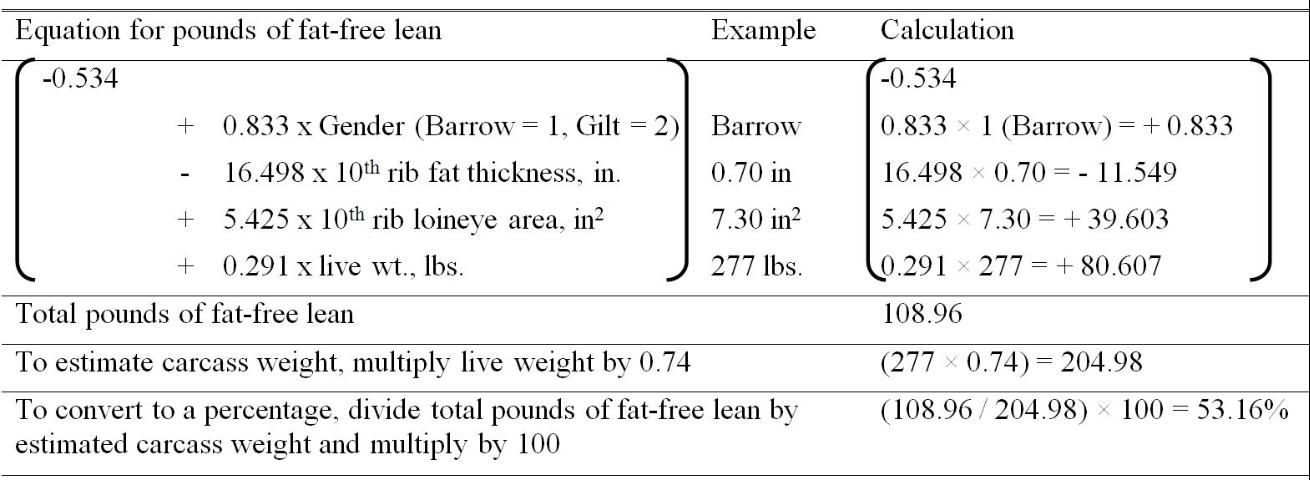
These values can be used with an estimated carcass weight in a prediction equation to make an estimate of what percentage of fat-free lean a market hog should generate (Table 1; NPPC 2000).
What does percentage of fat-free lean predict?
The equation predicts exactly what it states, the carcass' weight comprised of fat-free pork. As fat thickness increases, percent lean decreases; as loineye area increases, percent lean increases; and as carcass weight increases, percent lean decreases. A shortcut approximation of the full prediction equation using live weight is shown in Table 2. Note—only the equation in Table 1 should be used to determine placing for ultrasound contests.
Is percentage of fat-free lean the same as a US grade?
No. US grade of live market hogs or carcasses is evaluated by evaluating last rib fat thickness at the midline of the animal or carcass (Figure 9) and a subjective muscle score (Figure 10). US grades range from 1 to 4 and predict the percentage of closely trimmed ham, loin, Boston-butt, and picnic shoulder (USDA 1985). US grade is calculated by [(4 × last rib fat thickness)—subjective muscle score].
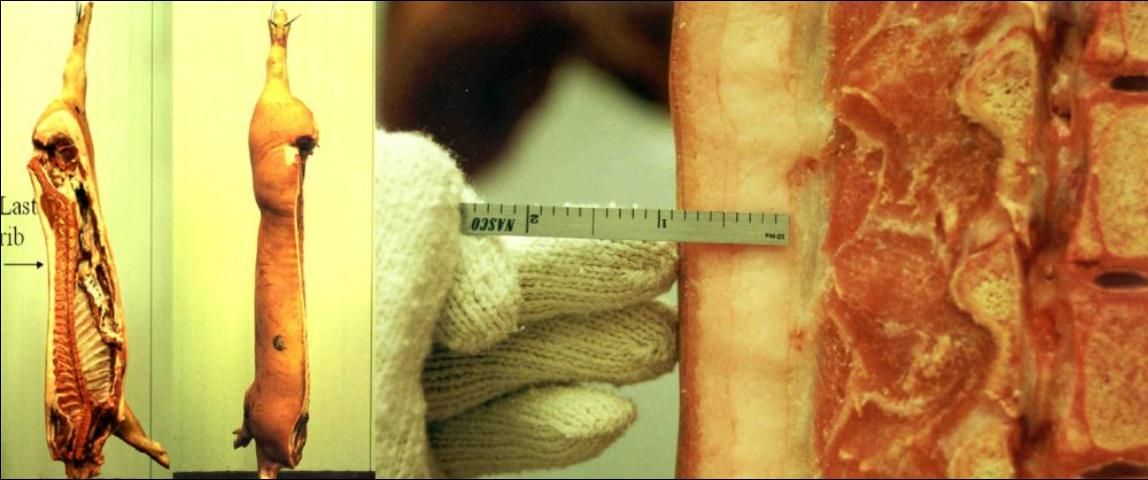
Credit: American Meat Science Association (AMSA) (2001)
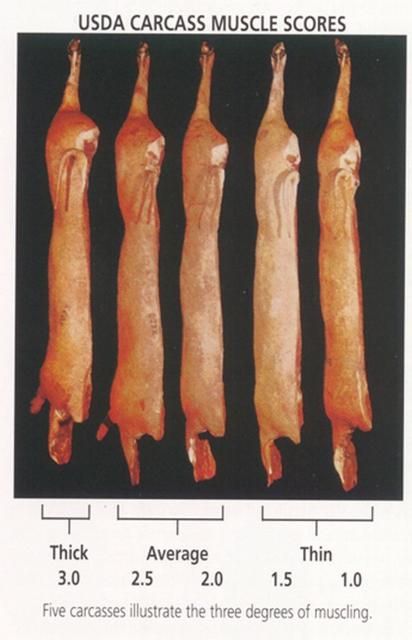
Credit: American Meat Science Association (AMSA) (2001)
The percentage of fat-free lean equation is more accurate at distinguishing differences in meat yield than the U.S. grade equation. This is especially true within the range of U.S. #1 market hogs (AMSA 2001).
Can last rib fat thickness be evaluated using ultrasound?
Yes, very accurately.
What is the percentage of fat-free lean calculation used for?
Almost all market hogs are sold on a carcass merit system using carcass weight and some estimate of percent fat-free lean.
So is the heaviest-weight, leanest, and heaviest-muscled carcass always the best?
Heavy-weight, lean, and heavily-muscled carcasses are certainly preferred over light-weight, fat, and light-muscled carcasses, but that doesn't mean that pigs with carcass merit extremes are best.
As discussed previously, carcasses can be both too heavy and too light. Pigs that are exceptionally heavy muscled will generate retail cuts larger than what most consumers would prefer. Also, these very heavy muscled pigs are generally more prone to stress and lean quality problems (Oksbjerg et al. 2000; Lonergan et al. 2001). A carcass with less than 0.40 inches of 10th rib fat thickness is likely to produce a belly too thin for quality bacon production (Cannon et al. 1995; Person et al. 2005).
Unfortunately, a larger percentage of exhibited youth pigs exhibit carcass merit extremes compared with commercial market hogs.
Conclusion
Ideally, carcass merit would be assessed from actual carcasses. Ultrasound evaluation of market hogs is an excellent method to accurately assess differences in fat thickness and loineye area when carcass data cannot be collected.

Literature Cited
AMSA. 2001. Meat Evaluation Handbook. American Society of Animal Science. Savoy, IL.
Busk, H. 1986. "Testing of five ultrasonic equipments for measuring of carcass quality on live pigs". World Rev. Anim. Prod. 22:55–65.
Cannon, J. E., J. B. Morgan, F. K. McKeith, G. C. Smith, and D. L. Meeker. 1995. "Pork quality audit: A review of the factors influencing pork quality". J. Muscle Foods. 6:369–402.
Kauffman, R. G., W. Sybesma, F. J. M. Smulders, G. Eikelenboom, B. Engel, R. L. Van Laack, A. H. Hoving-Bolink, P. Sterrenburg, E. V. Nordheim, P. Walstra, and P. G. van der Wal. 1993. "The effectiveness of examining early post-mortem musculature to predict ultimate pork quality". Meat Sci. 34: 283–300.
Lonergan, S. M., E. Huff-Lonergan, L. J. Rowe, D. L. Kuhlers, and S. B. Jungs. 2001. "Selection for lean growth efficiency in Duroc pigs influences pork quality". J. Anim. Sci. 79:2075–2085.
Moeller, S. J., and L. L. Christian. 1998. "Evaluation of the accuracy of real-time ultrasonic measurements of backfat and loin muscle area in swine using multiple statistical analysis procedures". J. Anim. Sci. 76:2503–2514.
Moeller, S. J. 2002. "Evolution and use of ultrasonic technology in the swine industry". J. Anim. Sci. 80:E19–E27.
Newcom, D. W., T. J. Baas, and J. F. Lampe. 2002. "Prediction of intramuscular fat percentage in live swine using real-time ultrasound". J. Anim. Sci. 80:3046–3052.
NPPC. 2000. Pork Composition and Quality Assessment Procedures. Natl. Pork Prod. Counc., Des Moines, IA.
Oksbjerg, N., J. S. Petersen, P. Sorensen, P. Henckel, M. Vestergaard, P. Ertbjerg, A. J. Moller, C. Bejerholm, and S. Stoier. 2000. "Long term changes in performance and meat quality of Danish Landrace pigs: a study on a current compared with an unimproved genotype". Anim. Sci. 71:81–92.
Person, R. C., D. R. McKenna, D. B. Griffin, F. K. McKeith, J. A. Scanga, K. E. Belk, G. C. Smith, and J. W. Savell. 2005. "Benchmarking value in the pork supply chain: Processing characteristics and consumer evaluations of pork bellies of different thicknesses when manufactured into bacon". Meat Sci. 70:121–131
USDA. 1985. Official United States Standard for Grades of Pork Carcasses. Title 7, Chapt. 1 Pt. 54, Sections 54.131–54.137 of the Code of Federal Regulations. Agricultural Marketing Service. Washington, D.C.