Introduction
This article presents the cost of production per acre for processed oranges in central Florida during 2015/16. The cost estimates below do not represent any individual operation. Instead, their purpose is to serve as a benchmark for the Florida citrus industry. Typical users of these estimates include growers, consultants, property appraisers, and researchers. By surveying growers regarding the costs of their caretaking programs, we ensured that the estimates reported in this article closely reflect growers' expenditures.
Data
The data were collected by mail in May 2016. Five growers participated in the survey. The questionnaire asked growers to provide annual, per-acre costs by program for a "typical" irrigated, mature grove (10+ years old), including resets.
The number of acres managed by the five growers' combined operations accounts for approximately 29,000 acres. The acreage for oranges in the central Florida region in 2015 was estimated at 137,154 (USDA-NASS 2015). Thus, the sample of growers represented 21% of the acreage devoted to oranges in that region. The estimates below were obtained by averaging the responses submitted by the group of participating growers.

Credit: USDA
Table 1 shows the costs of production by program. The estimates include both the cost of materials and the cost associated with their application. The total cost for weed management, which includes chemical and mechanical mowing as well as herbicides, was $228.24 per acre. At $489.99 per acre, foliar sprays were the largest expense in grove caretaking. Fertilizer was the second largest expense at $454.85 per acre. Citrus Health Management Areas (CHMA) sprays accounted for $34.49 per acre. The expense for pruning was $56.93 per acre, while that for irrigation was $208.74 per acre. Adding all the costs listed above, the cultural cost of growing oranges for processing during 2015/16 without tree replacement was $1,473.24 per acre.
Growers were also asked to provide details regarding their reset practices, including the number of trees replaced in their groves. On average, growers replaced eight trees per acre during 2015/16. The total cost of tree replacement, including tree removal, site preparation, and care of young trees for those eight trees was estimated at $390.83 per acre. Adding this cost yields a total production cost with tree replacement of $1,864.07 per acre.
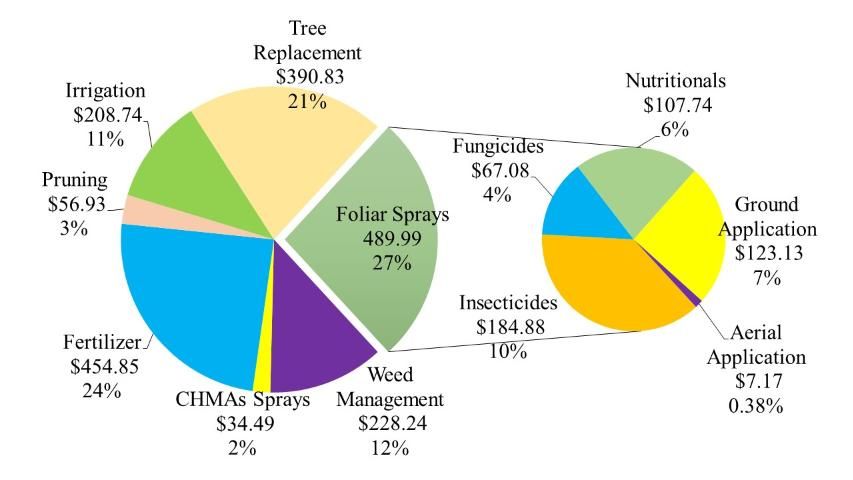
Figure 2 depicts a double pie chart. The larger pie shows the cost of each program as well as the percentage relative to the cultural production costs with tree replacement. The smaller pie in Figure 2 provides greater detail regarding the individual components included in the foliar spray category. The expense of $489.99 per acre was divided as follows: insecticides totaled $184.88 per acre, (representing 10% of the cultural cost of production); fungicides accounted for $67.08 per acre (4%); foliar nutritionals for $107.74 per acre (6%); aerial application for $7.17 per acre (0.4%); and ground application of materials for $123.13 per acre (7%).

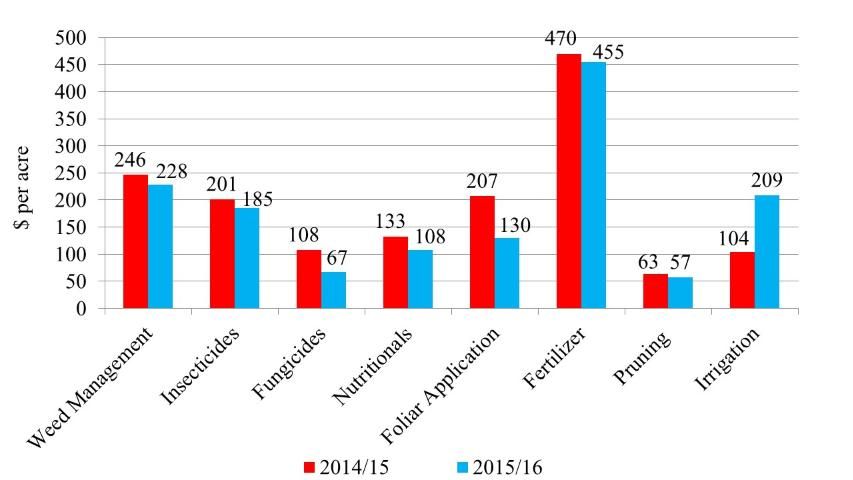
Figure 3 shows a comparison of the cost of the main production programs in 2015/16 relative to the previous season. The cost of the tree replacement program increased by the largest amount ($160). Such change is due to the increase in the number of replaced trees. On average, growers replaced 6 trees per acre in 2014/15 and 8 trees per acre in 2015/16. The largest reduction was in the application of foliar materials; growers spent, on average, $207 per acre in 2014/15 and $130 per acre in 2015/16. While all foliar program (fungicides, nutritionals, and insecticides) expenses decreased, irrigation expenses increased.

Table 2 shows the total costs growers incurred during 2015/16. That is, the cultural cost of production with tree replacement presented in Table 1 plus other costs such as management, regulatory, and opportunity costs. The total cost of production for processed oranges adds up to $2,235.76 per acre. Based on this estimate, the breakeven prices per box for different levels of yield are presented in Table 3. Breakeven prices were calculated on an on-tree and delivered-in basis. The latter assumes harvesting costs per box were $3.22, which is based on the results of the 2015/16 Picking, Roadsiding, and Hauling Charges for Florida Citrus survey (FE1005). The calculations in Table 3 also include the FDOC assessment of $0.23 per box for the 2015/16 season. Thus, for example, the on-tree and delivered-in breakeven prices for covering the total costs of production with yields at 250 boxes per acre were $1.53 and $2.11 per pound solids, respectively.
Summary
This article presents a summary of the 2015/16 costs of production for processed oranges in central Florida (Ridge). The methodology chosen to collect the data consisted of surveying growers directly to closely reflect growers' costs in the era of citrus greening (HLB). The total cost of production for processed oranges in central Florida in 2015/16 was $2,235.76 per acre, down $46.43 per acre from 2014/15.
References
United States Department of Agriculture, National Agricultural Statistics Service (USDA-NASS). 2015. Commercial Citrus Inventory: Preliminary Report. Florida Department of Agricultural Services, Maitland, FL.
Cultural costs of production per acre for processed oranges in central Florida (Ridge), 2015/16
Total costs of production per acre for processed oranges in central Florida (Ridge), 2015/16