Introduction
Drought conditions in the United States have brought water availability concerns into the forefront of consumers' minds. Household water usage and landscape irrigation play an important role in conserving and reducing water use. It has been estimated that 75% of residential water use is for outdoor purposes including landscape irrigation (Brehm et al. 2013). There are several techniques available to minimize water loss due to irrigation, including only irrigating when it is needed. Smart irrigation is a way to mitigate over irrigation because it uses plant, soil, and/or weather data to regulate irrigation (Irrigation Association, 2008). Smart irrigation technologies include soil moisture sensors (SMS) and evapotranspiration (ET) systems. SMS systems have sensors in the soil that transmit soil moisture information (either through wires or wireless technology) and prevent irrigating if there is adequate moisture in the soil (Dukes 2012). Conversely, ET systems obtain real-time meteorological conditions from weather sensors (either located on site or from local weather stations) and prevent the irrigation system from turning on when the atmospheric conditions are not appropriate (for instance, when it is raining [Dukes 2012]). Both SMS and ET systems have been shown to save a significant amount of water (Cárdenas-Lailhacar and Dukes 2012; Davis et al. 2009; Devitt et al. 2008). Despite these advantages, smart irrigation is a fairly new technology, and consumer acceptance and preferences for smart irrigation are not well understood. This study's goal was to address this knowledge gap.
This report is of particular importance to the smart irrigation industry and water policy makers. Results can aid in determining key attributes and barriers when it comes to consumers' purchasing behavior and adoption of smart irrigation technologies.
Methods
To analyze homeowners' preferences for smart irrigation systems and features, an online survey was developed and administered to homeowners in California, Texas, and Florida in May 2014. California, Texas, and Florida were selected because of water availability concerns in those areas (EPA 2008). The survey was designed to assess consumer perceptions of smart irrigation technologies, including important features, benefits, preferences, purchase likelihood, and reasons they are unlikely to purchase a smart irrigation system. In addition to the survey, a choice experiment was performed to determine the impact of different system attributes on consumers' purchasing behavior. For the choice experiment, respondents were given definitions of the two types of smart irrigation systems (SMS and ET) as well as basic information about how they function. The choice experiment included 6 scenarios where respondents were asked to select choice A, B, or neither. Each choice option included a set of predetermined attributes from the list provided in Table 1. The choice experiment results allowed researchers to assess consumer preferences and willingness-to-pay for various attributes.
Results
Sample Summary
Three thousand people participated in the study, with an equal number of respondents living in California, Texas, and Florida. The majority of participants were female (63%), less than 54 years old (66%), and living in urban/suburban areas (82%). The average household size was two adults and no children living at home. Seventy percent of respondents' 2013 household income was less than $100,000. The majority (58%) of respondents were employed with 19% being retired, 13% unemployed, 9% self-employed, 9% part-time employed, 6% students, and 4% "none of the above."
Smart Irrigation Benefits and Purchase Likelihood
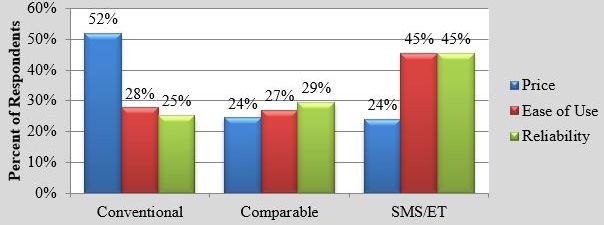
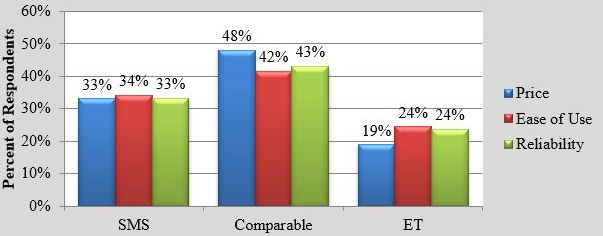
Study participants rated the benefits of smart irrigation systems when compared to conventional systems; 52% of respondents indicated that conventional systems were better priced, whereas 24% indicated that conventional and smart systems were comparably priced or smart systems were better priced (Figure 1). However, many respondents (45%) indicated that smart systems were easier to use than conventional systems (28%), while only 27% thought the two systems were comparable. Similarly, 45% perceived smart systems as more reliable, 25% thought conventional systems were more reliable, and 29% indicated they were comparable for reliability. When comparing the two types of smart systems directly, many respondents thought the SMS and ET systems were comparable in terms of price (48%), ease of use (42%), and reliability (43%) (Figure 2). However, when the comparable option is ignored, many respondents viewed the SMS technology as superior to the ET technology for price (33%), ease of use (34%), and reliability (33%).
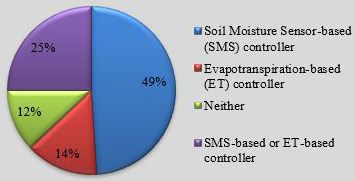
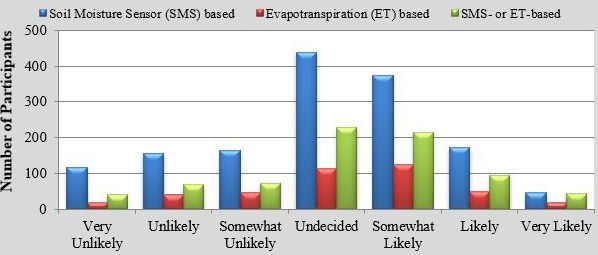
When asked which type of smart irrigation system was better suited for their needs, many respondents (49%) indicated the SMS system, followed by either SMS or ET system (25%), ET (14%), and neither (12%) (Figure 3). However, when asked their likelihood of purchasing their preferred system in the next 5 years, many consumers were undecided (Figure 4). Regarding the SMS system, 41% were "likely" (including "somewhat likely," "likely," and "very likely") to purchase the SMS system while 30% were undecided, and 30% were "unlikely" (e.g., "somewhat unlikely," "unlikely," and "very unlikely"). ET system results showed 46% were "likely," 27% undecided, and 26% were "unlikely." Regarding their purchase likelihood for either the SMS or ET systems, 46% were "likely," 30% were undecided, and 24% were "unlikely."
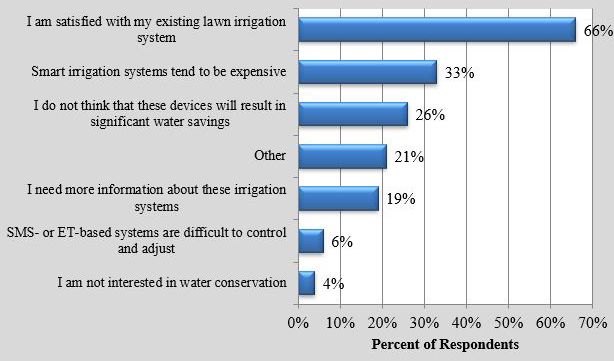
In addition to the previous questions, the 12% of homeowners who selected "neither" in Figure 3 were asked to indicate why they were not likely to purchase smart irrigation system in the next 5 years. Most (66%) indicated they were satisfied with their current irrigation systems (Figure 5). Respondents were also concerned about the cost (33%), actual water savings of smart systems (26%), or other (21%), or they needed more information (19%), found the system difficult to use (6%), or had low interest in water conservation (4%).
Choice Experiment Results
The overall choice experiment results indicated that as the cost of installation increased, consumers were less likely to choose that irrigation system. If the system had ET or SMS controllers, consumers were more likely to choose that option compared to the conventional timer system. The presence of a 25% rebate increased choice likelihood compared to no rebate. Water bill savings of 30% or 60% increased choice compared to a 10% savings. The site-specific operation attribute and failure alert feature also improved consumers' likelihood of choice.
The choice experiment results were used to estimate consumers' willingness-to-pay (WTP) values for different smart irrigation systems and their features. Respondents were willing to pay $313.36 more for SMS systems and $202.89 more for ET systems (Table 2). If the smart irrigation technology saved them 60% on their water bills, they were willing to pay $419.17 more while a system that saved them 30% obtained a $183.30 premium. They were willing to pay $25.89 for site-specific operations and $79.77 for an alert. The control and adjustment type were not significant.
Differences in WTP values were observed across the states (Table 2). Briefly, California homeowners had higher WTP values for water bill savings ($213.60 for the 30% savings and $472.89 for the 60% savings), site-specific operation ($36.45), and failure alert ($82.87). However, the premiums for the SMS and ET controllers were slightly lower than the rest of the sample. The Florida participants had higher premiums for the SMS and ET controllers ($349.63 for SMS and $256.66 for the ET controllers) while their WTP values were lower for the water bill savings, site-specific operation, and failure alert attributes. Lastly, the Texas homeowners' WTP values were in the middle for the controller types ($332.82 for SMS and $233.58 for the ET controllers), water bill savings, site-specific operation, and failure alert attributes.
Summary
Study respondents indicated that they perceive the two smart irrigation systems similarly; however, SMS systems were perceived as more favorable and suited respondents' needs better than the ET systems. Respondents who did not believe that the systems were suitable for their needs cited satisfaction with their current system, cost concerns, and skepticism about water savings as their primary reasons for not switching to smart irrigation systems. Approximately 46% of respondents were likely to purchase a smart irrigation system in the next 5 years, and many respondents were undecided. This is a great opportunity for the industry to highlight the benefits of smart irrigation systems and how they better meet consumers' needs (i.e., ease of use, reliability, peace of mind, convenience, etc.) Relatedly, the choice experiment results indicate consumers value smart irrigation technology. Primarily, consumers are interested in financial/cost-saving benefits (i.e., reduced water bills) and automatic alert features. These results are not surprising since the cost-saving measures can reduce the cost of initial investment. Promotions can be used to leverage how these systems save consumers money and conserve water at the same time.
References
Brehm, J. M., D. K. Pasko, and B. W. Eisenhauer. 2013. "Identifying key factors in homeowner's adoption of water quality best management practices." 52(1): 113–122. https://www.springer.com/journal/267
Cárdenas-Lailhacar, B., and M. D. Dukes. 2012. "Soil moisture sensor landscape irrigation controllers: Multi-study results and future implications." Transactions ASABE 55(2): 581–590. https://abe.ufl.edu/faculty/mdukes/pdf/publications/SW/SW9335_soil-moisture-sensor-review.pdf
Davis, S. L., M. D. Dukes, and G. L. Miller. 2009. "Landscape irrigation by evapotranspiration-based irrigation controllers under dry conditions in southwest Florida." Agric. Water Mgmt. 96(12): 1828–1836.
Devitt, D. A., K. Carstensen, and R. L. Morris. 2008. "Residential water savings associated with satellite-based ET irrigation controllers." J. Irrig. and Drain. Eng. 134(1): 74–82.
Dukes, M.D. 2012. "Water conservation potential of landscape irrigation smart controllers." Transactions ASABE 55(2): 563–569. https://abe.ufl.edu/faculty/mdukes/pdf/publications/SW/SW9331_water-conservation-potential-smart-controllers.pdf
Irrigation Association. 2008. Smart water application technology (SWAT) turf and landscape irrigation equipment testing protocol for climatologically based controllers: 8th draft. Falls Church, VA: Irrigation Association. Available at: www.irrigation.org. Accessed 15 October 2013.