Introduction
Millennials currently account for a quarter of the population in the United States, and many millennials have started to build families and become parents. Millennials are often targeted as a generation with large spending power. Many marketing programs have targeted millennials to enhance their purchases and often paid additional attention to millennial moms, as the primary shoppers in households. Research has also explored shopping behaviors and preferences of millennials to support promotion programs and develop effective messages targeting this generation.
Food and beverage products are considered "experience goods," a term that refers to a product that cannot be evaluated until it is consumed. Consumer preferences and purchases for food and beverages can be very product-specific and differ across consumer groups (Heng et al. 2018). Therefore, it is essential to understand the drivers of consumers' purchases for a specific food product. Moreover, although millennials have drawn much attention from the market, it remains a question if millennials behave significantly differently from any other generation in food consumption.
The orange juice industry has experienced dramatic changes in the past decades. While Florida production still dominates the US market, its production has declined from about 900 million gallons during the 2010–11 season to less than 400 million gallons during the 2018–19 season. The reduced supply is largely attributed to citrus greening and associated yield and acreage losses. The domestic share of Florida OJ has declined from nearly 90% during 2010–11 season to about half in the most recent seasons (Florida Department of Citrus [FDOC] 2019). Moreover, total presumed consumption of OJ decreased from 1.13 million gallons to less than 700 million gallons during this period (FDOC 2019).
To increase consumption of OJ, both the FDOC and individual OJ brands have developed multiple promotion and advertising programs. From a marketing perspective, some consumers can be targeted more effectively, leading to better sales and profits for the product. If these consumers share certain common characteristics, they can be grouped as a specific consumer segment and targeted for marketing and advertising purposes. Given the focus on millennials in marketing, a question is whether the millennial generation is similar to or differs from other generations in terms of purchasing and perceptions toward orange juice. To investigate this, we simulated the impacts of each generation on consumer demand for OJ. Our results aim to provide useful information for OJ marketing and advertising programs in the future.
Methods and Data
The University of Florida's Florida Agricultural Marketing Research Center (UF/FAMRC) has conducted a monthly tracker to measure orange juice consumption patterns. The survey was first launched in July 2016 and has been providing a sample of 500 respondents monthly, representing the US population. The target respondents are people at least 18 years of age who are the primary grocery shoppers for their households. As of December 2018, the database included over 15,000 household data points, of which 40% are baby boomers (age 55 or older), 27% are Generation X (age 38–54), 28% are millennials (age 25–37), and 5% are Generation Z (age 18–24). The OJ consumer tracker only collects data from shoppers who are at least 18 years old, which limits the representation of Generation Z. Also, to show the effects of being a parent, our survey identifies the population who currently live with children. As a result, our sample contains about 10% millennial moms and 8% millennial dads, as well as 10% Generation X moms and 4% Generation X dads.
The survey is divided into several sections to collect information including buying behavior, household demographics, and perception and attitudes. We compare these statistics across different generations between 2017 and 2018 in this study. Also, we calculate the total demand, which is a product of the number of US households (HH), market penetration (MP), and market intensity (MI). Market penetration represents the share of households that participate in the OJ market, and market intensity represents the quantity purchased for those that do consume. This total demand represents the current level of OJ demand. All these factors are collected from survey questions. To quantify the impact of generations on the total demand, we further create a demand index for each generation relative to the current level. For example, the demand index for generation i is a ratio of the simulated total demand assuming all consumers are from generation i to the total demand at current level. These results are presented in the next section.
Results
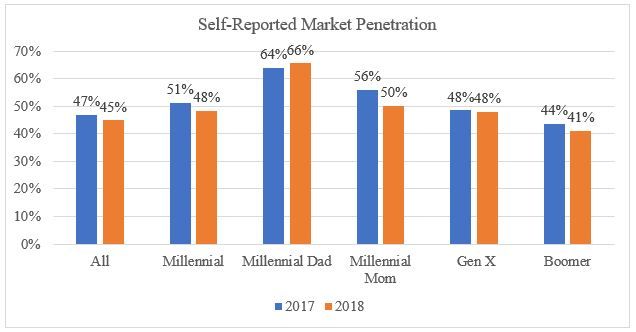
Regarding consumers' purchases of OJ, consumer self-reported market penetration is illustrated in Figure 1. Based on our sample, the average market penetration is 47% in 2017 and 45% in 2018, indicating about 47% and 45% of the overall survey population purchased OJ within the past 30 days in 2017 and 2018, respectively. Across different age groups, the millennial generation has a slightly higher market penetration with 51% in 2017 and 48% in 2018, compared to the average population. Generation X also tends to have a higher market penetration, while the boomer generation has a lower market penetration than average. Within the millennial generation, fathers reported a significantly higher percentage of market penetration compared to other groups, with 64% in 2017 and 66% in 2018.

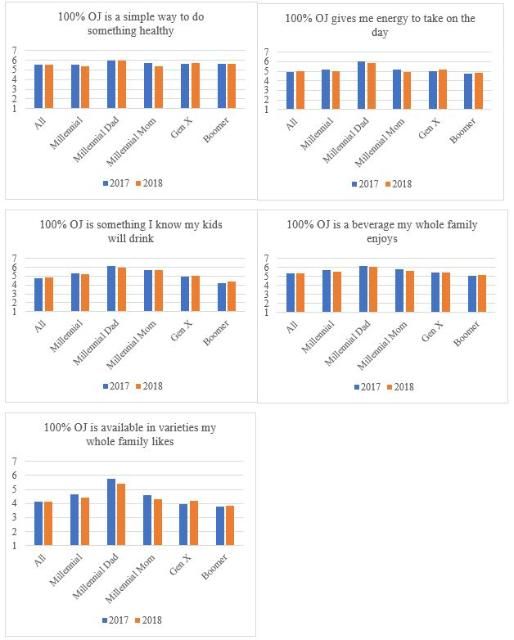
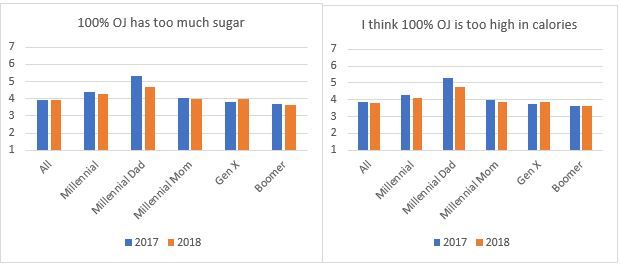
To measure their perceptions of OJ, we asked respondents to rate their level of agreement level with several statements about OJ on a 7-point scale (1=completely disagree, 7=completely agree). These statements included both positive and negative perceptions of OJ. For example, the positive statements include "100% OJ is a simple way to do something healthy;" "100% OJ gives me energy to take on the day;" "100% OJ is something I know my kids will drink;" "100% OJ is a beverage my whole family enjoys;" and "100% OJ is available in varieties my whole family likes." The negative statements include "100% OJ has too much sugar" and "I think 100% OJ is too high in calories." Previous research shows that the positive perceptions are a significant demand driver for OJ, while the negative perceptions have a negative impact on the OJ demand (Heng et al. 2019). The results on consumers' perceptions across generations are presented in Figure 2 and Figure 3. Overall, consumers' positive perception scores of OJ stay strong (close to 6 out of 7 on average), while their negative perception scores are relatively low (below 4 out of 7 on average). Interestingly, millennial dads have consistently rated both positive and negative statements higher compared to other groups. Our results indicate that millennial dads understand both the benefits and risks of consuming OJ, but the benefits surpass the concerns they have. This could be the reason why they report a higher market penetration than other groups.


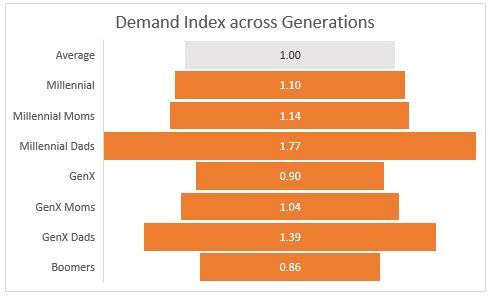
The demand indexes for each age group are displayed in Figure 4. As illustrated earlier, a demand index is represented as a ratio of the simulated total demand assuming all buyers are from a certain group to the current total demand level. The demand index at the average level is calculated by dividing the current demand level by itself, which is one. We can see that the demand index of the millennials is 1.10, which indicates that if all the consumers are millennials, OJ demand would increase by 10% through enhancing both market penetration and market intensity. Across consumer groups, millennial dads (1.77) and Generation X dads (1.39) have the strongest demand. The interpretations of these measures are millennial dads' demand for OJ is 1.77 times average, and Generation X dads' demand for OJ is 1.39 times average. Together, the millennials show a slightly stronger demand than Generation X and the boomer generation. Surprisingly, millennial dads and Generation X dads outperform their counterparts in terms of OJ purchases. However, we need to keep in mind that these groups only account for about 8% and 4% of the total sample, respectively.

Conclusions and an Implication
The millennial generation, especially millennial moms, are believed to have stronger buying power than other generations. We use a monthly tracker and examine the impact of different generations on OJ demand. Overall, millennials and Generation X report a slightly higher market penetration than the average. Interestingly, millennial dads outperform any other consumer group and have the strongest demand for OJ. Our simulation suggests that if all consumers were millennial dads, the demand for OJ would be increased by 1.77. Millennial dads also report that they have both higher positive perceptions and negative perceptions of OJ, indicating their perceived benefits surpass their perceived risks of OJ consumption. However, the industry should be cautious about targeting this group because it only accounts for about 8% of the population. Previous studies have indicated that enhancing consumers' good perceptions about OJ can boost consumer demand significantly, and this is applicable to all consumers (Heng et al. 2019). Therefore, developing a positive message that resonates with consumers across generations could be a more effective strategy than only focusing on one demographic group.
References
Florida Department of Citrus. 2019. Citrus Reference Book. https://www.floridacitrus.org/grower/economic-market-resources/economic-reports/.
Heng. Y., Z. Gao, Y. Jiang, and X. Chen. 2018. "Exploring hidden factors behind online food shopping from Amazon reviews: A topic mining approach." Journal of Retailing and Consumer Services 42: 161–168. https://doi.org/10.1016/j.jretconser.2018.02.006
Heng, Y., R. Ward, L. House, and M. Zansler. 2019. "Assessing key factors influencing orange juice demand in the current US market." Agribusiness 35 (4): 501–515. https://doi.org/10.1002/agr.21596