In this article, I present estimates for the cost of production per acre for processed oranges grown in southwest Florida in 2019/20. A total of six growers participated in the data collection process, which this year was conducted mostly by mail due to COVID-19. Such change in the data collection process does not cause any significant changes in the integrity or interpretation of the estimates presented herein. By surveying growers regarding the actual costs of their production programs, I am able to report estimates that closely reflect the cost of production in commercial operations. Moreover, the mail survey still provided confidentiality and anonymity to participants. Most importantly, the report still provides representative estimates of the most recent production practices, input combinations, costs, and production levels. The questionnaire asked growers to provide annual, per acre costs by program for a “typical” irrigated, mature grove (10+ years old), including costs related to their tree replacement program.
Since the outbreak of HLB, growers have been modifying their practices from year to year in an attempt to cope with the disease. Thus, surveying growers allows us to report estimates that closely reflect their cost and to track the changes they make to their cultural practices. However, the cost estimates below do not represent any individual operation. Instead, their purpose is to serve as a benchmark for the Florida citrus industry. The figures below were obtained by computing the weighted average of the responses by the acreage of each of the participating growers. The number of acres managed by their combined operations accounts for approximately 36,200 acres. The latest acreage for oranges in southwest Florida was estimated at 248,308 (USDA-NASS 2019). Thus, the sample of growers represented 15% of the acreage devoted to oranges in that region.
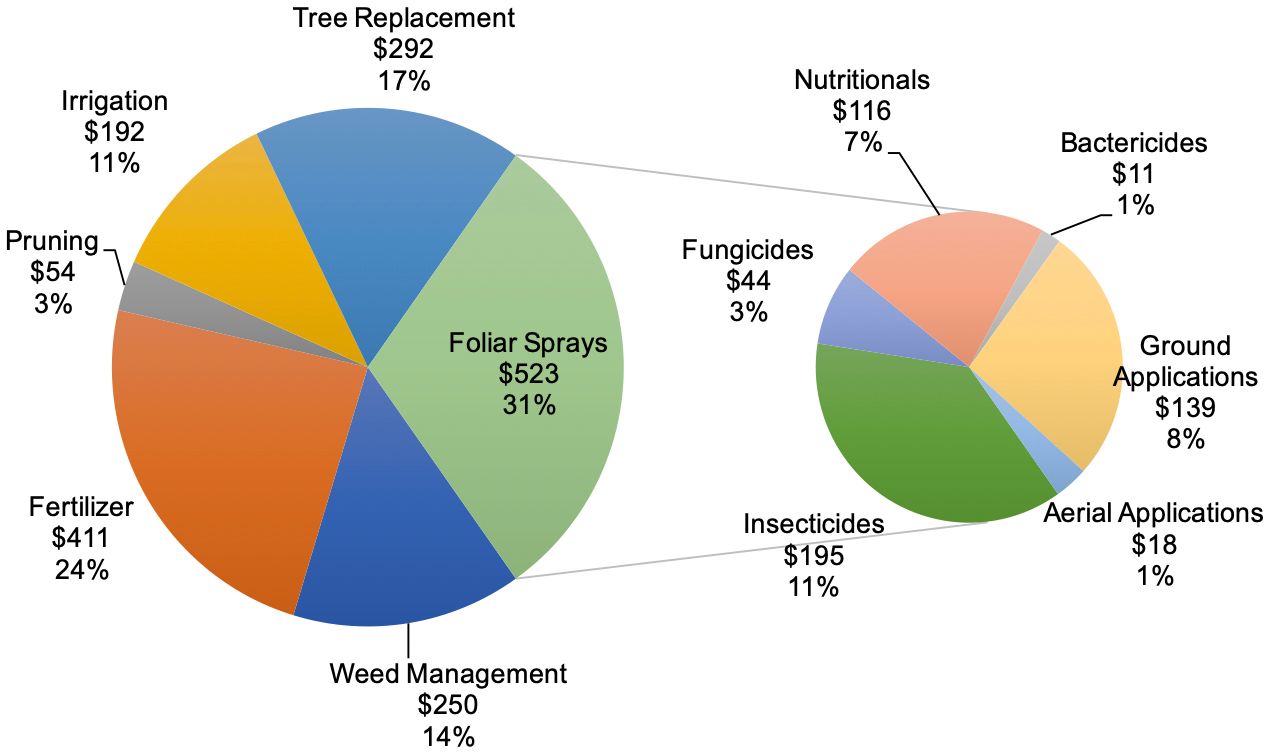
Table 1 shows the cultural cost of production by program. The estimates include both the cost of materials and the cost associated with their application. The total cost for weed management, which includes chemical and mechanical mowing as well as herbicides, was $249.96 per acre. At $522.81 per acre, foliar sprays represented the largest cost. Fertilizer was the second largest expense at $410.51 per acre. The expense for pruning was $53.84 per acre, while that for irrigation was $192.41 per acre. Adding all the costs listed above, the cultural cost of growing oranges for processing during 2019/20 without tree replacement was $1,429.53 per acre.
Growers were also asked to provide details regarding their reset practices, including the number of trees replaced in their groves. On average, growers replaced six trees per acre during 2019/20. The total cost of tree replacement, including tree removal, site preparation, and supplemental care of those six young trees was estimated at $292.46 per acre. Adding this figure to the total cost above equals a total production cost with tree replacement of $1,721.99 per acre.
Figure 1 depicts a double pie chart. The larger pie shows the cost of each program as well as the percentage relative to the total cultural production costs with tree replacement. The smaller pie in Figure 2 provides greater detail regarding the individual components included in the foliar sprays. Insecticides accounted for $194.79 per acre, representing 11% of the cultural cost of production; fungicides accounted for $43.51 per acre (3%); foliar nutritionals for $115.86 per acre (7%); aerial application totaled $18.45 per acre (1%), and ground application of materials was $139.34 per acre (8%).

Credit: Tyler Jones, UF/IFAS

Credit: UF/IFAS
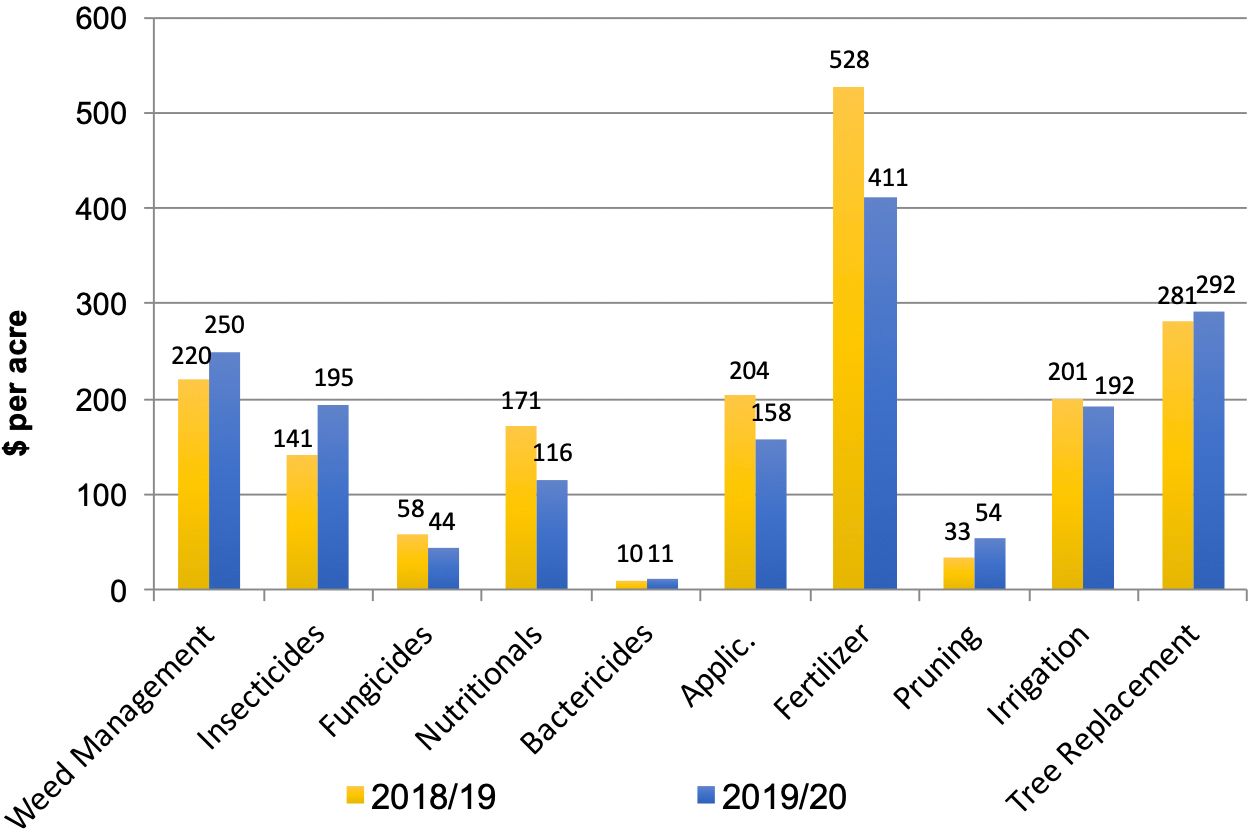
Figure 3 shows a comparison of the cost of the main production programs in 2019/20 relative to 2018/19. The main changes in cultural practices in 2019/20 compared to the previous season are as follows. First, there was a decrease of $117 per acre in fertilizer spending. The second-largest change was a reduction in nutritionals spending; growers reported spending, on average, $116 per acre, down from $55 last season. The third largest change was an increase in insecticide spending of $54 per acre compared to last season.

Credit: UF/IFAS
In addition to cultural costs, growers typically have to incur in other costs when managing their groves; these other costs include management, regulatory, and opportunity costs. Table 2 shows the total cost of production for processed oranges grown in southwest Florida during 2019/20, which was $2,095.05 per acre. Based on this estimate, the break-even prices per box and per pound solids for different levels of yield are presented in Table 3. Break-even prices were calculated on an on-tree and delivered-in basis. The latter assumes harvesting costs per box were $3.08. The calculations in Table 3 also include the Florida Department of Citrus (FDOC) assessment of $0.07 per box for the 2019/20 season. Thus, for example, the on-tree and delivered-in break-even prices for covering the total costs of production with yield at 200 boxes per acre were $1.84 and $2.40 per pound solids, respectively.
Summary
This article presents a summary of the 2019/20 costs of production for processed oranges grown in southwest Florida. The methodology chosen to collect the data consisted of surveying growers directly so as to reflect their costs. The main changes this season were the decrease in fertilizer and nutritionals spending, and the increase in insecticides. The total cost of production for processed oranges in 2019/20 was $2,095.05 per acre. Typical users of these estimates include growers and consultants, who use them as a benchmark; property appraisers, who use them to compute the taxes for property owners; and researchers, who use the estimates to evaluate the economic feasibility of potential new technologies.
Reference
USDA-NASS. 2020. Florida Citrus Statistics 2018/19.
Table 1. Cultural costs of production per acre for processed oranges grown in southwest Florida, 2019/20.
1 Irrigation system includes: maintenance and repairs to emitters, clean ditches, ditch and canal maintenance, water control.
Table 2. Total costs of production per acre for processed oranges grown in southwest Florida, 2019/20.
Table 3. Breakeven price per box and per pound solids for processed oranges grown in southwest Florida, 2019/20.
1 Assumes 5.76 pound solids per box based on Florida Department of Citrus (FDOC) Processor Statistical Report for the 2018/19 season.