MENU

AskIFAS Powered by EDIS

Valuing Florida Water Resources: Summary by Regions

Fei He, Tatiana Borisova, Xiang Bi, and Kelly Grogan

Introduction

As a part of the EDIS series “Economic Value of Florida Water Resources,” this publication aims to help the interested public learn about the economic benefits associated with local water resources. It presents examples of the economic benefits of water resources in five Florida regions, which are generally defined based on the Water Management Districts’ boundaries (Figure 1). 
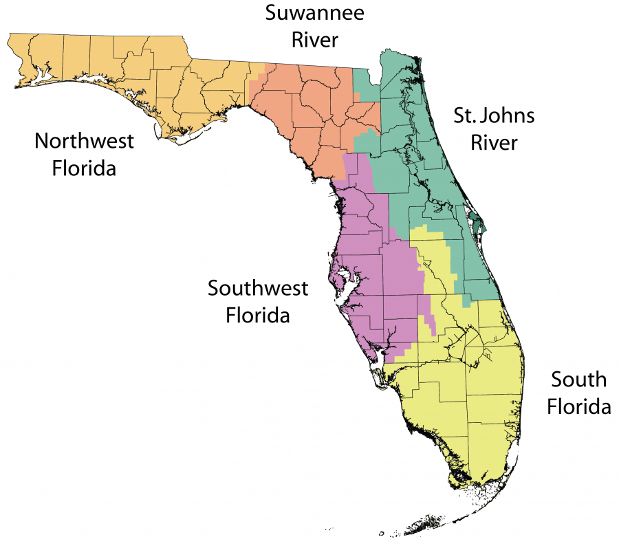
Florida Water Management Districts (FDEP 2017). Florida Water Management District boundaries.
Figure 1. Florida Water Management Districts (FDEP 2017). Florida Water Management District boundaries.
Credit: Florida Department of Environmental Protection (FDEP), https://floridadep.gov/water-policy/water-policy/content/water-management-districts#SJR


How can we measure the economic benefits provided by water resources?

Economists use various approaches to estimate the benefits of natural resources. For example, consider state and national parks in Florida organized around springs, rivers, or coastal attractions. Tourists are drawn by water-based recreation opportunities, the chance to see manatees, or enjoy other activities directly or indirectly associated with water. These visitors spend money on lodging, meals, snacks, or diving equipment, thereby supporting local businesses. The studies that examine the visitor spending and the economic activities spurred by this spending are referred to as “the economic impact analyses.” The Florida Department of Environmental Protection (FDEP) annually analyzes the state parks' visitation, visitor spending, and related economic contribution. The National Park Service also publishes analyses of economic contributions for the national parks. University of Florida’s Economic Impact Analysis Program, as well as other Universities in the state, also examines economic contributions of visitor expenditures.

Another method to gauge the value assigned to water-related experiences is to ask visitors about their willingness to pay for various recreational experiences above their actual spending. Such an approach allows estimation of the values derived by visitors that are not captured in market transactions (referred to as “consumer surplus). Alternatively, this value can be examined by looking at how far tourists travel for recreational activities. One can also assess the benefits of water quality improvements by considering riverfront house sale prices during periods with “good” or “bad” river water quality. These and other methods to valuing the benefits provided by water resources are described in the overview publication in this series, here.

Studies report different estimates for the same site. Can I add up these estimates?

Sometimes the same recreational site or the same water body is examined repeatedly, frequently because of high regional or national significance. Economists can employ different valuation methods, focus on different types of benefits (e.g., recreation vs. riverfront property amenities), and employ various metrics (e.g., total recreational visitor spending vs. spending by non-local visitors only). To avoid possible double counting of the benefits, it is generally recommended to refrain from adding up different values estimated for the same site (even though there are exceptions to this general rule).

Northwest Florida: State Parks and Visitors’ Spring-Based Recreation

The Florida Panhandle (Figure 2) is recognized for its freshwater springs and rivers. Both coastal and inland state and national parks contribute significantly to the regional economy (Table 1). For example, the estimated economic contribution for Edward Ball Wakulla Springs State Park was $19.7 million in 2019, supporting 276 full- and part-time jobs.
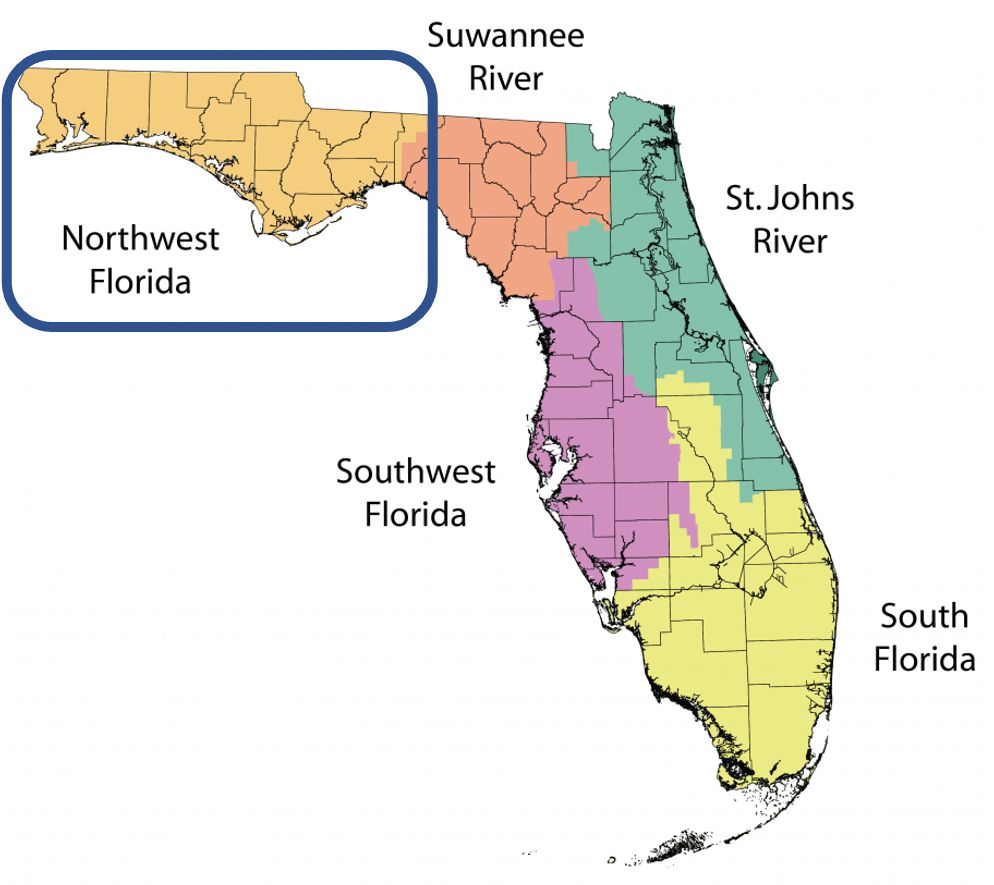
Northwest Florida Water Management District (NWFWMD).
Figure 2. Northwest Florida Water Management District (NWFWMD).
Credit: Based on FDEP 2017


Edward Ball Wakulla Springs State Park
Figure 3. Edward Ball Wakulla Springs State Park
Credit: NWFWMD

Further, the value of recreational experiences to the visitors was estimated for recreation on Edward Ball Wakulla Springs State Park, Jackson Blue Springs County Recreation Area, and sites in the Apalachicola River Basin (Table 2). For example, cave diving trips to the Jackson Blue Springs County Recreation Area are valued by the visitors at $155 per person per trip (above the actual trip expenditures). These estimates illustrate the importance of protecting local water resources.

Table 1. Economic studies examining recreational benefits provided by water resources in the NWFWMD.

Natural resource site and recreation type

County

Annual attendance

Economic impact indicator

Total jobs supported

Reference

Contribution to the regional economy for selected state and national parks

National Park (2019 data)


Gulf Islands National Seashore

Santa Rosa

5.6 million

$310 million total economic outputa

3,305a

National Park Services (2020)

Selected State Parks (2019 data)


Florida Caverns State Park

Jackson

44,215

$4.5 million DEIb

63c

FDEP (2020)

Ponce de Leon Springs State Park

Holmes

69,073

$6.3 million DEI b

89 c

FDEP (2020)

Wakulla Springs State Park

Wakulla

218,735

$19.7 million DEI b

276 c

FDEP (2020)

Grayton Beach State Park

Walton

212,050

$19.5 million DEI b

274 c

FDEP (2020)

Henderson Beach State Park

Okaloosa

476,296

$41.3 million DEI b

578 c

FDEP (2020)

St. Andrew State Park

Bay

650,335

$57 million DEI b

798 c

FDEP (2020)

Perdido Key State Park

Escambia

215,257

$18.4 million DEI b

258 c

FDEP (2020)

Recreation in the state parks listed above and the other state parks in District 1 of the Florida state park system d

- d

3,638,530

$331 million DEI b

4,637c

FDEP (2020)

a These indicators account for direct, indirect, and induced effects from visitor spending. Specifically, “economic output is a measure of the total estimated value of the production of goods and services supported by NPS visitor spending. Economic output is the sum of all intermediate sales (business to business) and final demand (sales to consumers and exports) … Jobs measure annualized full and part time jobs that are supported by NPS visitor spending” (p. 4, NPS 2020).

b This value focuses on direct impacts only, and it does not account for indirect and induced effects. Therefore, it is not directly comparable with the value reported for the national parks. Direct economic impact (DEI) is defined as the amount of new dollars spent annually in a local economy by non-local park visitors and park operations (FDEP 2020).

c It is assumed that 16 jobs are supported per $1 million in total expenditures in a given local area (FDEP 2020). It is not specified whether this value includes any indirect or induced effects from the spending.

d Note that District 1 of the Florida state park system covers Florida Panhandle, and it slightly exceeds the area of the NWFWMD (see FDEP 2019). The estimates reported in this row include the Edward Ball Wakulla Springs State Park.

Table 2. Visitors’ willingness to pay (WTP) above the actual spending for recreational trips in the NWFWMD.

Natural resource site and recreation type

County

Average WTP

Aggregate annual WTP

Reference

Visitors’ willingness to pay (WTP) above the actual spending for the trip

Wakulla Springs, cavern and cave diving (if allowed)

Wakulla

$52–$83 per cave dive

$9 per cavern dive (above the trip expenditures)

$0.50 million

Huth and Morgan (2011)

Jackson Blue Springs, cave diving

Jackson

$155 per person per trip (above the trip expenditures)

$0.58 million

Morgan and Huth (2011)

Nature-based recreation at five key recreation sites in the Apalachicola River Basin a

Gulf

$74.18 per visit-day (above the trip expenditures)

$484.56 million

Shreshta et al. (2007)

a This includes St. Vincent National Wildlife Refuge, Tate’s Hell State Forest, Apalachicola River Wildlife and Environment Area, Apalachicola National Forest, and St. George Island State Park

Suwannee River Basin: Florida’s Springs Region

Springs are unique natural landmarks in north Florida, attracting many recreational visitors and supporting local economies. The Suwannee River Water Management District (Figure 4) has one of the highest concentrations of large freshwater springs in the United States (SRWMD undated). These large springs are referred to as first- and second-magnitude springs for the large volumes of water they discharge – more than ten or even 100 cubic feet per second. For example, Figure 5 shows Blue Hole at Ichetucknee Springs, one of Florida's large springs, located in the District. Spring recreational and wildlife depend on the water flow and good water quality, and stakeholder groups and agencies are working on restoring or protecting this unique natural resource. Reduction in spring water quality and flow is a concern for many.
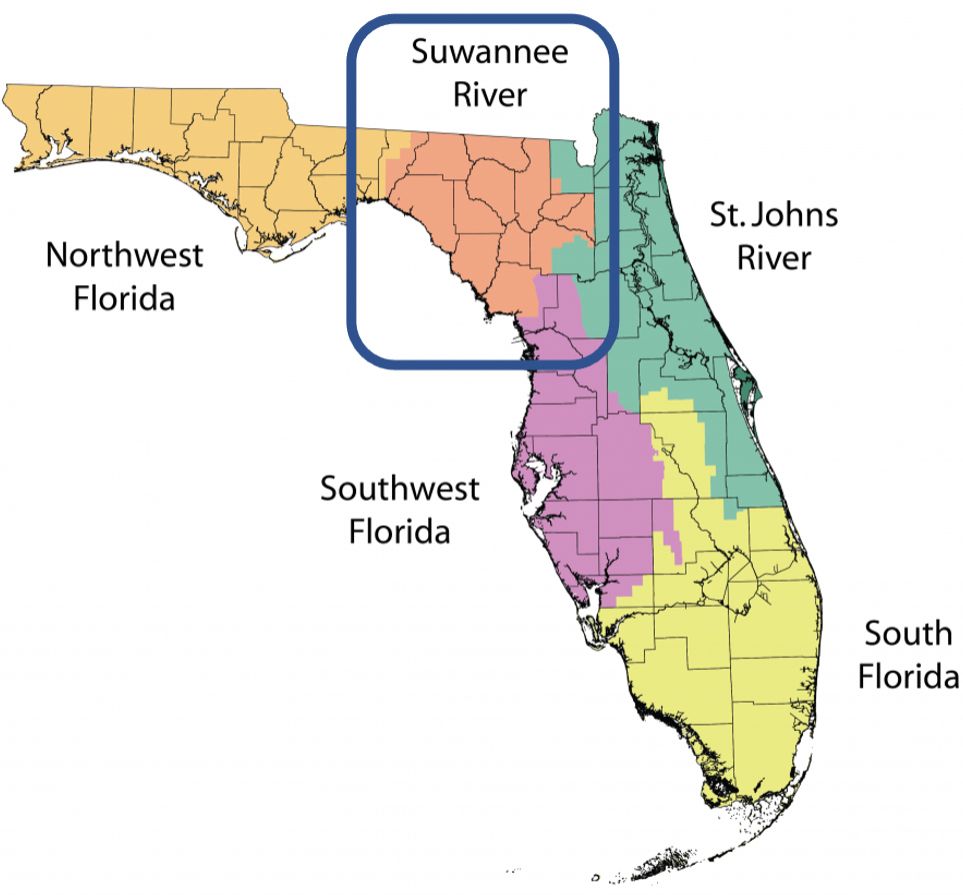
Suwannee River Water Management District (SWFWMD).
Figure 4. Suwannee River Water Management District (SWFWMD).
Credit: Based on FDEP 2017

Several studies estimated the spending of visitors to the springs and related this spending to regional economic activities. For example, 258,000 people attended Ichetucknee Springs State Park in 2019, contributing $21.7 million to the regional economy, and supporting 304 jobs (Table 3).

In addition, Wu et al. (2018) examined the visitors’ willingness to pay for their recreational experiences in addition to the expenses incurred. For example, for Ichetucknee Springs, Wu et al. (2018) estimated that the value of the visitors' recreational experiences was $14.66 million above the actual trip expenditures (Table 4).
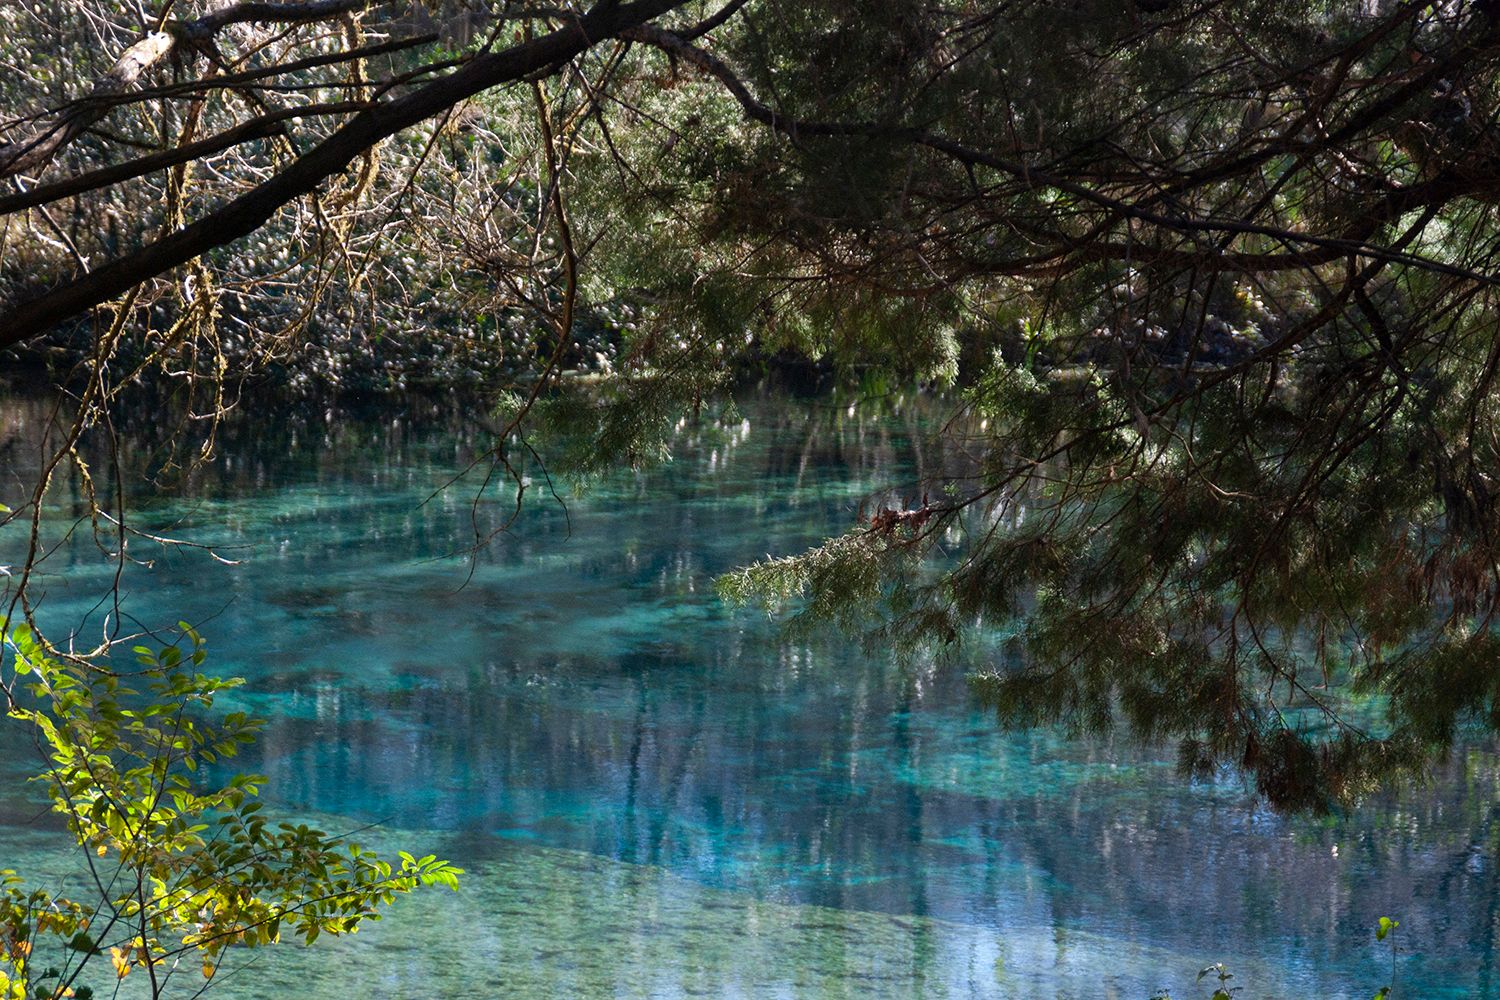
Ichetucknee Springs
Figure 5 . Ichetucknee Springs. Credit: Tyler Jones, UF/IFAS 

Overall, these studies imply that deteriorating quality and reducing flows of the springs may result in a significant reduction in springs-related expenditures and thereby economic activity in the region and the loss of recreational opportunities and related benefits highly valued by the visitors.

Table 3. Economic studies examining recreational benefits provided by water resources in the SRWMD.

Contribution to the regional economy—economic impact analysis for selected state parks

Natural resource site and recreation type

County

Annual attendance

Economic impact indicator

Total jobs supported

Reference

Selected state parks (2019 data)

Madison Blue Spring State Park

Madison

24,558

$2.2 million DEI b

31 a

FDEP (2020)

Lafayette Blue Springs State Park

Lafayette

17,671

$1.8 million DEI b

26 a

FDEP (2020)

Suwannee River State Park

Hamilton, Madison, Suwannee

45,465

$4.2 million DEI b

59 a

FDEP (2020)

Wes Skiles Peacock Springs State Park

Suwannee

11,118

$1.0 million DEI b

14 a

FDEP (2020)

Troy Spring State Park

Lafayette

6,450

$0.6 million DEI b

9 a

FDEP (2020)

Ichetucknee Springs State Park

Columbia

258,078

$21.7 million DEI b

304 a

FDEP (2020)

River Rise Preserve State Park

Alachua & Columbia

2,451

$0.2 million DEI b

3 a

FDEP (2020)

Gilchrist Blue Spring State Park

Gilchrist

138,015

$12.1 million DEI b

169 a

FDEP (2020)

Fanning Springs State Park

Levy

180,423

$15.7 million DEI b

220 a

FDEP (2020)

Manatee Springs State Park

Levy

256,631

$22.6 million DEI b

316 a

FDEP (2020)

Recreation in the state parks listed above and the other state parks in District 2 of the Florida state park system, including both beaches and inland state parks c

- c

4,702,985

$420 million DEI b

5,878 a

FDEP (2020)

Contribution to the regional economy—economic impact analysis for the sites including but not limited to state parks

Natural resource site and recreation type

County

Annual attendance

Economic impact indicator

Total jobs supported

Reference

Fifteen publicly and privately owned springs in the Suwannee and Lower Santa Fe River Basins

Counties in SRWMD

1,012,066

Spending by local and nonlocal visitors: $84.19 million in Fiscal Year 2012–2013

1,160 d

Borisova et al. (2015)

a It is assumed that 16 jobs are supported per $1 million in total expenditures in local area (FDEP 2020). It is not specified whether this value includes any indirect or induced effects from the spending.

b Direct economic impact (DEI) is defined as the amount of new dollars spent annually in a local economy by non-local park visitors and park operations (FDEP 2020). This value does not account for indirect and induced effects of visitor spending.

c District 2 of the Florida state park system covers SRWMD (excluding Jefferson County and a part of Taylor County), as well as portions of SJRWMD and SWFWMD (see FDEP 2019). The estimates reported in this row include the Ichetucknee Springs State Park.

d This value includes jobs supported by direct, indirect, and induced effects of visitor spending, and therefore, this value is not directly comparable with the values reported for the state parks.

Table 4. Recreational benefits provided by water resources in the SRWMD: value beyond actual visitor spending.

Natural resource site and recreation type

County

Aggregate annual WTP

Reference

Visitors’ willingness to pay (WTP) above the actual spending for the recreational trip

Fanning Springs State Park

Levy, Gilchrist

$6.33 million (above the actual trip expenditures)

Wu et al. (2018)

Ichetucknee Springs State Park

Columbia

$14.66 million (above the actual trip expenditures)

Wu et al. (2018)

Blue Springs (Gilchrist)

Gilchrist

$2.24 million (above the actual trip expenditures)

Wu et al. (2018)

Madison Blue Spring

Madison

$1.39 million (above the actual trip expenditures)

Wu et al. (2018)


East Florida: Diverse Water Resources and Related Benefits

Diverse water resources in east Florida, broadly defined as the area of St. Johns River Water Management District (SJRWMD, see Figure 6), provide residents and visitors with various recreational opportunities (Figure 7), waterfront amenities, and other benefits. The studies focusing on the economic impact of recreational benefits specifically are summarized in Table 5. For example, Blue Spring State Park was visited by more than 560,000 visitors in 2019, contributing almost $49 million to the regional economy, and supporting 572 full-time and part-time jobs. In addition to the actual expenditure for the recreational trips (and related contribution to state economy), the value derived by the visitors to all inland water recreation sites in the region was estimated at $208.9 million per year (Table 6).
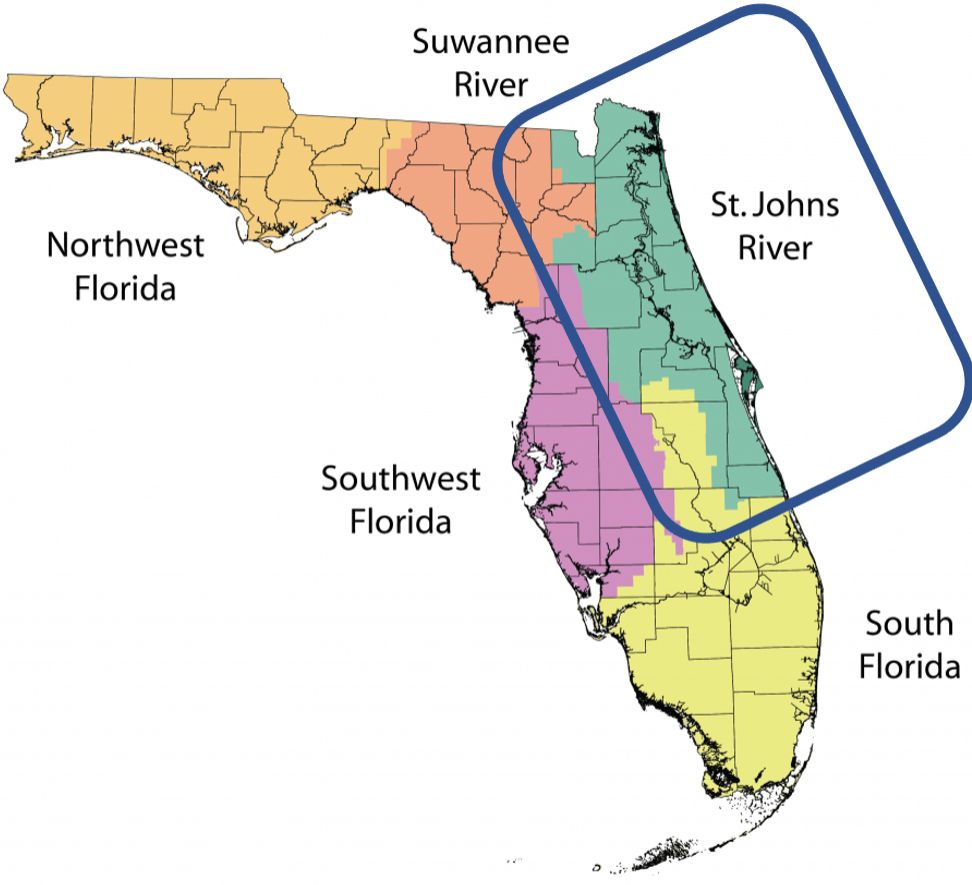
St. Johns River Water Management District (SJFWMD)
Figure 6. St. Johns River Water Management District (SJFWMD)
Credit: Based on FDEP 2017


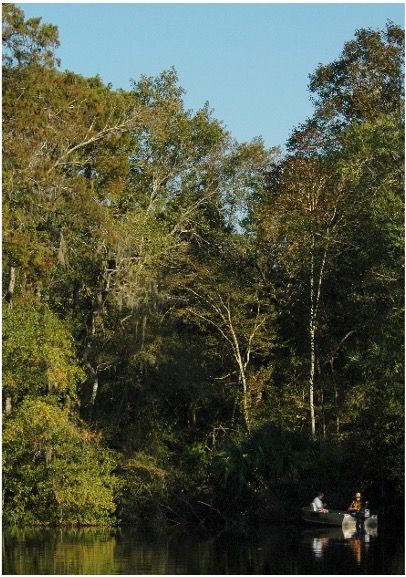
Two men fishing in the St. Johns River
Figure 7. Two men fishing in the St. Johns River.
Credit: UF/IFAS

One of the largest cities in Florida and the United States, Jacksonville, is located in SJRWMD. It is not surprising that several economic studies conducted in this region focused on the value of clean water to residential households in Jacksonville and the surrounding area. Studies showed that improving river or lake water quality increases waterfront homes' prices, reflecting the worth of the enhanced amenity benefits provided by the water bodies (Table 7). Two other studies found that households are willing to pay for improved water quality for domestic use (Table 8). Overall, protecting and improving water quality and availability in rivers, lakes, and aquifers ultimately impacts locals' and visitors' well-being.

Table 5. Economic impact of water-based recreational in east Florida.

Contribution to the regional economy—selected state and national parks

Natural resource site

County

Annual attendance

Economic impact indicator

Total jobs supported

Reference

National parks (2019 data)


Timucuan Ecological & Historic Preserve

Duval

1.2 million

$100.5 million in economic outputa

1,085 a

NPS (2020)

Canaveral National Seashore

Brevard

1.9 million

$95.1 million in economic outputa

937 a

NPS (2020)

Selected state parks (2019 data)


Blue Spring State Park

Volusia

561,219

$48.8 million DEIb

572 c

FDEP (2020)

De Leon Springs State Park

Volusia

243,285

$21.4 million DEIb

300 c

FDEP (2020)

Silver Springs State Park

Marion

399,465

$35.9 million DEIb

503 c

FDEP (2020)

Wekiwa Springs State Park

Seminole, Orange, Lake

431,982

$38.2 million DEIb

535 c

FDEP (2020)

Big Talbot Island State Park

Duval

337,068

$29 million DEIb

407 c

FDEP (2020)

Anastasia State Park

St. Johns

967,489

$83.9 million DEIb

1,175 c

FDEP (2020)

North Peninsula State Park

Volusia

249,751

$21.3 million DEIb

299 c

FDEP (2020)

Sebastian Inlet State Park

Brevard

761,339

$66.5 million DEIb

931 c

FDEP (2020)

Recreation in the state parks listed above and the other state parks in District 3 of the Florida state park system, including both beaches and inland state parks d

Counties central-eastern Florida d

8,377,974

$716 million DEIb

10,319 c

FDEP (2020)

Contribution to the regional economy—sites potentially including but not limited to state and national parks


Natural resource site

County

Annual attendance

Economic Impact Indicator

Total job supported

Reference

Indian River Lagoon

Volusia, Brevard, Indian River, St. Lucie, and Martin

7,400,000

Total annual economic output received in 2014 is $7.6 billion e

71,918 e

ECFRPC and TCRPC (2016)

a These indicators account for direct, indirect, and induced effects from the visitor spending. Specifically, “economic output is a measure of the total estimated value of the production of goods and services supported by NPS visitor spending. Economic output is the sum of all intermediate sales (business to business) and final demand (sales to consumers and exports) … Jobs measure annualized full and part time jobs that are supported by NPS visitor spending” (p. 4, NPS 2020).

b This value focuses on direct impacts only, and it does not account for indirect and induced effects. Therefore, it is not directly comparable with the value reported for the national parks. Direct economic impact (DEI) is defined as the amount of new dollars spent annually in a local economy by non-local park visitors and park operations (FDEP 2020).

c It is assumed that 16 jobs are supported per $1 million in total expenditures in a given local area (FDEP 2020). It is not specified whether this value includes any indirect or induced effects from the spending.

d Note that District 2 of the Florida state park system also covers part of the SJRWMD. For the map of the districts, see FDEP 2018.

e This value includes direct, indirect, and induced effects, and therefore, it is comparable with metrics reported for the national parks in NPS (2020).

Table 6. Visitors’ willingness to pay (WTP) above the actual spending for the recreational trip.

Visitors’ willingness to pay (WTP) above the actual spending for the recreational trip

Natural resource site

County

Economic Estimate

Reference

St. Johns River Basin

Counties in SJRWMD

Estimated value derived by the visitors to inland water recreation sites is $208.9 million per year (in addition to the actual expenditure for the recreational trips).

Ehrlich et al. (2017)

Springs in Ocala National Forest

Marion, Lake, Putnam, and Seminole

The willingness to pay: $1.0 to $2.5 million per year (depending on level of facilities provided at the site) in addition to the actual expenditure for the recreational trips

Shreshta et al. (2002)

Table 7. Economic studies focusing on amenity values provided by water resources in east Florida.

Amenity values provided by water resources in east Florida

Area

County

Economic Value

Reference

St. Johns River

Duval, Clay, Putnam, and St. Johns

St. Johns River water quality improvements can increase the value of properties along the river by $346.1 million

Seidel et al. (2015)

Lakes in urban Orange County

Orange

An increase in transparency depth by one foot results in an increase in average home sale price by about 1.2% (or $6,900) for lakefront properties, and 0.3% ($880) for non-lakefront properties

Walsh et al. (2010)

Table 8. Economic studies focusing on the value of water quality Improvements in east Florida.

Willingness to pay for tap and well water quality improvements

Area

County

Economic Value

Reference

Tap water supplied to Jacksonville

Duval

In total, customers of the Jacksonville Electrical Authority (JEA) are willing to pay $746,400 monthly for water quality improvements ($6.22 per person per month)

Chatterjee et al. (2017)

Well water in rural areas of Lake County

Lake

When total nitrate and nitrite concentration in well water exceeded the drinking water quality standards, the reduction in the home sale price was 7 to 15 percent.

Guignet et al. (2016)

West-Central Florida: Visitation of Coastal and Inland State Parks

Inland springs and coastal areas in southwest Florida (Figure 9) attract many visitors annually, and visitors’ spending is an important contributor to the region’s economy. For example, more than 350 million people visited Rainbow Springs State Park in 2019, contributing $31.1 million to the economy and supporting 436 full- and part-time jobs (Table 9). Deterioration of water resources can result in a significant reduction in recreational activity and related economic contributions in the region. More studies are underway to measure these impacts. For example, in 2020, the National Center for Coastal Ocean Science awarded a grant to study the economic impacts of the historic harmful algal bloom (commonly referred to as “red tide”) in 2017–2019. Economists from major Florida universities lead the study, and study results should become available soon (NCCOS 2020a, NCCOS 2020b).
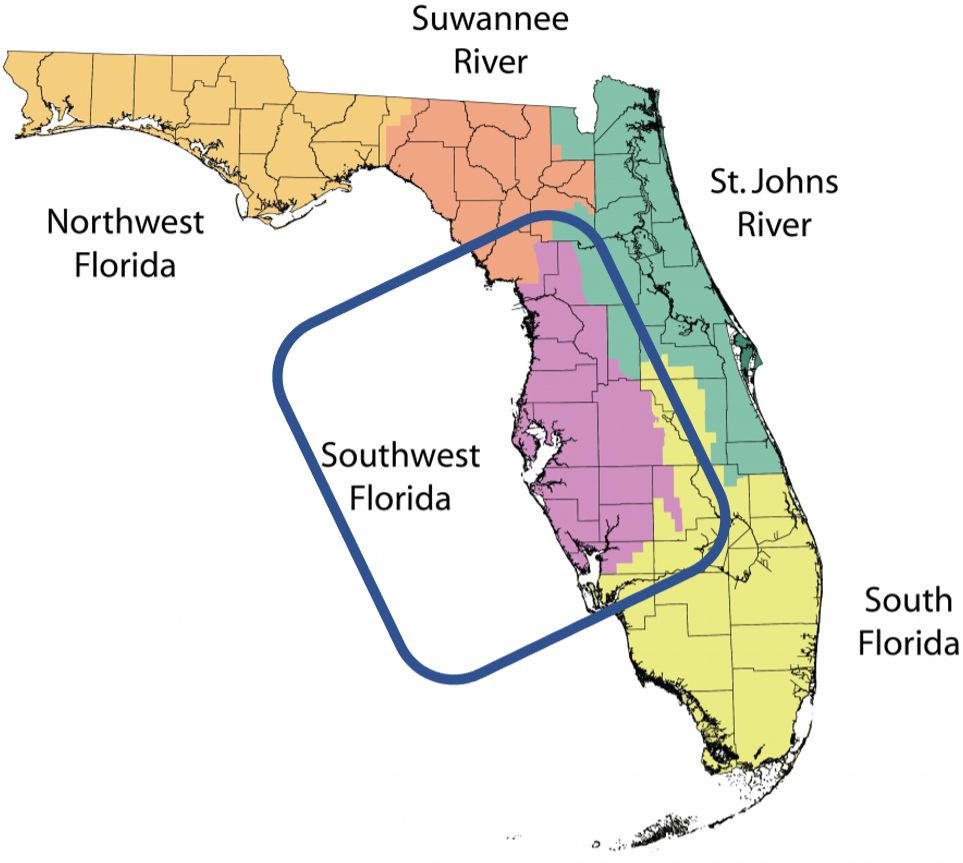
Southwest Florida Water Management District (SWFWMD).
Figure 8. Southwest Florida Water Management District (SWFWMD).
Credit: Based on FDEP 2017


South Florida Water Management District (SFWMD).
Figure 9. South Florida Water Management District (SFWMD).
Credit: Based on FDEP 2017

Table 9. Economic studies examining recreational benefits provided by water resources in the SWFWMD.

Contribution to the regional economy—economic impact analysis

Natural resource site and recreation type

County

Annual attendance

Economic impact Indicator

Total jobs supported

Reference

Selected state parks a


Rainbow Springs State Park

Marion

353,764

$31.1 million DEI b

436c

FDEP (2020)

Ellie Schiller Homosassa Springs Wildlife State Park

Citrus

228,044

$21.4 million DEI b

300 c

FDEP (2020)

Weeki Wachee Springs State Park

Hernando

284,470

$19.3 million DEI b

410 c

FDEP (2020)

Werner-Boyce Salt Springs State Park

Pasco


27,001

$2.5 million DEI b

36 c

FDEP (2020)

Honeymoon Island State Park


Pinellas

1,610,871

$140.3 million DEI b

1,965 c

FDEP (2020)

Caladesi Island State Park

Pinellas

288,445

$25.5 million DEI b

357 c

FDEP (2020)

Anclote Key State Park

Pinellas

226,846

$19.5 million DEI b

274 c

FDEP (2020)

a Economic impact estimates for the other state parks located in the SWFWMD are available in FDEP (2020). Note that the districts defined by the Florida state park system do not coincide with the SWFWMD boundaries. As a result, SWFWMD is split between Districts 2, 3, and 4.

b Direct economic impact (DEI) is defined as the amount of new dollars spent annually in a local economy by non-local park visitors and park operations (FDEP 2020). This value does not account for indirect and induced effects and therefore is not directly comparable with the value reported for the national park.

c It is assumed that 16 jobs are supported per $1 million in total expenditures in a given local area (FDEP 2020). It is not specified whether this value includes any indirect or induced effects from the spending.

South Florida: The Everglades and Other State and National Parks

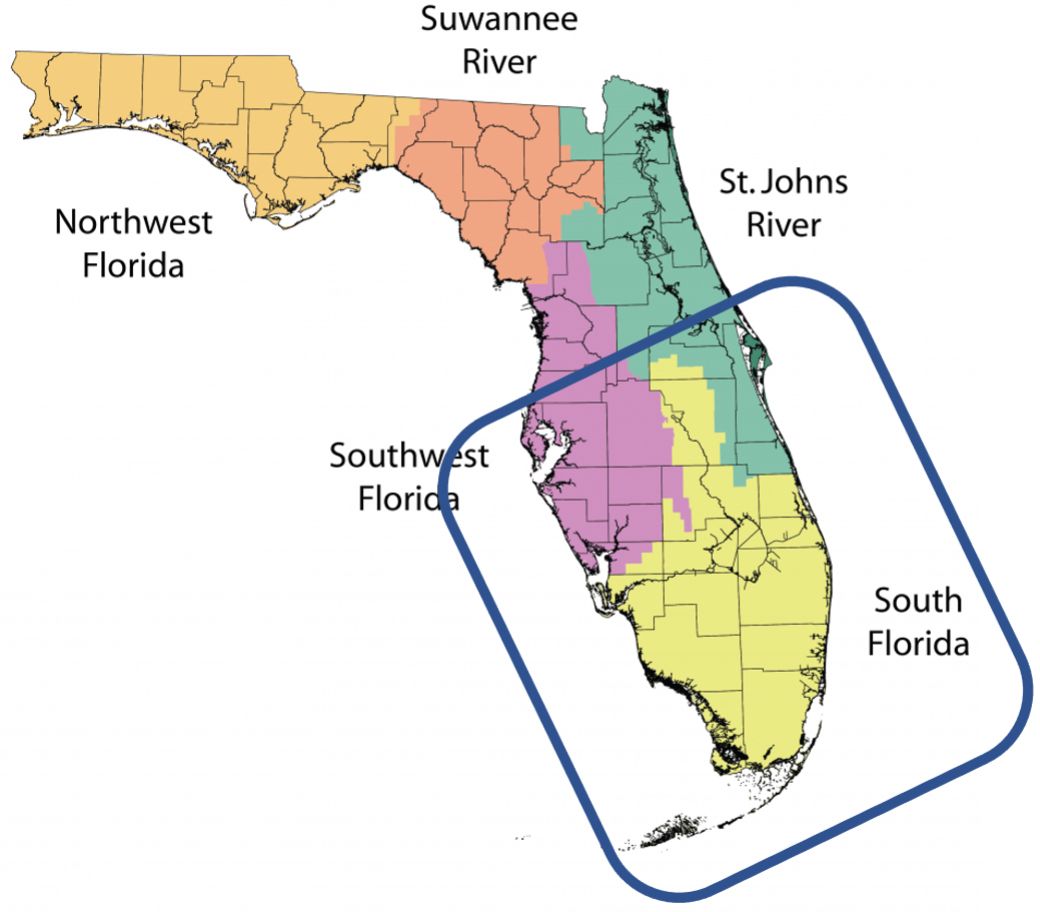
Wise management of water resources is crucial for the south Florida region (Figure 10). The studies conducted in the region focused on the following types of important “services” provided by natural resource sites: (a) recreation (with visitors’ spending contributing to the regional economy, Table 10); (b) amenity provided by the waterfront properties, with the amenity impacted by river and estuary water quality changes (Table 11); and (c) variety of services provided by the Everglades, such as wildlife habitat and ecosystem function support (Table 12).
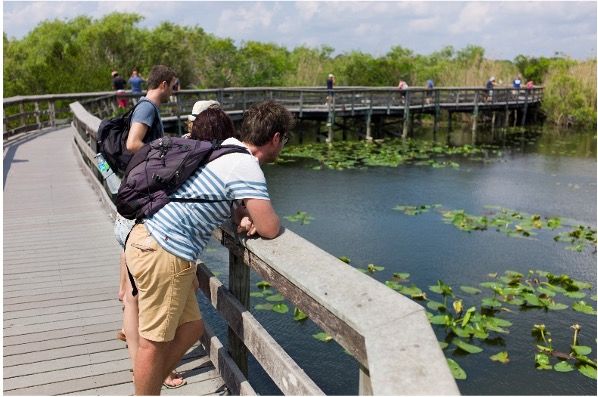
Tourists on a boardwalk at Everglades National Park.
Figure 10. Tourists on a boardwalk at Everglades National Park.
Credit: UF/IFAS

State parks and national preserves attract millions of people annually, and this visitation is essential for local business activities. Water quality in coastal waters can also significantly impact beachfront properties' attractiveness (and related tax collections). Preservation of wildlife habitat, water flow regulation, carbon sequestration, and other benefits provided by south Florida wetlands are also valued by many. Changes in these services will have an indirect but possibly significant influence on people's well-being. Future studies will provide additional estimates in support of this statement. For example, in 2020, the National Center for Coastal Ocean Science awarded a grant to study the economic impacts of the historic harmful algal bloom (commonly referred to as “red tide”) in 2017–2019. Economists from major Florida universities lead the study, and study results should become available soon (NCCOS 2020a, NCCOS 2020b).

Table 10. Economic value of services provided by water resources in the SFWMD.

Contribution to the regional economy—economic impact analysis

Natural resource site and recreation type

County

Annual attendance

Economic impact indicator

Total jobs supported

Reference

National parks (2019 data)

Big Cypress National Preserve

Collier

1,007,471

$117.1 million economic output a

1,080 a

NPS (2020)

Biscayne National Park

Miami-Dade

708,552

$64.7 million economic output a

606 a

NPS (2020)

Everglades National Park

Miami-Dade

1,118,300

$164.9 million economic output a

1,508 a

NPS (2020)

Selected state parks (2019 data)


Delnor-Wiggins Pass State Park

Collier

539,633

$46.9 million DEI b

657 c

FDEP (2020)

Gasparilla Island State Park

Lee

281,241

$24.4 million DEI b

341 c

FDEP (2020)

Lovers Key State Park

Lee

806,978

$69.7 million DEI b

976 c

FDEP (2020)

Bahia Honda State Park

Monroe

438,179

$40.6 million DEI b

568 c

FDEP (2020)

Bill Baggs Cape Florida State Park

Miami-Dade

675,000

$58.9 million DEI b

824 c

FDEP (2020)

John Pennekamp Coral Reef State Park

Monroe

569,194

$50.3 million DEI b

704 c

FDEP (2020)

Dr. Von D. Mizell-Eula Johnson State Park

Broward

340,778

$30.3 million DEI b

424 c

FDEP (2020)

Wekiwa Springs State Park

Orange

431,982

$38.2 million DEI b

535 c

FDEP (2020)

All state parks in District 4 of the Florida state park system, d including both beaches and inland state parks

- d

6,572,231

$585 million DEI b

7,038 c

FDEP (2020)

All state parks in District 5 of the Florida state park system, e including both beaches and inland state parks

- e

6,154,633

$546 million DEI b

7,649 c

FDEP (2020)

a These indicators account for direct, indirect, and induced effects from the visitor spending. Specifically, “economic output is a measure of the total estimated value of the production of goods and services supported by NPS visitor spending. Economic output is the sum of all intermediate sales (business to business) and final demand (sales to consumers and exports) … Jobs measure annualized full and part time jobs that are supported by NPS visitor spending” (p. 4, NPS 2020).

b This value focuses on direct impacts only, and it does not account for indirect and induced effects. Therefore, it is not directly comparable with the value reported for the national parks. Direct economic impact (DEI) is defined as the amount of new dollars spent annually in a local economy by non-local park visitors and park operations (FDEP 2020).

c It is assumed that 16 jobs are supported per $1 million in total expenditures in a given local area (FDEP 2020). It is not specified whether this value includes any indirect or induced effects from the spending.

d District 4 of the Florida state park system covers parts of the SWFWMD and SFWMD. For the map of the districts, see FDEP 2018.

e District 5 of the Florida state park system covers part of the SFWMD. For the map of the districts, see FDEP 2018.

Table 11. Examples of amenity values provided by water resources.

Amenity values provided by water resources in south Florida

Region

County

Economic Value

Reference

St. Lucie River Estuary and Loxahatchee Estuary

Martin

An increase in average water clarity by 1% results $36,070 increase in the property sale price, on average.

Bin and Czajkowski (2013)

St. Lucie Estuary and Loxahatchee Estuary

Martin

A 1% increase in water quality grade is valued at $2,614 by the property buyers on average

Bin et al (2017)

Table 12. Examples of the values of supporting and regulating ecosystem services provided by water resources.

Willingness to pay for supporting and regulating ecosystem services

Region

Economic Value

Reference

Restoring the greater Everglades

Average household WTP is $81 per year. Extrapolation of these results to the total Florida population shows that the WTP is $468 million annually, or $4.7 billion over a ten-year period.

Milon and Scrogin (2006)

Ecosystem services provided by mangroves in the Everglades National Park

The total cost of preserving the natural habitat in the Everglades is calculated to be $18.3 billion.


Alongi (2012)


Acknowledgements

The authors acknowledge funding for the project “Water resources and human society: educating Floridians about the value of water resources” from UF Thompson Earth Systems Institute (TESI): Earth Systems Grants. TESI aims to support projects by UF students and postdoctoral scholars that communicate Earth systems research to the institute’s audiences. See more at: TESI, https://www.floridamuseum.ufl.edu/earth-systems/blog/announcing-the-2018-ties-grant-recipients/. This work is also partially funded by USDA NIFA National Integrated Water Quality Program Award No. 2014-51130-22495 (PI: Kelly Grogan). 

References

Alongi, D. 2012. “Carbon Sequestration in Mangrove Forests.” Carbon Manage 3:313–322. 

Alavalapati, J. R. R., R. K. Shrestha, G. A. Stainback, and J. R. Matta. 2004. “ Agroforestry Development: An Environmental Economic Perspective.” Agroforestry Systems 61:299–310.

Bin, O., and J. Czajkowski. 2013. “The Impact of Technical and Non-Technical Measures of Water Quality on Coastal Waterfront Property Values in South Florida.” Marine Resource Economics 28 (1): 43–63.

Bin, O., J. Czajkowski, J. Li, and G. Villarini. 2017. “Housing Market Fluctuations and the Implicit Price of Water Quality: Empirical Evidence from a South Florida Housing Market.” Environment & Resource Economics 68 (2): 319–341.

Borisova, T., A. Hodges, and T. Stevens. 2015. Economic Contributions and Ecosystem Services of Springs in the Lower Suwannee and Santa Fe River Basins of North-Central Florida. https://fred.ifas.ufl.edu/pdf/economic-impact-analysis/FE958.pdf

Chaikaew, P., A. Hodges, and S. Grunwald. 2017. “Estimating the Value of Ecosystem Services in a Mixed-Use Watershed: A Choice Experiment Approach.” Ecosystem Services 23:228–237. 

Chatterjee, C., R. Triplett, C. K. Johnson, and P. Ahmed. 2017. “Willingness to Pay for Safe Drinking Water: A Contingent Valuation Study in Jacksonville, FL.” Journal of Environmental Management 203: 413–421.

East Central Florida Regional Planning Council and Treasure Coast Regional Planning Council (ECFRPC and TCRPC). 2016. Indian River Lagoon Economic Valuation Update. https://loveourlagoon.com/IRL-Economic-Valuation-Update-07252016.pdf

Ehrlich, O., X. Bi, T. Borisova, and S. Larkin. 2016. A Latent Class Analysis of Public Attitudes toward Water Resources with Implications for Recreational Demand. Retrieved from https://ageconsearch.umn.edu/record/230058

Florida Department of Environmental Protection (FDEP). 2018. Florida Park Service State Parks Map. https://www.floridastateparks.org/statewide-map

Florida Department of Environmental Protection (FDEP). 2017. Water Management Districts. https://floridadep.gov/water-policy/water-policy/content/water-management-districts

Florida Department of Environmental Protection (FDEP). 2020. Economic Impact Assessment – Florida State Park System. https://floridadep.gov/sites/default/files/2019-2020%20EIA%20Report%20FINAL%20and%20COVER%20MEMO.pdf

Guignet, D., P. J. Walsh, and R. Northcutt. 2016. “Impacts of Ground Water Contamination on Property Values: Agricultural Run-off and Private Wells.” Agricultural and Resource Economics Review 45 (2): 293–318.

Huth, W. L., and O.A. Morgan. 2011. “Measuring the Willingness to Pay for Cave Diving.” Marine Resource Economics 26:151–166. http://www.agnesmilowka.com/ag_media/coverage/agecon-06-morgan-c.pdf

Milon, J. W., and D. Scrogin. 2006. “Latent Preferences and Valuation of Wetland Ecosystem Restoration.” Ecological Economics 56 (2): 162–175. http://www.sciencedirect.com/science/article/pii/S0921800905000571

Morgan A.O. and W.L. Huth. 2011. Using revealed and stated preference data to estimate the scope and access benefits associated with cave divingResource and Energy Economics 33:107–118. http://www.sciencedirect.com/science/article/pii/S0928765510000072

National Center for Coastal Ocean Science (NCCOS). 2020a. Assessment of the Short- and Long-Term Socioeconomic Impacts of Florida’s 2017–2019 Red Tide Event. https://coastalscience.noaa.gov/project/assessment-of-the-short-and-long-term-socioeconomic-impacts-of-floridas-2017-2019-red-tide-event/

National Center for Coastal Ocean Science (NCCOS). 2020b. Estimating Economic Losses and Impacts of Florida Red Tide. https://coastalscience.noaa.gov/project/estimating-economic-losses-and-impacts-of-florida-red-tide/

National Park Services. 2020. Visitor Spending Effects - Economic Contributions of National Park Visitor Spending. https://www.nps.gov/orgs/1207/06-11-20-nps-visitor-spending-generates-economic-impact-of-more-than-41-billion.htm

Suwannee River Water Management District (SRWMD). Undated. Springs. https://www.mysuwanneeriver.com/267/Springs

Seidel, V., W. Milon, A. Baker, and C. Diamond. 2015. Economic Impact of the St. Johns Water Quality on Property Values. In: Hacner, C.T (ed). Sr. Johns River Economic Study. Report submitted to the St. Johns River Water Management District under contract#27884.

Shrestha, R. K., T. V. Stein, and J. Clark. 2007. “Valuing Nature-Based Recreation in Public Natural Areas of the Apalachicola River Region, Florida.” Journal of Environmental Management 85: 977–985.

Wu, Q., X. Bi, K. Grogan, and T. Borisova. 2018. “Valuing Recreation Benefits of Natural Springs in Florida.” Water 10 (10): 1379. https://www.mdpi.com/2073-4441/10/10/1379

Peer Reviewed

Publication #FE1100

Release Date:September 24, 2021

Related Experts

Borisova, Tatiana

University of Florida

Bi, Xiang

University of Florida

Grogan, Kelly

Specialist/SSA/RSA

University of Florida

Fact Sheet
General Public

About this Publication

This document is FE1100, one of a series of the Food and Resource Economics Department, UF/IFAS Extension. Original publication date July 2021. Visit the EDIS website at https://edis.ifas.ufl.edu for the currently supported version of this publication.

About the Authors

Fei He, Ph.D. student; Tatiana Borisova, associate professor and Extension specialist; Xiang Bi, former assistant professor; and Kelly Grogan, associate professor, Food and Resource Economics Department, University of Florida

Contacts

  • Kelly Grogan