Introduction
Florida’s environmental horticulture industry, commonly termed the green industry, is comprised of wholesale nurseries, greenhouses, turfgrass sod producers, landscape designers, and construction and maintenance firms. The industry also consists of garden centers, home stores, mass merchandisers (with lawn/garden departments), brokers and re-wholesale distribution centers, and allied trades suppliers of input to the industry. Though there have been fluxes, the environmental horticulture industry in Florida has seen a recovery that has surpassed pre-recession employment, which is also reflected in national employment data for the industry (Hall et al., 2020; Hodges et al., 2017).
This publication summarizes a national mail and online survey taken in mid-2019 to examine the production and marketing practices and trade flows for the Florida ornamental plant grower and dealer firms. The Green Industry Research Consortium, a multi-state research project under the USDA-National Institute for Food and Agriculture (NIFA), conducts a survey of the United States nursery and greenhouse industry every five years. The most recent survey collected information on business practices for the fiscal year 2018–2019 in all 50 states. The full report was published in the Southern Cooperative Series Bulletin #421 (available at https://saaesd.org/wp-content/uploads/2020/08/National-Green-Industry-Survey-Summary-Report-2019-final-08.30.2020-1-2-2.pdf).
Data for the state of Florida have been extracted from the principal study and compared to the two previous survey responses for Florida firms, one in 2014 for the production year 2013 and one in 2009 for the production year 2008. Florida’s nursery and greenhouse firms were identified through the Dun & Bradstreet commercial database, available through the university library system. Questions in the survey asked respondents to indicate the percentage share of the total activity for each specific item. These items included plant types, product forms, irrigation types, advertising budget spent on medias, marketing outlets, sales methods, gross sales activities, and all other items totaling 100 percent. Questions were answered by indicating items on checklists, providing Yes/No answers, filling in open-ended blanks, or rating factors using Likert scales or sliders. Results of the 2008 and 2013 national survey were published as Southern Cooperative Series Bulletins #404 and #420, available at https://saaesd.org/bulletins/.
This publication documents changes in business practices over time and provides useful information to industry stakeholders. It lists types of plants and product forms grown in Florida, labor practices, irrigation methods, water sources, and pest management strategies, along with marketing practices (distribution channels, selling methods, in-store advertising practices, and social media presence), and a range of factors affecting pricing strategies and overall business growth and business opportunities. This publication also expands its focus from past surveys to include information on point-of-sale (POS) and digital marketing strategies.
General Characteristics
The survey was completed by 433 firms: 50 dealers, 268 growers, 58 dealer/growers, and 57 unspecified. Three hundred and eight firms (71percent) completed the survey through the online instrument. One hundred and twenty-five firms (29 percent) completed a printed survey sent in the mail. It is important to note that the findings presented in this report apply only to the 433 respondents to the survey. Respondents were across the entire state of Florida. They have not been expanded in any way to represent the entire industry in the state.
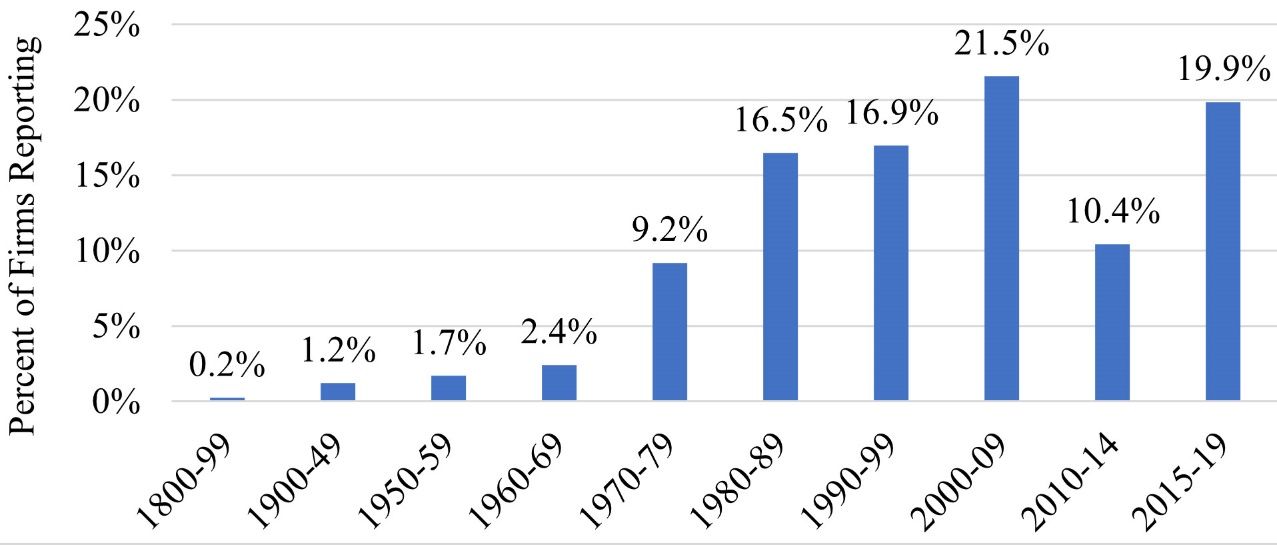
As shown in Figure 1, most of the firms that answered the survey were established between 1980–2019. Approximately 14 percent of firms were established before 1980. Twenty percent of firms were established between 2015–2019, 10 percent between 2010–2014, 22 percent between 2000–2009, 17 percent between 1990–1999, and 17 percent that were established between 1980–1989.
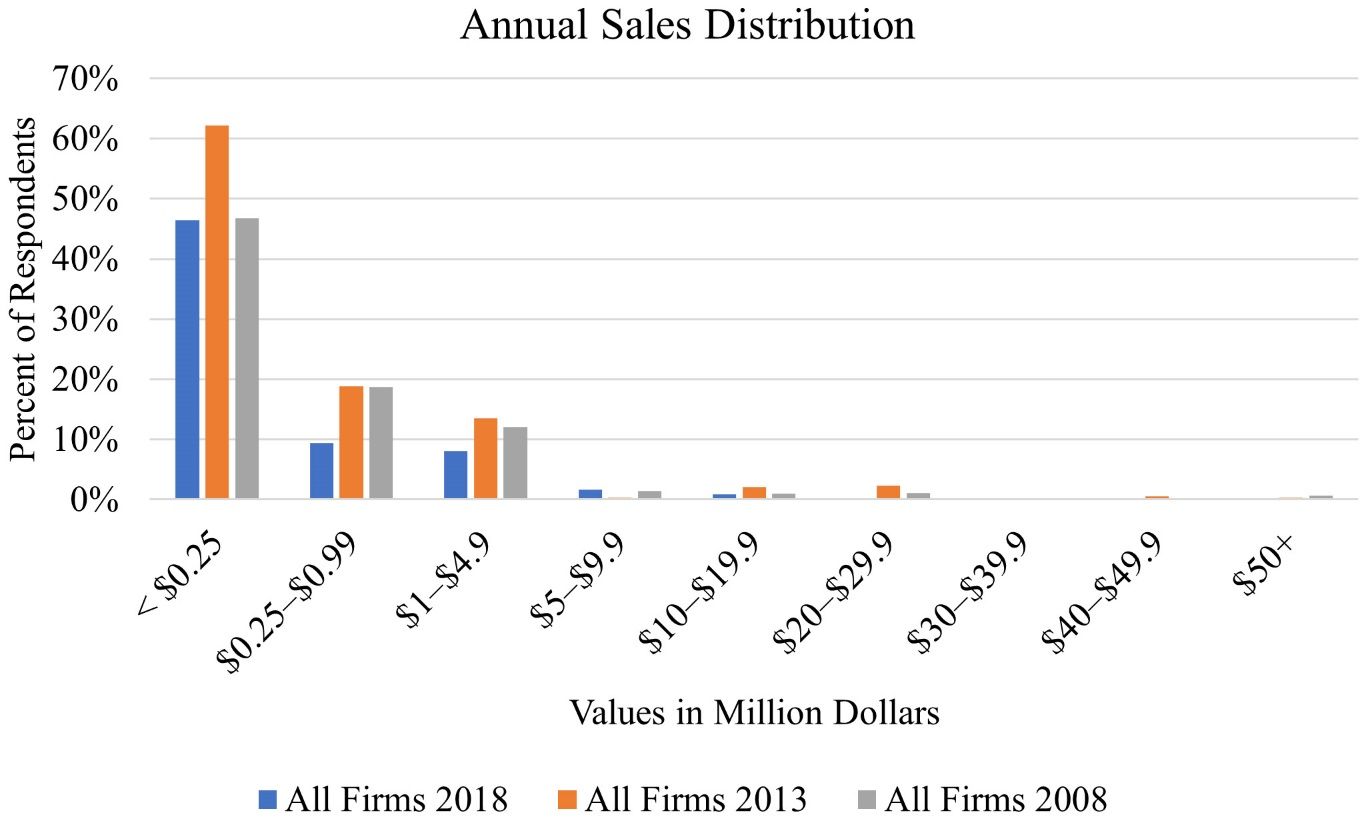
Annual sales were reported in the survey either as a specific amount or as a range, from less than $250,000 to more than $50 million (Figure 2). A little under half of the responding firms (46.4 percent) had less than $250,000 annual sales while 9.5 percent of firms had sales between $250,000 and $999,999. Approximately 8 percent of firms have between $1 to $4.9 million in sales and 2.8 percent have sales above $5 million.
From the distribution of firms in the 2013 survey, some firms have shifted to greater sales while some many have decreased in 2018. Fewer firms are in the $250,000 to $990,000 annual sales range than in the previous ten years by a small percentage, even though comparing to 2013 there appears to be a large drop in the number of firms acquiring sales less than $250,000. There are fewer firms in the $250,000 to $999,999 and $1 million to $4.9 million annual sales ranges than in 2008 and 2013. The percentage of firms above $5 million is approximately the same across the span of time.
Annual sales for 2018 totaled $447 million and averaged $1.03 million per firm. Sales through wholesale market channels totaled $419 million (93.1 percent) and averaged $1.56 million per firm, while sales at retail totaled $28 million (6.2 percent) and averaged $0.1 million per firm (Figure 3).

Employees
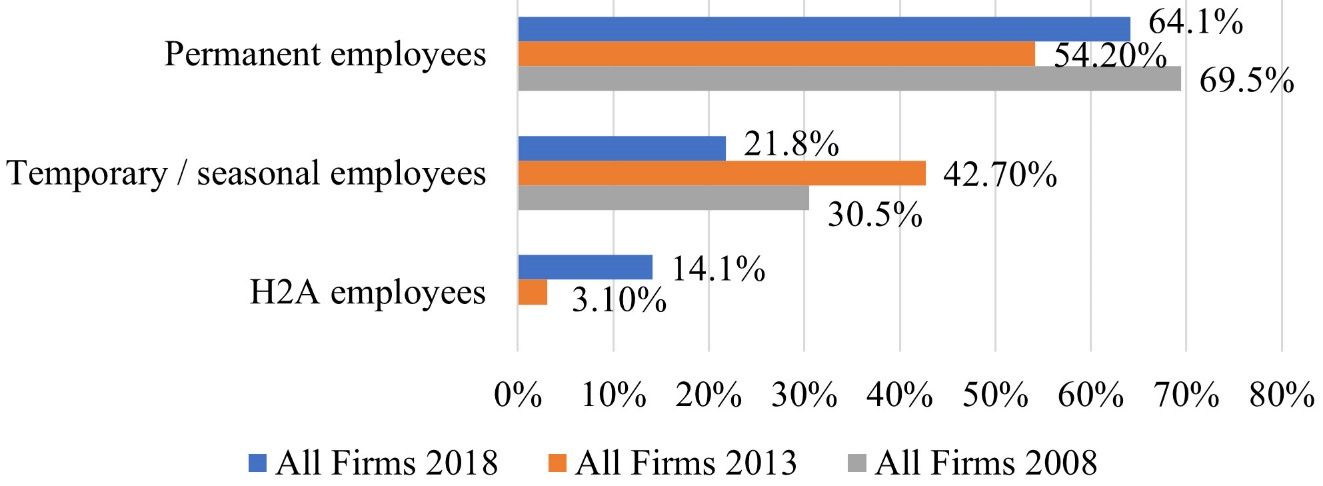
Overall, the 433 firms employed 9,190 employees. From 2008 to 2013 the number of permanent and temporary employees decreased by 5 percent and 10 percent (Figure 4). In 2013, there was a decrease in the number of permanent employees, but the reported number of employees for 2018 increased by 10 percent. Temporary employees increased from 2008 to 2013 but decreased again from 2013 to 2018. The average number of permanent employees per firm is 29.1 employees. The average number of temporary employees per firm is 34.1 employees. The reported number of foreign national employees authorized to work in the United States under the H2A visa program tripled from 3.1 percent in 2013 to 14.1 percent in 2018 (H2A not included in 2008 survey).
Looking at the percentage of change from 2013 to 2018, nearly three-fourths of firms, 72 percent, kept the same number of permanent employees while 18 percent of firms had an increase, and 10 percent saw a decrease in the number of permanent employees in their firm as shown in Figure 5.

The same trend of change in permanent employees held true with temporary/seasonal employees. Most firms, 76 percent, kept the same number of temporary or seasonal employees from 2013 to 2018; 16 percent had an increase, and 8 percent had a decrease in the number of temporary employees (Figure 6).

Plant Types Sold
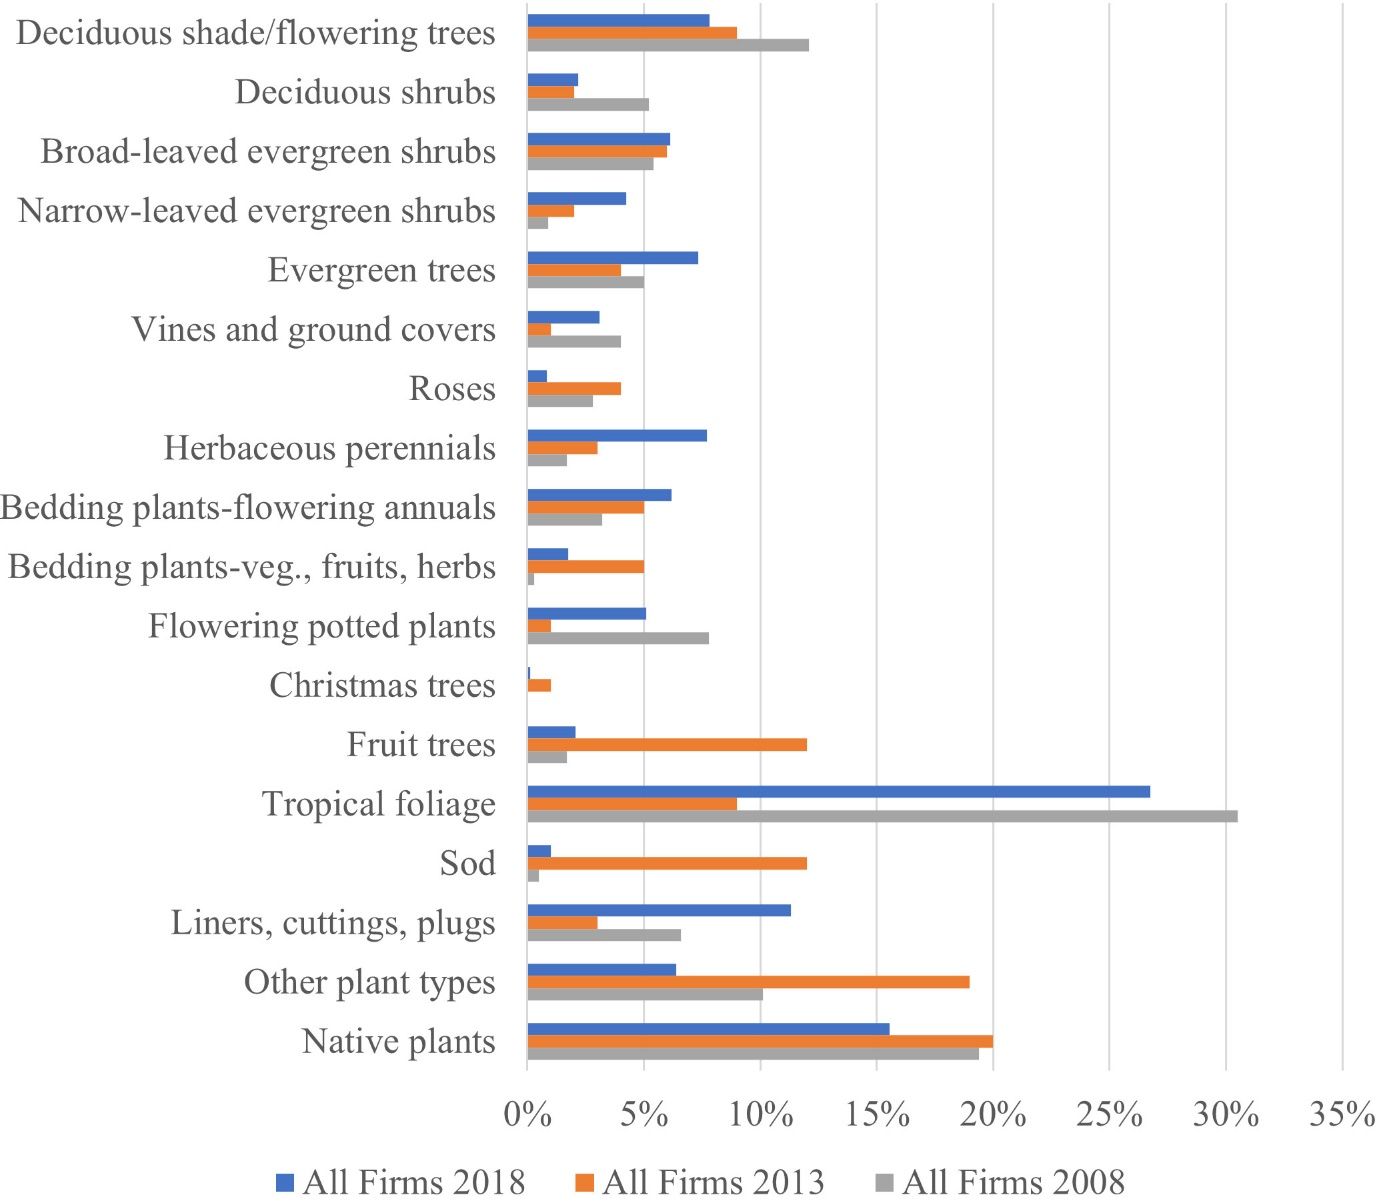
The distribution of eighteen major ornamental plant types sold in 2018 by Florida green industry firms is summarized as the share of total sales reported in Figure 7. The top two plant categories in 2018 are tropical foliage plants (26.7 percent) and liners, cuttings, and plugs (11.3 percent). The second tier of plant types included deciduous shade/flowering trees (7.8 percent), flowering potted plants (5.1 percent), bedding plants (flowering annuals) (6.2 percent), herbaceous perennials (7.7 percent), evergreen trees (7.3 percent), and broad-leaved evergreen shrubs (6.1 percent). The third tier of plant types sold in Florida include sod (1.0 percent), fruit trees (2.1 percent), Christmas trees (0.1 percent), bedding plants (vegetables, fruits, herbs) (1.7 percent), roses (0.8 percent), vines and ground covers (3.1 percent), narrow-leaved evergreen shrubs (4.2 percent), and deciduous shrubs (2.2 percent).
The types of plants sold have changed slightly over the past ten years. In 2008, tropical foliage plants were the dominate type of plant, but this dramatically decreased in 2013. In 2018, tropical foliage plants are again the top plant category in sales. Liners, cuttings, and plugs; flowering potted plants; vines and ground covers; and evergreen trees have also seen this u-shaped curve in sales. Bedding plants—flowering annuals, herbaceous perennials, narrow-leaved evergreen shrubs, and broad-leaved evergreen shrubs—have seen incremental increases in sales from 2008 to 2018. Other plant types (plant types not listed exclusively on the survey such as cut ferns and cut greens), sod, fruit trees, and roses all saw inverse u-shaped curves. Some categories saw decreases from 2008 to 2018. Deciduous shade/flowering trees had an incremental decrease in sales from 2008 to 2018.
Native plants are commonly defined as plants that were present in a state or local area before European settlement. In recent years, there has been increasing emphasis on using native plants for landscaping because they are well adapted to the prevailing environmental conditions, and generally require less maintenance will not become invasive. Approximately 15 percent of Florida firms’ sales are in native species. This is a slight decrease from 2008 and 2013 where native plant sales consisted of 19.4 percent and 20 percent of sales.
Product Forms
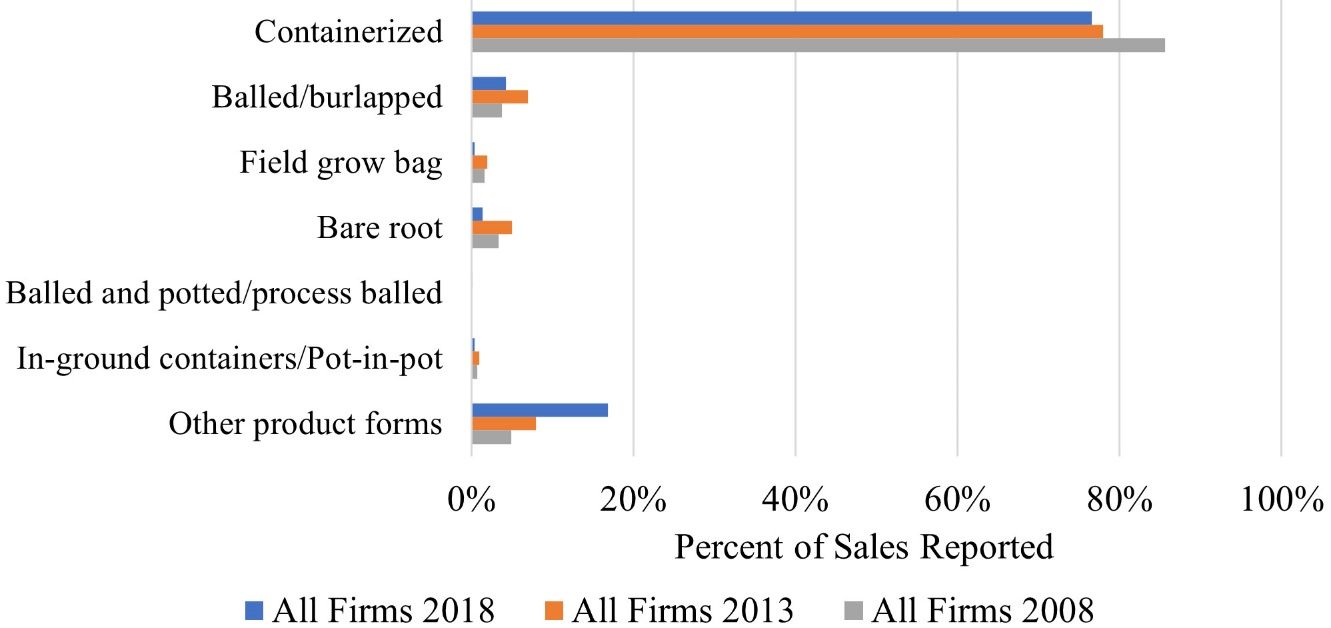
Respondents were asked to indicate the percentage distribution of their sales by product form (root packaging media), including containerized, balled and burlapped, field grow bag, bare root, balled and potted/process balled, in-ground containers (including pot-in-pot), and other types (e.g., cut trees, budwood, scions, seeds, tissue culture plantlets, and unrooted cuttings). Most product form sales in 2018 were containerized (76.6 percent) as shown in Figure 8. The rest of the product forms fell well below containerized with balled/burlapped consisting of 4.2 percent, field grow bag at 0.4 percent, bare root consisting of 1.4 percent, balled and potted/process balled at 0.2 percent, in-ground containers/pot-in-pot consisting of 0.4 percent, and other product forms (e.g., cut trees, budwood, scions, seeds, etc.) consisting of 16.8 percent of sales. Yet the containerized products category has been decreasing over time. Other product forms—the second most popular product form in 2018—has seen a steady increase from under 10 percent in 2008 to nearly 20 percent in 2018.
Markets and Marketing Channels
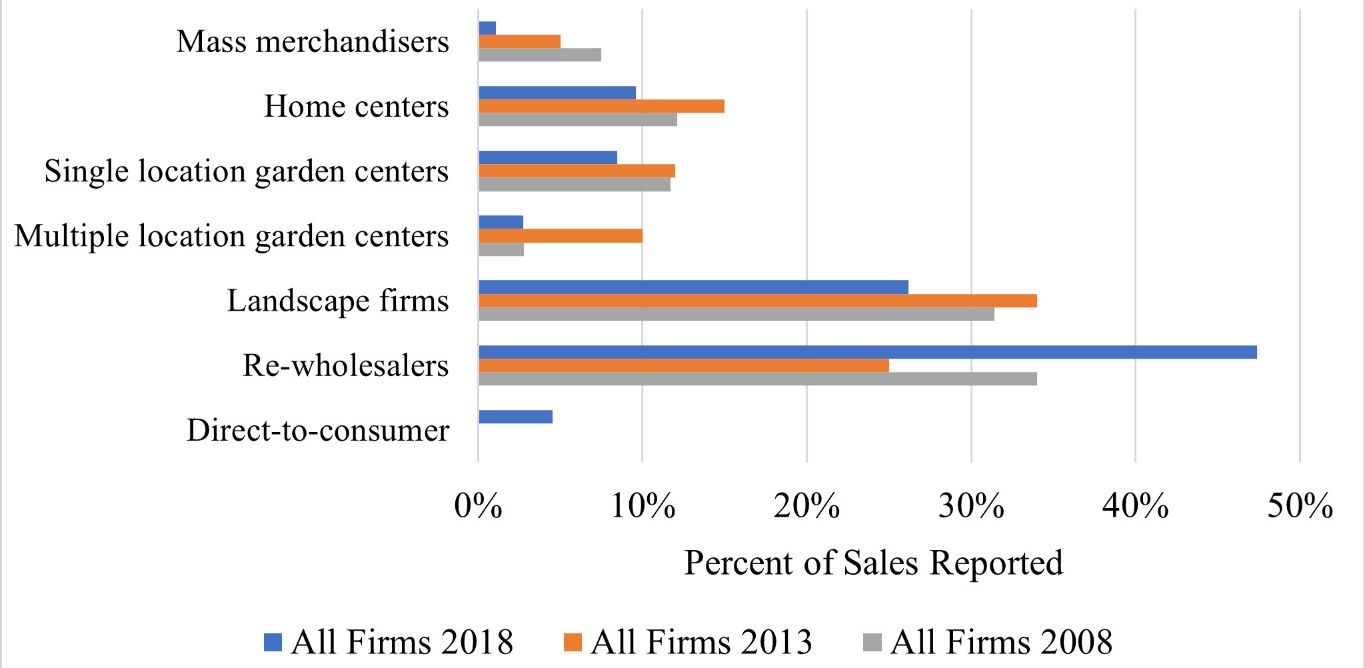
Respondents were asked to specify the percentage of total sales to different wholesale market outlets including mass merchandisers, home centers, single location garden centers, multiple location garden centers, landscape firms, re-wholesalers, and other outlets. Most firms sell their products through the re-wholesale market channel (47.4 percent) (Figure 9). This channel is followed in decreasing order by landscape firms (26.2 percent), home centers (9.6 percent), single location garden centers (8.5 percent), direct-to-consumer (4.5 percent), multiple location garden centers (2.8 percent), and mass merchandisers (1.1 percent). Landscape firms, multiple location garden centers, single location garden centers, and home centers all saw an inverse u-shaped curve in sales from 2008 to 2018. In fact, each of these categories saw a decrease in overall sales from 2008 to 2018. Mass merchandisers had a decrease from 8 percent in 2008 to 1 percent in 2018. This is the first year the survey has included direct-to-consumer as a market channel option. Direct-to-consumer sales accounted for approximately 5 percent of total sales. This category could continue to increase as technology becomes more widely used by consumers and the green industry begins to be visible on more channels.
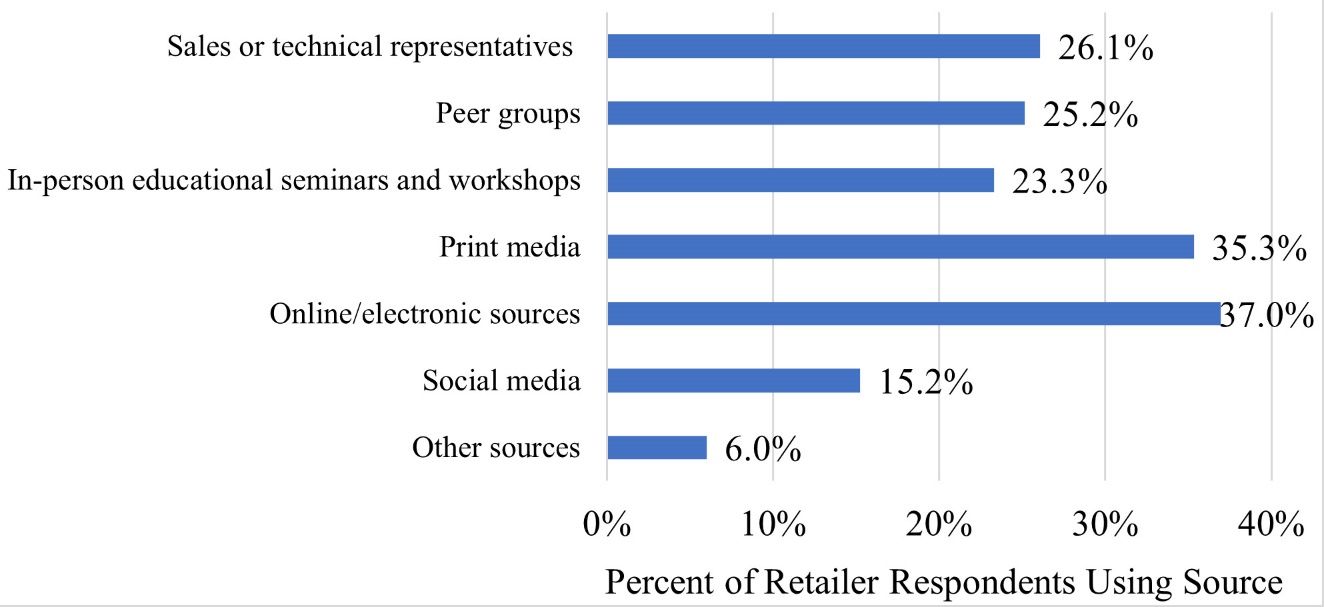
This report is the first in the series of the green industry surveys that incorporated information about use of social media platforms by retail nursery and garden centers. With generally increased reliance on consumer data analytics and predictive modeling in consumer goods sectors, green industry firms are gradually increasing their online presence and digital marketing strategies to attract more customers and retain their existing customer base. Online/electronic data are the number one source of customer demographic information for firms (37 percent). A close second is print media (35.3 percent). Approximately 25 percent of firms get their customer demographic information from sales or technical representatives, peer groups, and in-person education seminars and workshops. Fifteen percent of firms use social media as a source for their customer demographics. Six percent use other sources (Figure 10).
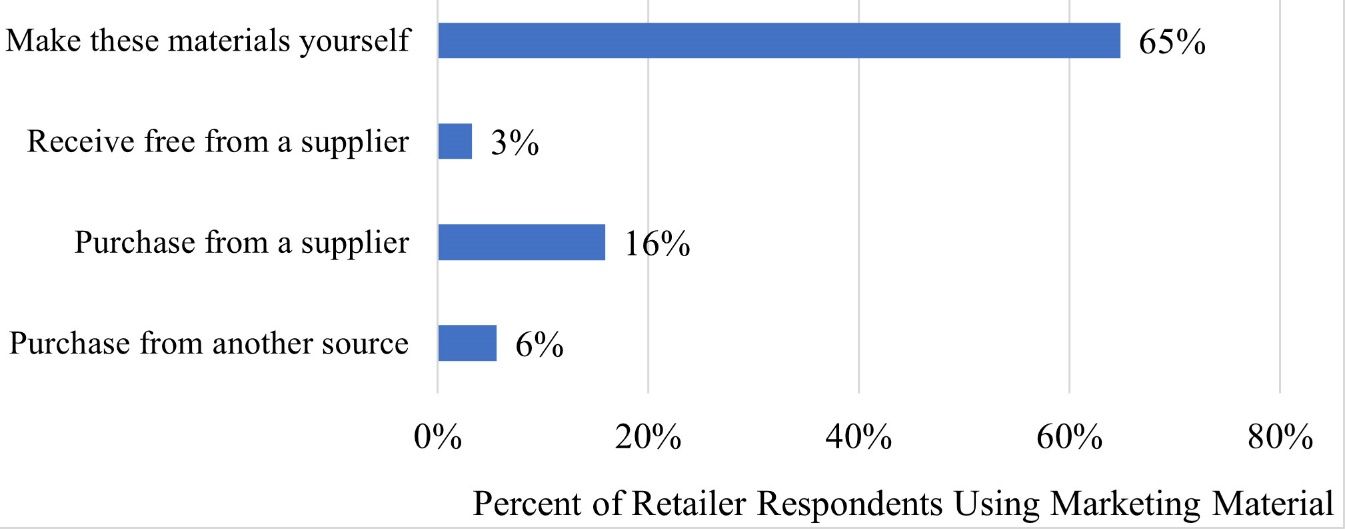
When it comes to sourcing marketing materials used by firms, most firms, 65 percent, create the materials themselves (Figure 11). Sixteen percent of firms purchase from a supplier, while 6 percent purchase from another source, and 3 percent receive the materials free from a supplier.
Sales Methods and Marketing Practices
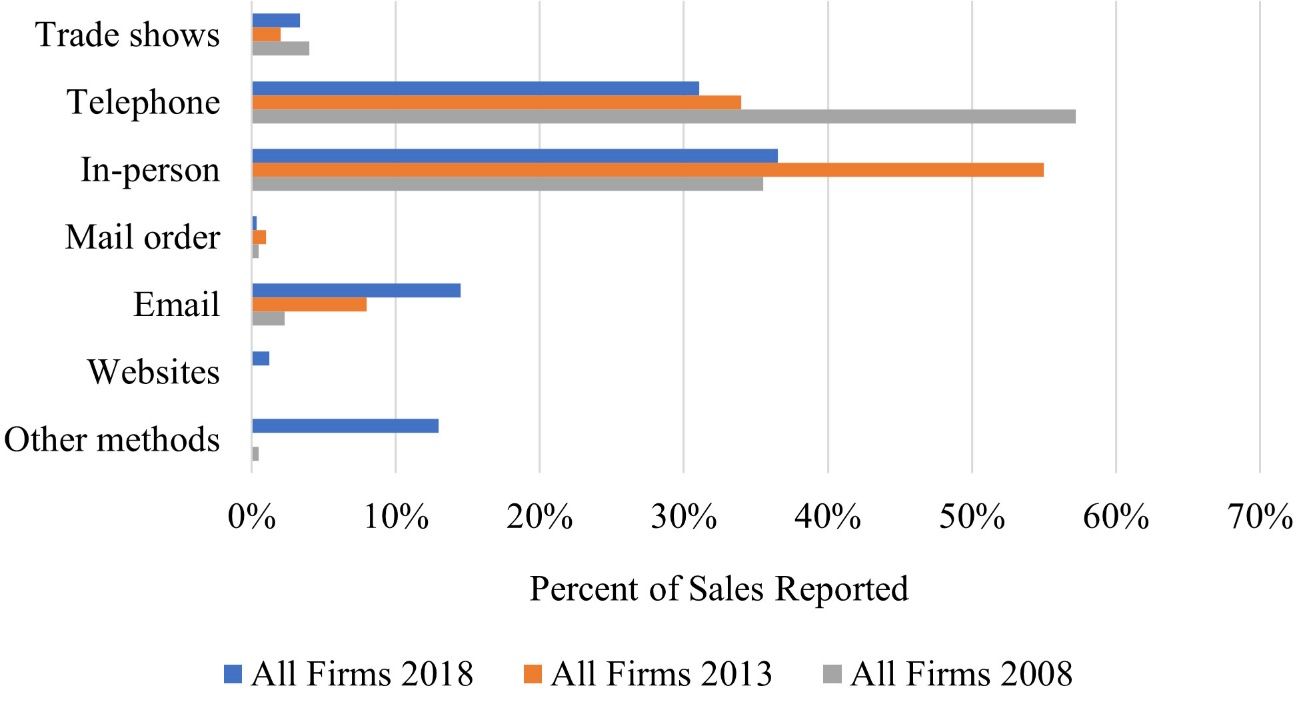
Respondents were asked to indicate the percentage of annual sales attributable to various transaction methods, including trade show orders, telephone orders, in-person orders, mail orders, website orders, email orders, and other types. The top transaction method (by sales) in 2018, as shown in Figure 12, was in person (36.5 percent) followed closely by telephone (31.1 percent). The second tier of transaction methods includes email (14.5 percent) and other methods (13.0 percent). The third tier, consisting of less than 5 percent of firms’ sales consists of internet/website sales (1.2 percent), mail orders (0.3 percent), and trade shows (3.3 percent). When looking at the trends, though, telephone sales have decreased from nearly 60 percent in 2008 to 31 percent in 2018. Mail order, in person, and trade shows remained relatively the same from 2008 to 2018 with u-shaped curves in 2013. Other methods and email transactions increased from 2008 to 2013.
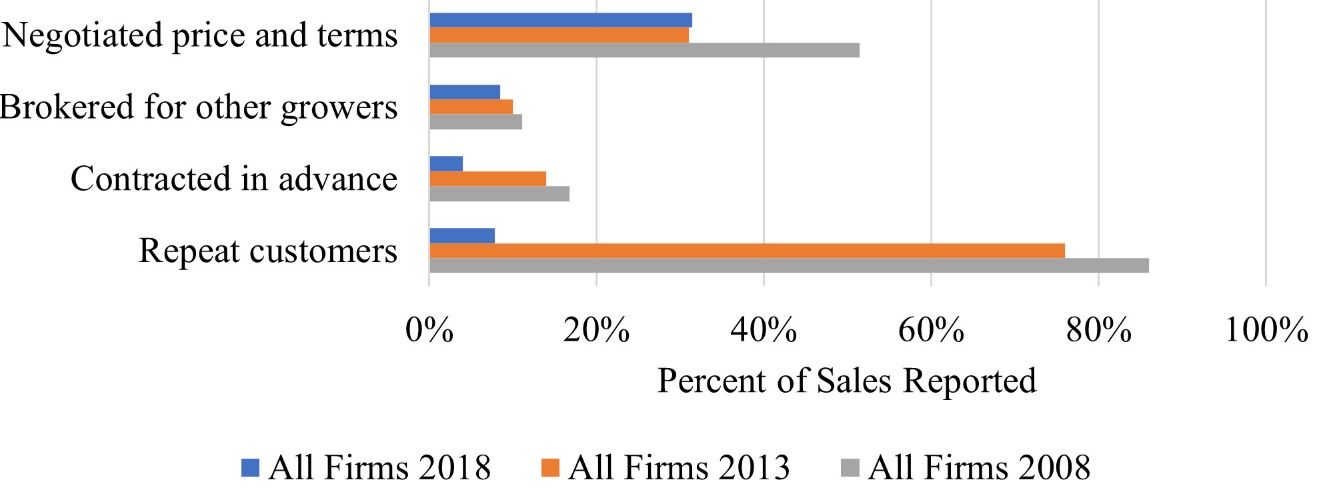
Survey results for several common marketing practices are shown in Figure 13. Marketing practices saw an interesting transition. In 2018, negotiating price and terms was the most-used market practice (31.4 percent). Repeat customers, which used to be the most-used marketing practice, sharply decreased in 2018 to one of the least-used practices (7.8 percent). Brokering for other growers and contracting in advance were used by 8.5 and 4.0 percent of firms. Each of the marketing practices was used less from 2008 to 2018, indicating that either firms were not doing as much marketing or using as much of the practices, or the practices were not captured within the constraints of the survey.
Forward contracting is an important marketing practice that many producers use as a risk management tool. Forward contract sales accounted for 19 percent of the overall sales in the United States in 2018 (Figure 14). The most common type of buyer for forward contracting was other producers (11.6 percent) and other buyers (8.6 percent). Retail garden centers (3.0 percent), mass merchandisers (1.5 percent), and cooperatives (0.7 percent) were lesser used contracting buyers.

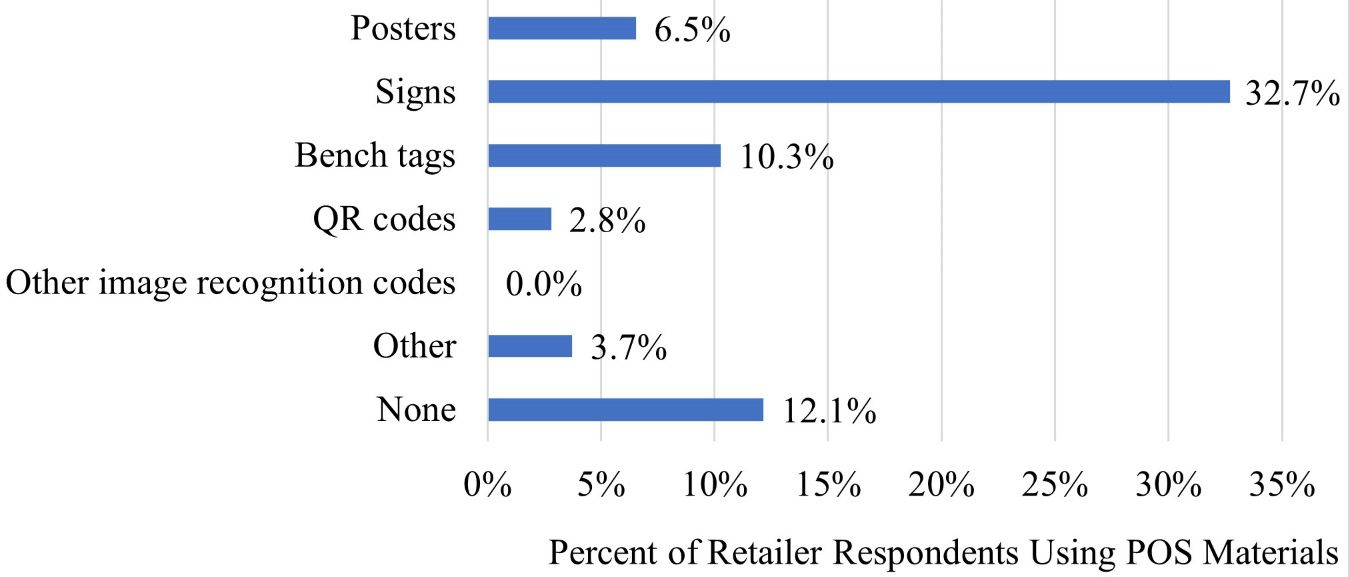
The development and effective use of POS informational and advertising materials is another key component of the marketing practices toolkit used by green industry retail firms. Survey participants were asked to indicate the type of POS materials used in retail stores (Figure 15). The greatest number of firms (32.7%) used conventional signs as POS material. This was followed by 10.3 percent of firms who used bench tags, 6.5 percent who used posters, 3.7 percent who used other materials, and 2.8 percent of firms who used QR codes as POS materials. Twelve percent of firms did not use POS materials.
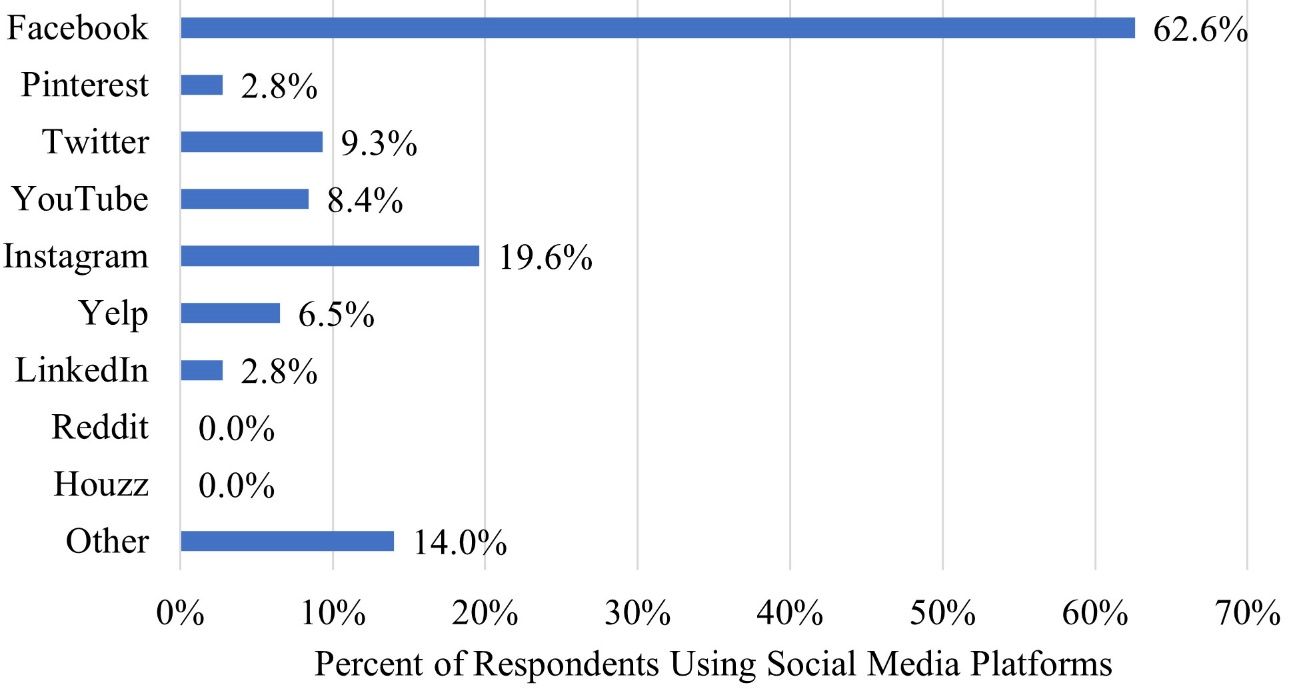
With generally increased reliance on consumer data analytics and predictive modeling in consumer goods sectors, Florida green industry firms have gradually increased their online presence and digital marketing strategies to attract more customers and retain their existing customer base. One such digital marketing strategy was using social media (Figure 16). Facebook was the most popular social media platform used by firms (62.6 percent) followed by Instagram (19.6 percent) and other platforms (14.0 percent). Other platforms that firms used include Twitter (9.3 percent), YouTube (8.4 percent), Yelp (6.5 percent), Pinterest (2.8 percent), and LinkedIn (2.8 percent). None of the Florida green industry firms used Reddit or Houzz.
Advertising Expenditures
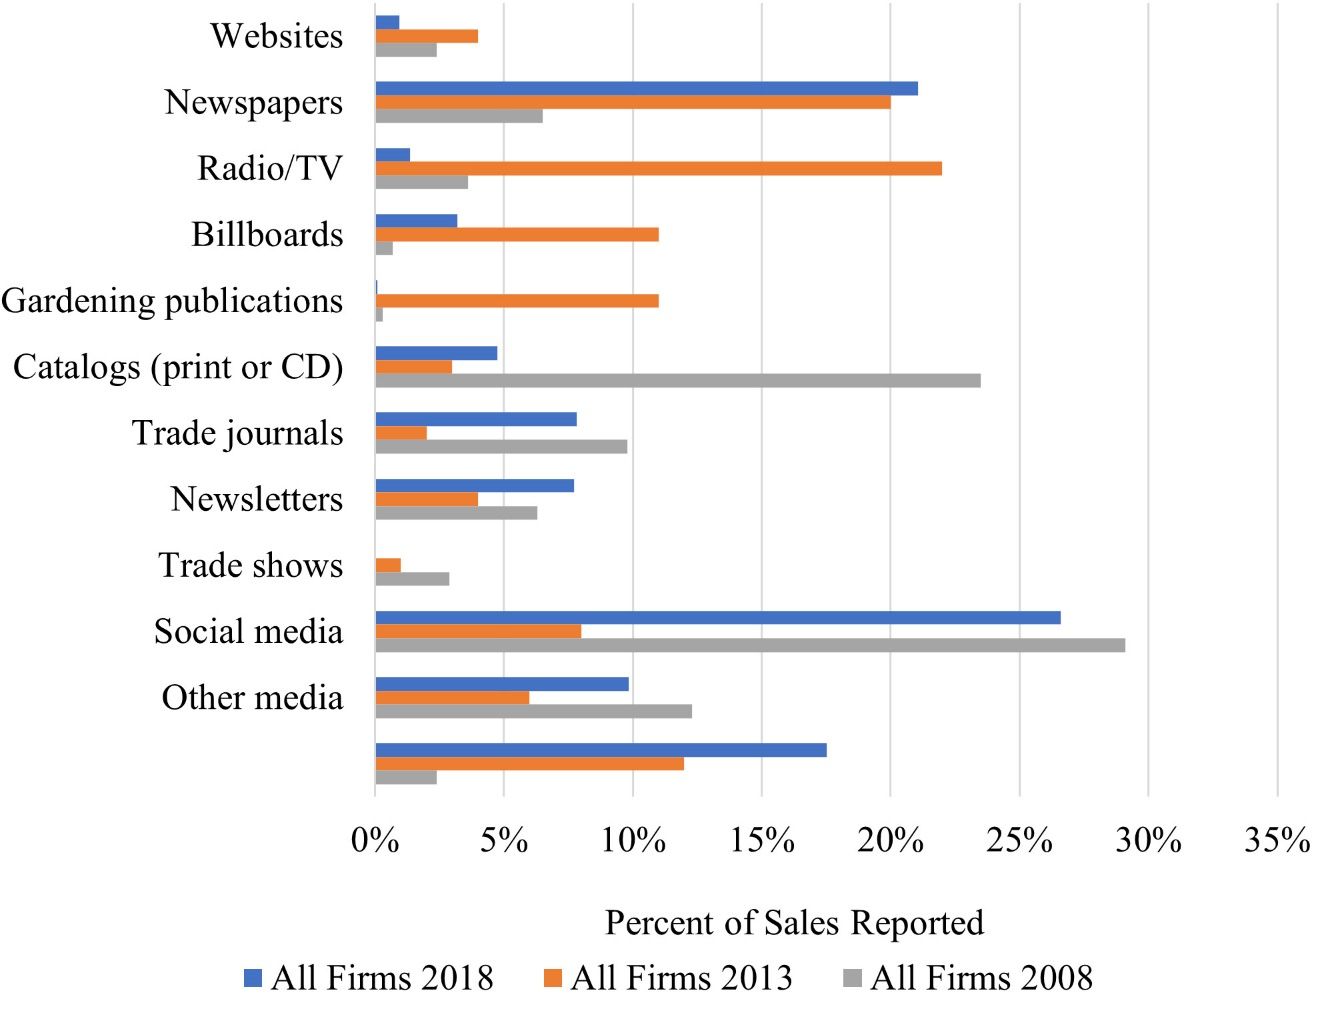
Respondents were asked to report the percentage of their total sales allocated to advertising and the percentage of their advertising budget spent on various media forms (Figure 17). Trade shows (26.6 percent), websites (21.1 percent), and “other media” forms (17.5 percent) were the top advertising media expenditures in 2018 (Figure 17). Lesser-used medias include social media (9.8 percent), trade journals (7.7 percent), catalogs (print or CD) (7.8 percent), gardening publications (4.8 percent), billboards (0.1 percent), radio/tv (3.2 percent), and newspapers (1.4 percent). None of the reporting firms use newsletters as an advertising media.
“Other media” forms have increased over time from 4 percent in 2008 to 12 percent in 2013 and to 17 percent in 2020. Social media, trade shows, trade journals, and catalogs (print or CD) all show a u-shaped curve with a slight overall decrease from 2008 to 2018, except for trade journals (slight increase). Newsletters decreased over time from 4 percent in 2008 to under 1 percent in 2018. Garden publications substantially decreased from 24 percent in 2008 to approximately 5 percent in 2018. There was a significant increase in the advertising expenditures for billboards, radio/tv, and newspapers in 2013, but overall for the full 10-year period from 2008 to 2018, billboards showed no change in expenditures; radio/tv showed a slight increase; and newspapers showed a slight decrease. Expenditures spent on websites increased over time from 6 percent in 2008 to 20 percent in 2013 and 21 percent in 2018.
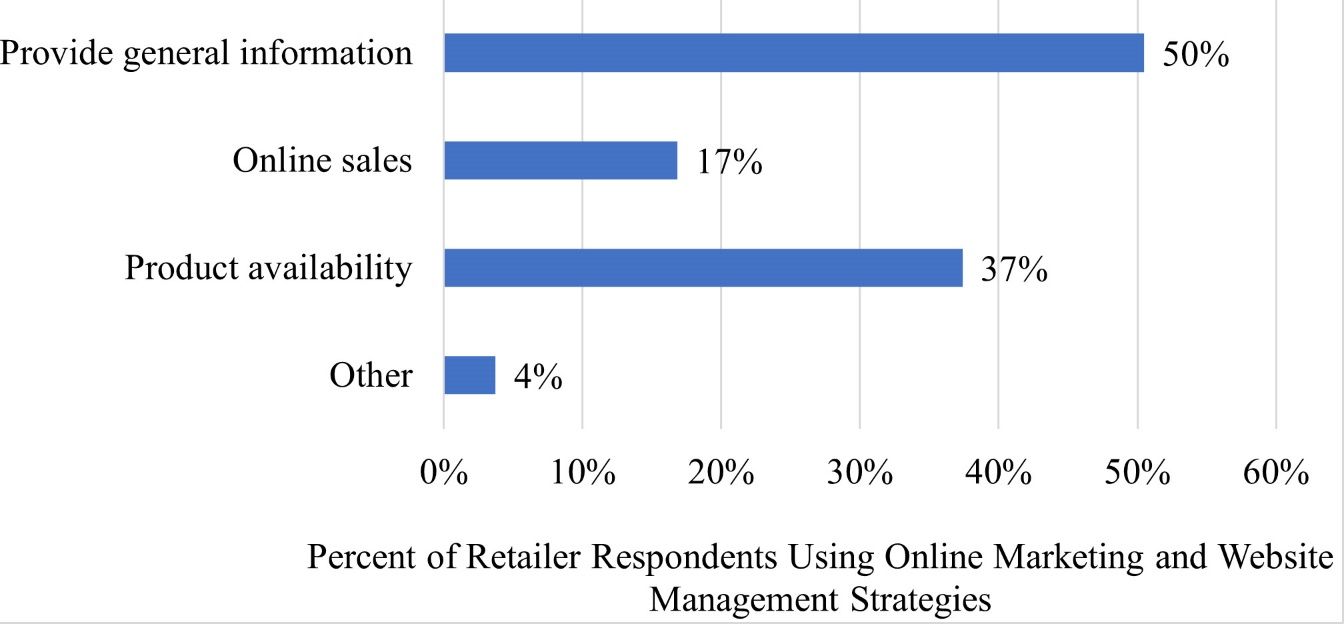
With increasing online presence of producer and retailer firms across all agricultural sectors, the Florida green industry is gradually incorporating transactions using website-based tools into their business practices. Green industry firms primarily have used their websites for providing general information about their business and products (50 percent) (Figure 18). Thirty-seven percent of firms used their website to show their product availability, and 17 percent had online sales. Four percent of firms indicate they used their website for other purposes.
Integrated Pest Management Practices
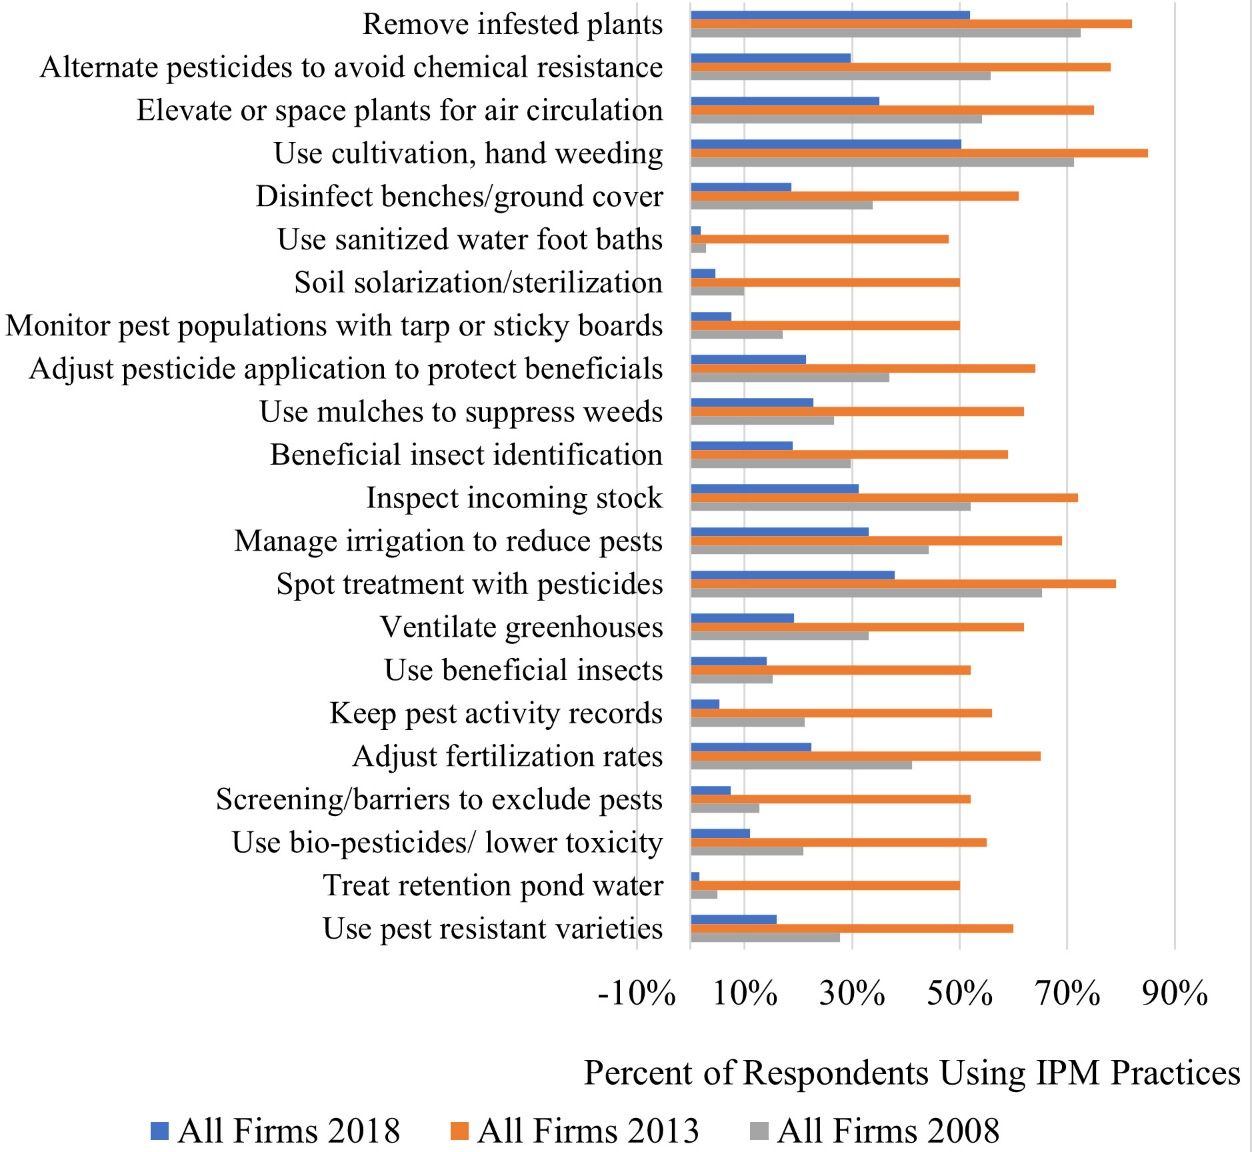
Green industry firms routinely use integrated pest management (IPM) as part of their Best Management Practices that seek to minimize the application of chemicals, decrease disease/pests, and reduce impacts on beneficial insects or non-pest organisms. Respondents were asked to select from a list of 22 possible IPM practices that they routinely follow. The percentages of green industry firms who reported using these practices are shown in Figure 19. The top tier of practices include 52 percent of Florida firms who remove the infested plant as part of their pest management strategy and 50 percent of firms who hand weed or use cultivation. Thirty-eight percent of firms spot treat using pesticides. The second tier of practices used includes applying alternative pesticides to avoid chemical resistance (29.8 percent), elevating or spacing plants for air circulation (35.1 percent), inspecting incoming stock (31.2 percent), and managing irrigation to reduce pests (33.0 percent). The third tier of pest management practices implemented by firms include disinfecting benches/ground cover (18.7 percent), adjusting pesticide application to protect beneficials (21.5 percent), using mulches to suppress weeds (22.9 percent), employing beneficial insect identification (18.9 percent), ventilating greenhouses (19.2 percent), adjusting fertilization rates (22.4 percent), and using pest-resistant varieties (15.9 percent). Practices that less than 15 percent of firms use include using sanitized water foot baths, employing soil solarization/sterilization, monitoring pest populations with tarp or sticky boards, using beneficial insects, keeping pest activity records, using screening/barriers to exclude pests, using bio-pesticides/lower toxicity pesticides, and treating retention pond water. These were also the top strategies in 2008 and 2013. From 2008 to 2018, all the potential pest-management strategies are being used less.
Water Sources and Irrigation Methods
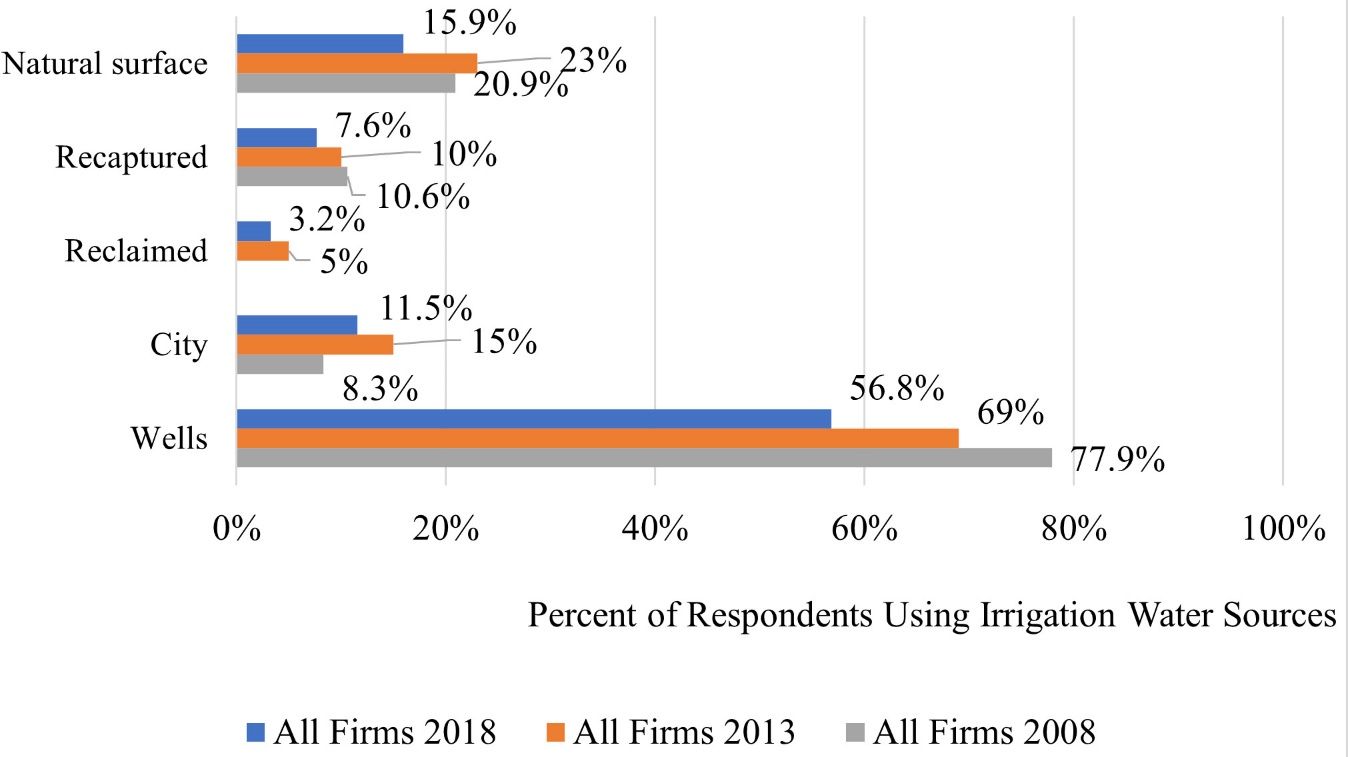
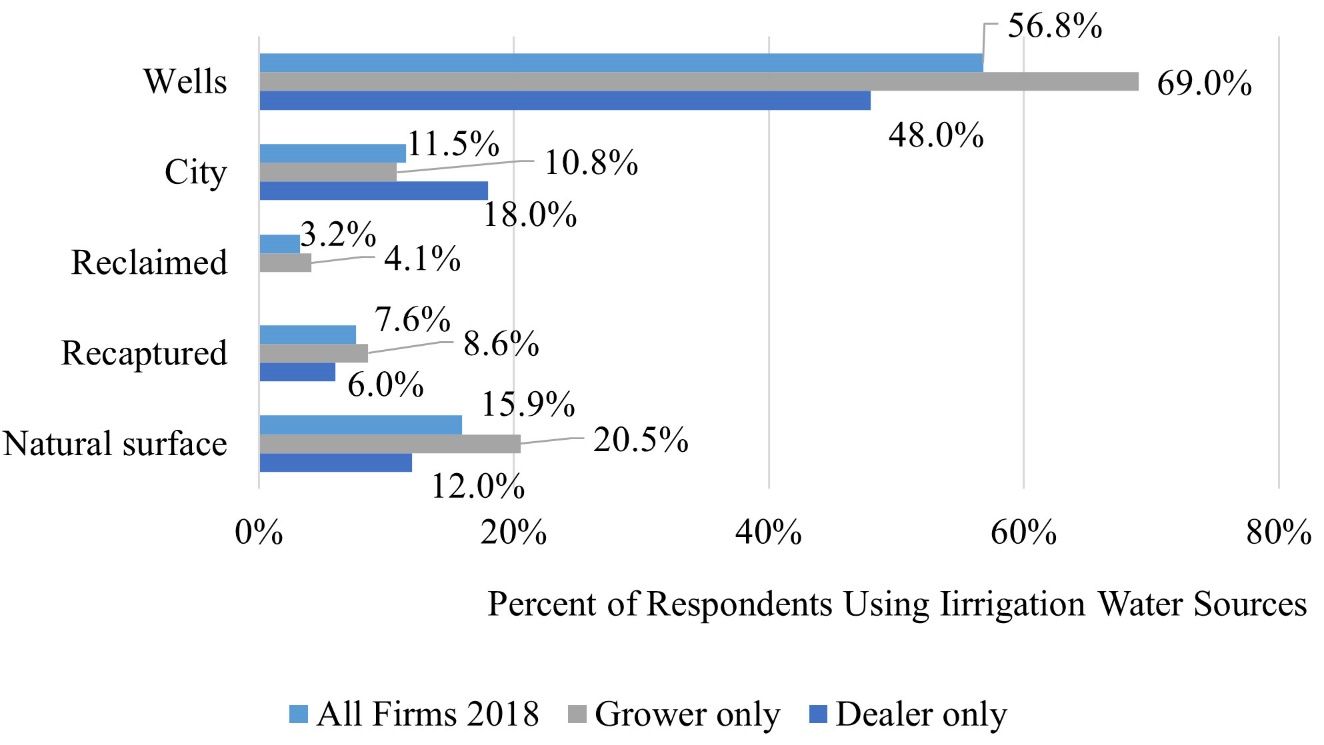
Respondents were asked to indicate the percentage of water used for irrigation that was obtained from the following sources: natural surface, recaptured sources, city (municipal) water supplies, and groundwater wells. Overall, 56.8 percent of firms indicated that well water was their water supply source (Figure 20). This was also true for 2008 and 2013. Approximately 16 percent of firms indicated that natural surface water was their source of supply in 2018 while 7.6 percent of firms reported they used recaptured water, and 3.2 percent of firms indicated their water came from reclaimed water sources. Firms have decreased usage of all three water sources over time. The percentage of firms that indicated that city water was their water supply increased to 11.5 percent from 2008.
When assessing by the type of firm in 2018, 69 percent of growers use well water, 4.1 percent use reclaimed water, 8.6 percent use recaptured water, and 20.5 percent use natural surface water (Figure 21). Forty-eight percent of dealers use well water, 18 percent use city water, none use reclaimed water, 6.0 percent use recaptured water, and 12.0 percent use natural surface water. Well water is the dominant source used for both growers and dealers. Dealers use more city water supply (18 percent) than growers (10.8 percent).
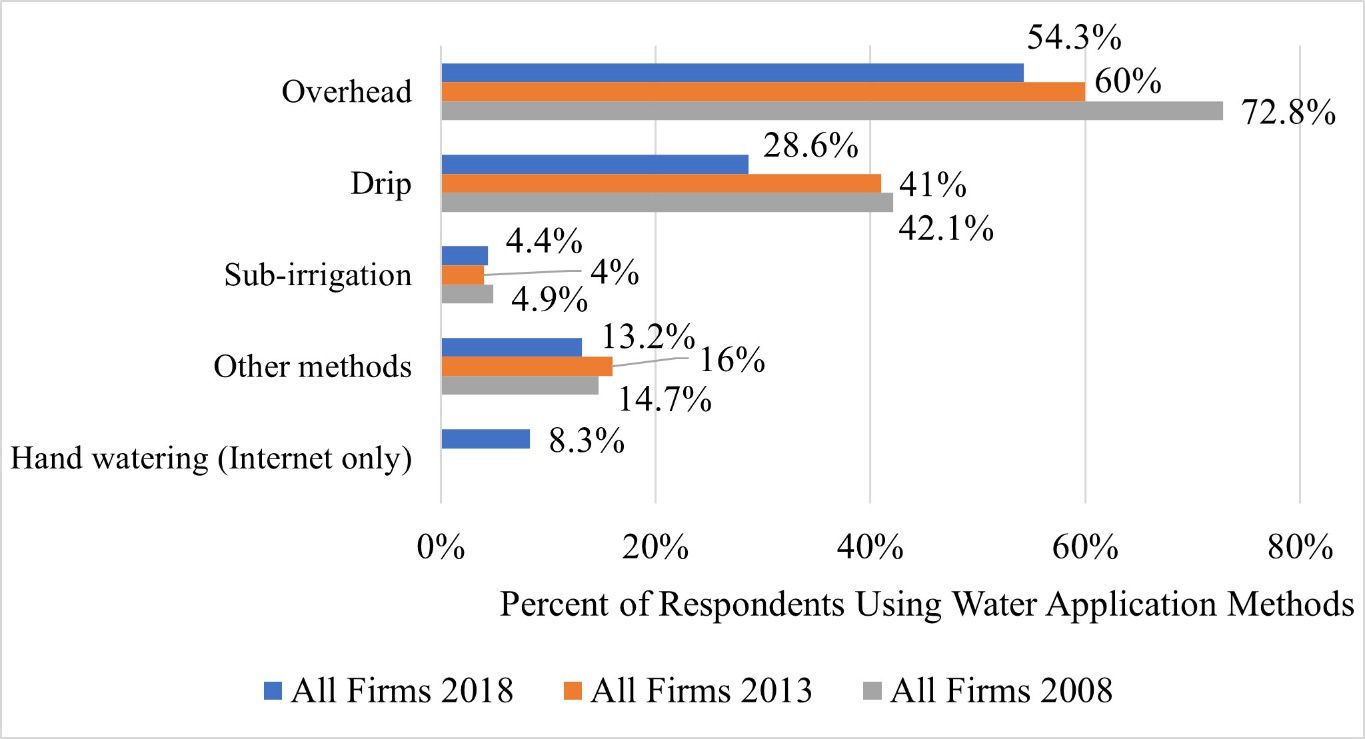
Survey respondents were also asked about irrigation water application methods used, including overhead sprinklers, drip, sub-irrigation (ebb/flood), hand watering, and other methods (Figure 22). Overhead watering (54.3 percent) is the most-used water method followed by drip irrigation (28.6 percent), other methods (13.2 percent), hand watering (8.3 percent), and, lastly, sub-irrigation (4.4 percent). The usage of overhead irrigation and drip irrigation has decreased over time from 2008. The usage of sub-irrigation and other methods has maintained the same from 2008 to 2018.
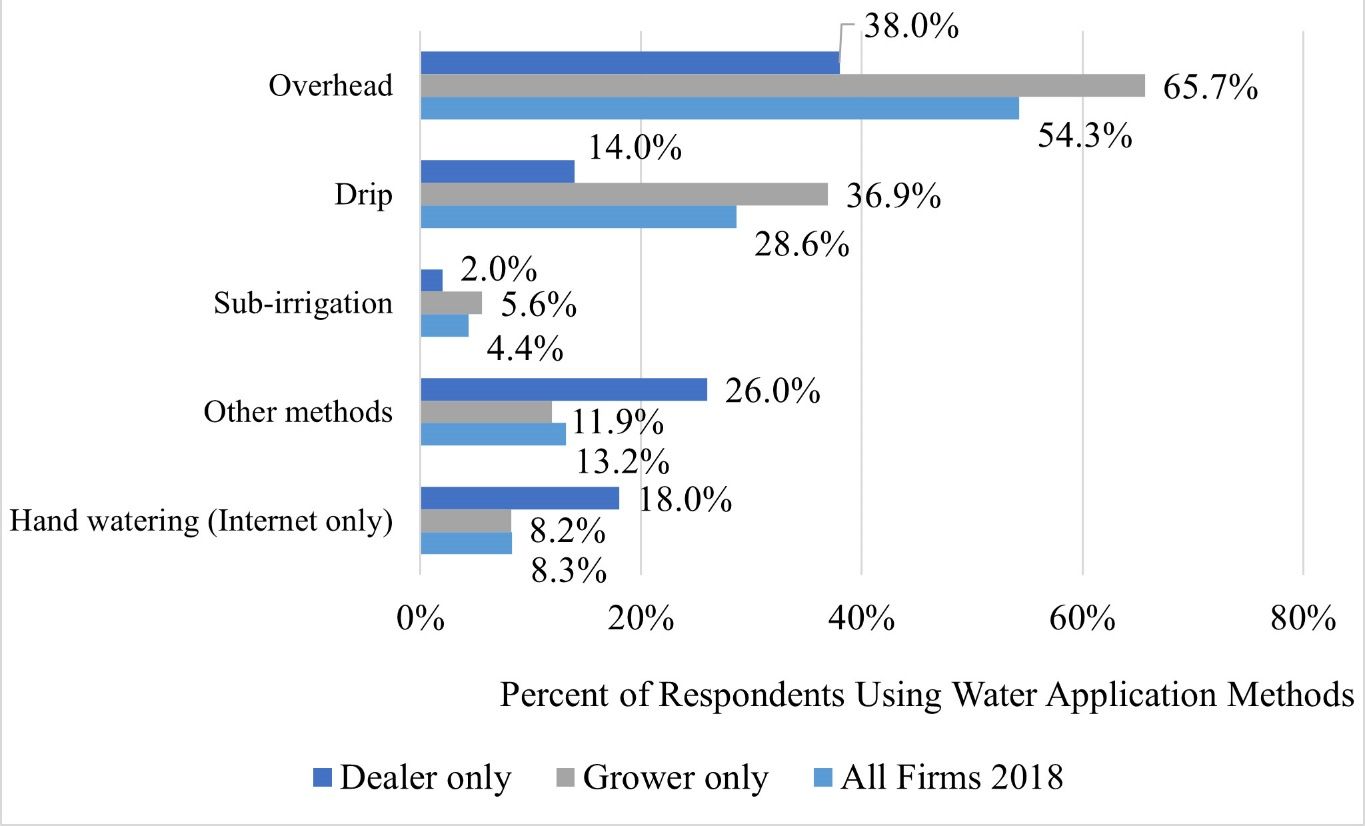
When comparing growers and dealers in 2018, growers did more overhead (65.7 percent versus 38.0 percent) and drip irrigation (36.9 percent versus 14.0 percent) than dealers (Figure 23). Dealers engaged in more sub-irrigation watering (5.6 percent versus 2.0 percent), hand watering (18.0 percent versus 8.2 percent), and other irrigation methods (18.0 percent versus 8.2 percent) than growers. Overall, overhead watering was the dominant watering method by both growers and dealers.
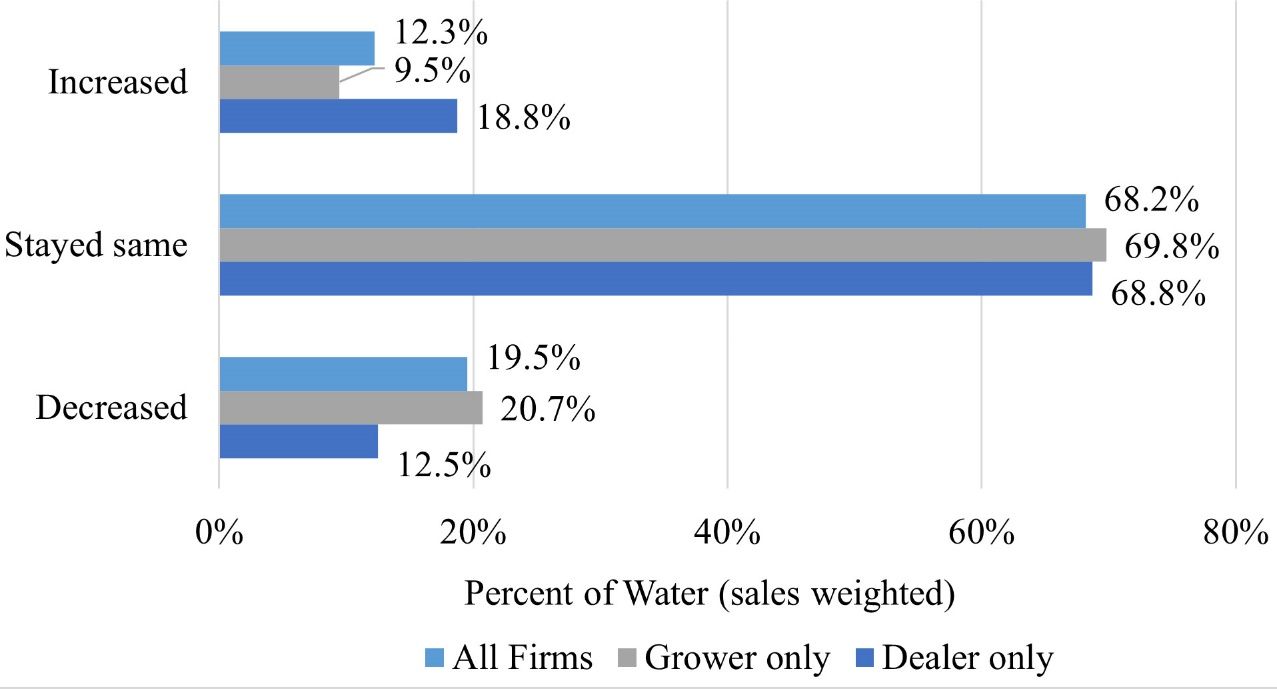
Trends over time in water use for irrigation are important for measuring efforts toward resource conservation in the industry. On average, 12.3 percent of firms increased in their water usage from 2013 to 2018 (Figure 24). Dealers increased their water usage more than growers did (18.8 percent versus 9.5 percent). Sixty-eight percent of firms used the same amount of water from 2013 to 2018 whether they were a grower or a dealer. Approximately 20 percent of firms decreased their water usage with slightly more growers decreasing their water usage than dealers (20.7 percent versus 12.5 percent).
Factors Affecting Price, Geographic Expansion and Business
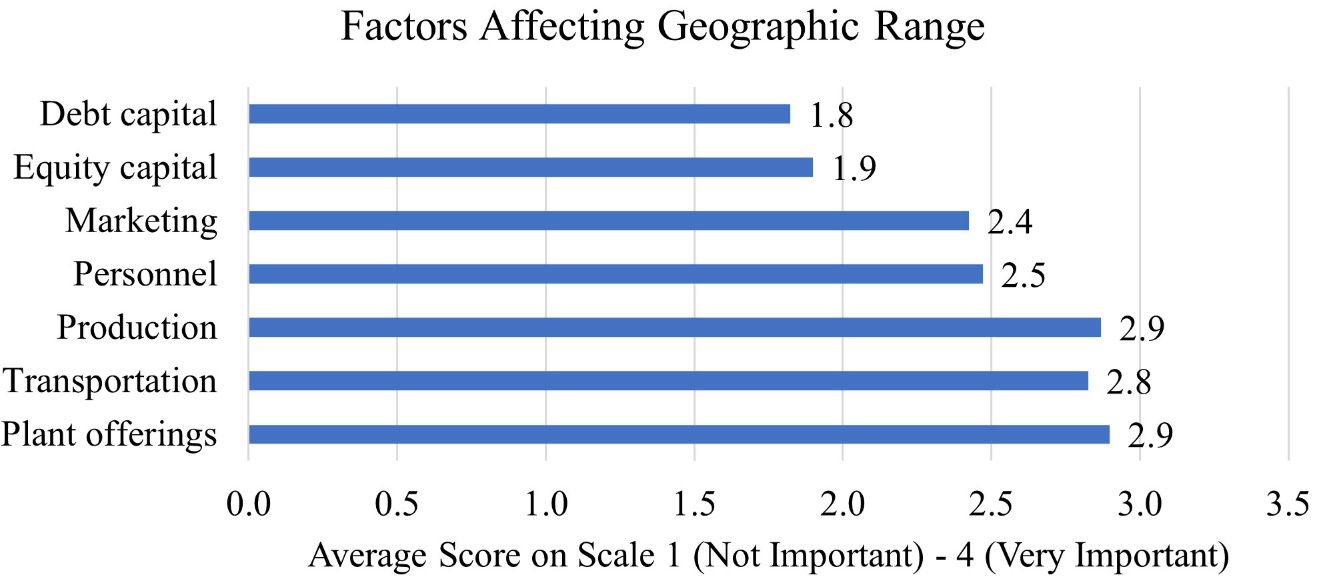
Green industry managers’ expectations and subjective considerations of factors affecting business performance are important considerations in assessing key areas of strengths, weaknesses, and opportunities. Survey respondents were asked to indicate the importance of various factors potentially affecting price determination, geographic expansion, and issues affecting the industry in general. This was done by rating each of the factors on a scale of one to four. Four representing “very important,” three representing “important,” two representing “minor importance,” and one representing “not important.” Each of the factors were averaged as shown in Figure 25. The potential factors limiting the geographic range or trading area for Florida green industry firms include plant offerings, transportation, production, personnel, marketing, equity capital, and debt capital. Production and plant offerings are the highest-ranked factors (2.9 out of 4.0) followed by transportation (2.8), personnel (2.5), marketing (2.4), equity capital (1.9), and debt capital (1.8).
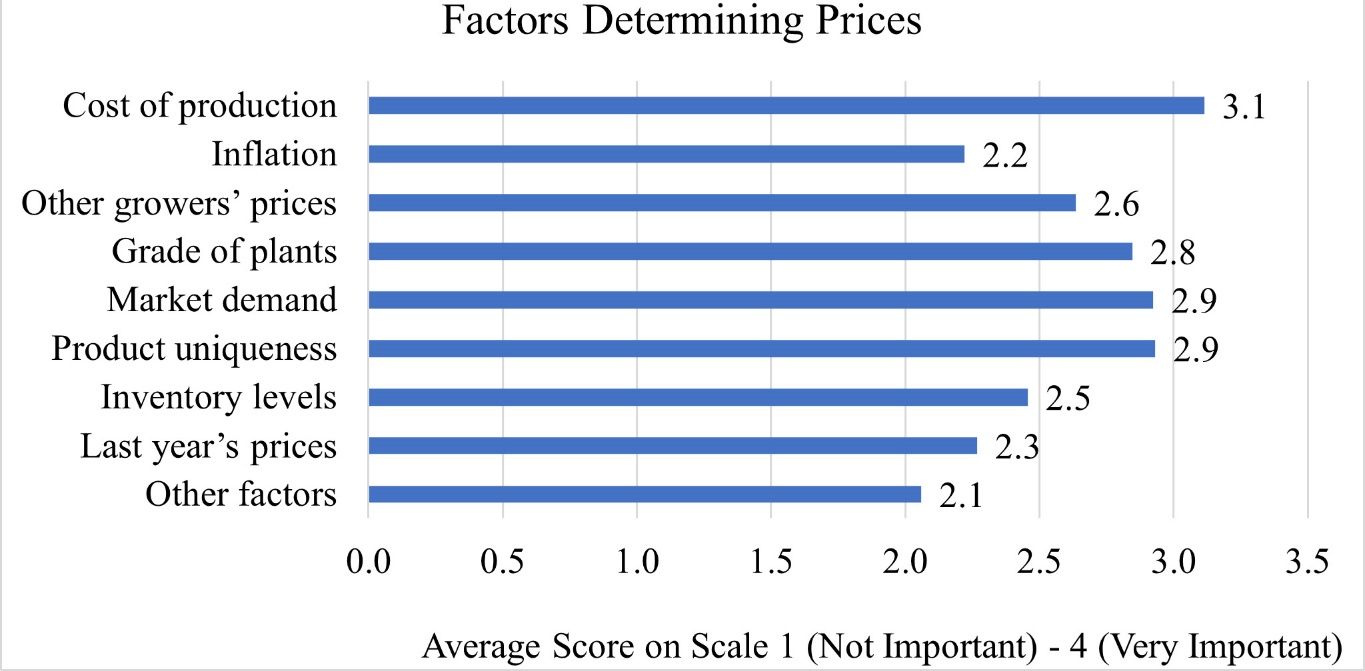
The potential factors affecting product included inventory levels, product uniqueness, market demand, grade of plants, other grower’s prices, inflation, cost of production, and other factors (Figure 26). The highest-rank factor that affects price was cost of production (average score of 3.1 out of 4.0) followed by product uniqueness and market demand (2.9), grade of plants (2.8), other grower’s prices (2.6), inventory levels (2.5), last year’s prices (2.3), inflation (2.2), and other factors (2.1).
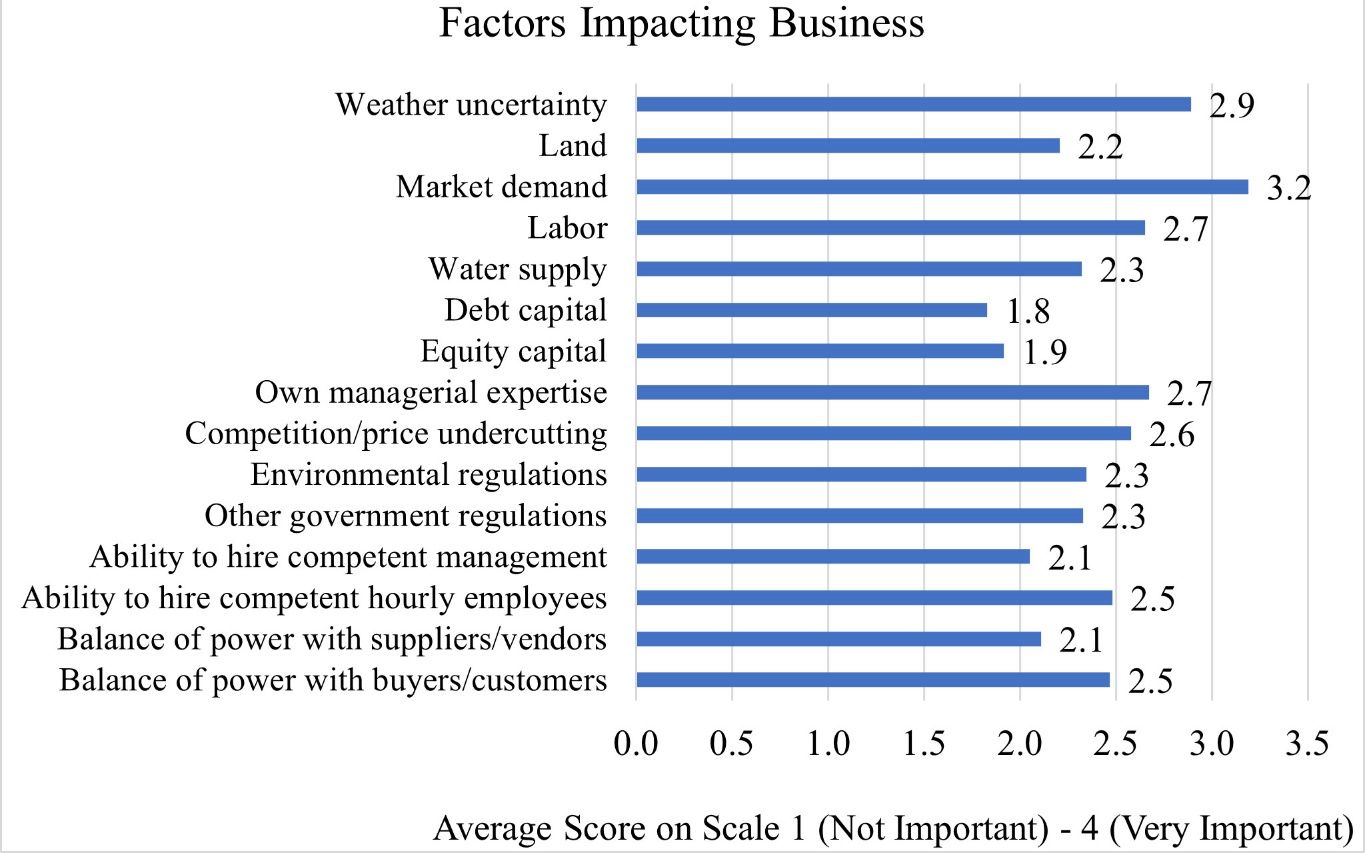
The potential factors that impacted the overall business environment included balance of power with buyers/customers, balance of power with suppliers/vendors, ability to hire competent hourly employees, ability to hire competent management, other government regulations, environmental regulations, competition/price undercutting, own managerial expertise, equity capital, debt capital, water supply, labor, market demand, land, and weather uncertainty. As shown in Figure 27, the top four factors that affected business included market demand as the highest-ranked factor (average score of 3.2 out of 4.0) followed by weather uncertainty (2.9), own managerial expertise (2.7), and labor (2.7). Other factors impacting business included competition/price undercutting (2.6), balance of power with buyers/customers (2.5), ability to hire competent hourly employees (2.5), other government regulations (2.3), environmental regulations (2.3), water supply (2.3), land (2.2), balance of power with suppliers/vendors (2.1), ability to hire competent management (2.1), equity capital (1.9), and debt capital (1.8).
Summary and Implications
The horticulture industry is vital for Florida’s agriculture economy. Industry leaders and stakeholders can use the information presented in this report to advocate and communicate the importance of the green industry with other agriculture leaders and state government. Not only can the information in the report serve as a comparative benchmark for individual firms to use to compare their business activities to, but it presents the value of the overall horticulture industry at a broader scope. Industry stakeholders could benefit from participating in more modern marketing practices and management strategies, and adopting and using the social media that their consumer bases increasingly rely on. Firms can also reduce time- and resource-intensive watering methods, which will result in less labor input and better environmental stewardship. At most, 52 percent of the firms remove infected plants as an IPM strategy. There is room for investment into research and education programs related to IPM. These options include investigating how to get more green industry firms to integrate more IPM strategies into their practices and how to best educate the firms on new or improved strategies.
References
Hodges, A. W., H. Khachatryan, M. Rahmani, and C. Court. 2017. “Economic Survey of the Environmental Horticulture Industry in Florida in 2015.” FE1031. EDIS (5) https://doi.org/10.32473/edis-fe1031-2017
Hall, C. R., A. W. Hodges, H. Khachatryan, and M.A. Palma. 2020. “Economic Contributions of the Green Industry in the United States in 2018.” Journal of Environmental Horticulture (2020) 38 (3): 73–79. https://doi.org/10.24266/0738-2898-38.3.73
Khachatryan, H., A. W. Hodges, C. R. Hall, and M. A. Palma. 2020. “Production and Marketing Practices and Trade Flows in the United States Green Industry, 2018.” Southern Cooperative Series Bulletin #421. Southern Association of Agricultural Experiment Station Directors.